EXTEND
& PRETEND:
Shifting Risk to the Innocent.
Markets never repeat themselves but they often rhyme. This rally feels
like the same sonnet we experienced in 1987. As in a sonnet, it is
following a strict rhyme scheme and specific structure.
In 1987 the rally began gaining steam in the spring when it already seemed
overbought and extended. The rally had initially started in October 1986
at DOW 1400, but during the spring of 1987 it began to accelerate. It not
only didn�t correct, but continued to gain momentum. Despite all the
pundits saying it was about to correct, it just kept going up. By early
fall the bears had capitulated and the public was scrambling to avoid
missing further gains. They were quickly rewarded as the market moved even
higher. No bad news, overextended fundamentals or technical warnings
could stop the rise. The DOW was soon over 2700 for an approximate 93%
rise.
Then suddenly in October 1987, out of nowhere, the crash hit. It was
stunning. The market gave back 22.6% in one day. What was later
called Black Monday left a pale over the US that was palpable. In a matter
of days the market surrendered the entire gains it had achieved over the
previous year.
Before you
write me off too quickly as trying to draw too close a comparison, let me
tell you why it really feels the same. It isn�t just the rise or rhyme;
it�s the reason for both.
Since March 2009 the current rally has moved from a 666 low on the S & P
500 to a recent high of 1220, for an 83% increase in just over a year. The
rises are similar to 1987 but so are the critical elements of risk and how
risk has been shifted to the innocent. Before I discuss how this risk has
shifted through Dynamic Hedging, Capital Arbitrage and Regulatory
Arbitrage, let me first briefly talk about the realities of risk versus
perceptions.
REALITIES OF RISK
USING
STATISTICS TO SHOW US HOW THE INNOCENT GET LULLED INTO GETTING 'MUGGED'!
Let's say
there's a statistically unlikely event that takes place 1% of the time. As
an example, suppose, just for argument's sake, that if you go for a walk
in a particular Chicago neighborhood, statistically the police tell you,
1% of the time you will get mugged in this neighborhood.
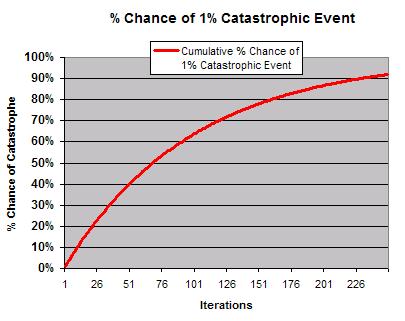
So, if you
go out for a walk one time, you have a 99% chance of not getting mugged
and a 1% chance of getting hurt. But suppose you go out for one walk every
day for 10 days, the chance that you will get hit on one of those
occasions rises. The way it's calculated is by figuring the odds that the
LIKELY event will obtain at every single iteration and then subtracting
that from 100%. The equation is:
 D
= 1-(1-P)^N
D
= 1-(1-P)^N
Where:
D=cumulative percentage chance of disaster
P= Percentage Chance of disaster on each opportunity (iteration)
N=number of iterations
So, if you
go out for 10 walks, your chance of getting into trouble is:
1-(1-.01)^10 = 9.6%.
And if you
go out for a walk every day for, say, 90 days, your chance of getting hurt
is
1-(1-.01)^90 = 59.5%.
The graph
above shows what the series looks like. (1)
And in
this scenario, if you go out for a walk every trading day of the year
(about 252 times) the odds are about 92% that you will meet your demise.
But the
funny thing about our human nature is that if, say, you went out for 252
walks in our Chicago neighborhood and came back 252 times, without having
had any violent encounters with our Chicago�s city folk, you would assume
that experience was teaching you that there was very little danger. Indeed
it might be, if you didn't already know the likelihood of getting mugged.
As human
beings we are especially primed to generalize from experience (that's
science), but most especially to generalize from our most recent
experiences (which is less reliable science--or anecdotal evidence). So,
the more walks we go on without getting mugged the less likely we FEEL it
to be that we will ever get mugged, irrespective of what statistics might
tell us. As our risk increases, statistically speaking, we feel safer
and safer.
We are all
familiar with the expression "tempting fate." One has to wonder if we
might be somewhere fairly far along on the curve charted above, feeling
safer and safer carrying all these economic loads, but with an ever
greater and greater chance of developing the incidence of one or another
severe, "dislocating," and "unlikely" event. (1)
LAW OF
COMPOUNDING NUMBERS
20% Gains
for 3 years then a 20% loss results in = 8.4% CAGR
20% Gains
for 3 years then a 35% loss results in = 2.9% CAGR
See the illusion?
Our government is doing us no favors with
an artificial extend and pretend strategy that makes us feel safer and
which consequentially starts the public spending and investing again.
Based on risk, it is both premature and dangerous to your financial
health.
DYNAMIC HEDGING
PORTFOLIO INSURANCE
 When
the investigations were made by the government into the causes of the 1987
crash, it was discovered that it was primarily because of the wide
implementation of what was then called Portfolio Insurance. It was the
rage in the late 80�s as a way of removing risk from portfolios. At its
core, Portfolio Insurance involved trend following methodologies.
Consequentially, the more stocks moved up, the more your portfolio called
for more buying. It was self re-enforcing. It also worked in reverse and
consequentially the sudden crash. The investigations prompted the
introduction of circuit breakers into exchanges to limit downside moves in
any given period of time.
When
the investigations were made by the government into the causes of the 1987
crash, it was discovered that it was primarily because of the wide
implementation of what was then called Portfolio Insurance. It was the
rage in the late 80�s as a way of removing risk from portfolios. At its
core, Portfolio Insurance involved trend following methodologies.
Consequentially, the more stocks moved up, the more your portfolio called
for more buying. It was self re-enforcing. It also worked in reverse and
consequentially the sudden crash. The investigations prompted the
introduction of circuit breakers into exchanges to limit downside moves in
any given period of time.
SON-OF-PORTFOLIO INSURANCE
Though Portfolio lost its appeal after the 1987 crash, it was replaced by
what many at the time referred to as the son-of-portfolio insurance. It
was called Dynamic Hedging.
Dynamic hedging is a technique that is
widely used by
derivatives
dealers to
hedge
gamma
or
vega
exposures. Because it involves adjusting a hedge as the
underlier
moves�often several times a day�it is "dynamic. Dynamic hedging is
delta hedging of a non-linear position with
linear instruments like spot positions, futures or forwards.
 The
deltas
of the non-linear position and linear hedge position offset, yielding a
zero delta overall. However, as the underlier's value moves up or down,
the delta of the non-linear position changes while that of the linear
hedge does not. The deltas no longer offset, so the linear hedge has to be
adjusted (increased or decreased) to restore the delta hedge. This
continual adjusting of the linear position to maintain a delta hedge is
called dynamic hedging. (2)
The
deltas
of the non-linear position and linear hedge position offset, yielding a
zero delta overall. However, as the underlier's value moves up or down,
the delta of the non-linear position changes while that of the linear
hedge does not. The deltas no longer offset, so the linear hedge has to be
adjusted (increased or decreased) to restore the delta hedge. This
continual adjusting of the linear position to maintain a delta hedge is
called dynamic hedging. (2)
Dynamic Hedging was a major contributor to the tech bubble run-up in the
late 1990�s, the 2002-2007 run-ups and the present rally. It is one of the
reasons this rally feels so similar and is being driven for similar
reasons. But there is more.
The risks are even greater today because Dynamic Hedging has allowed other
advancements to be layered on top of it.
With the post tech bubble crash in 2000 and the subsequent advent of the
housing bubble explosion from 2002 to 2007 we saw the emergence of Capital
Arbitrage.
CAPITAL ARBITRAGE
I am defining Capital Arbitrage here (as opposed to the slightly different
Regulatory Arbitrage) as the price difference in the cost of capital
through the reduction of risk via various methods including removing
debt obligations (risk) from the balance sheet. The price difference in
 capital
costs is reflected in a lower interest coupon or basis point spread.
capital
costs is reflected in a lower interest coupon or basis point spread.
The advancements in securitization and financial engineering have allowed
this to happen in a dramatic fashion over the last decade.
Consequentially, the ability to extend credit prior to the financial
crisis was almost exponential in its growth - all of which was hedged
through Dynamic Hedging and through newer techniques such as Credit
Default Swaps (CDS). Capital arbitrage fostered yet another bubble until
the reversal once again happened and we had the expected explosive
momentum to the downside.
The table below is a simplified summary of a lot of the work outlined in
recent
Extend & Pretend series articles and the
Sultans of Swap series. It illustrates that almost all forms of
standard accounting practices & procedures have been circumvented through
modern Capital Arbitrage techniques. Whether Corporate accounting with its
cost /accrual structure, Financial and bank accounting with its reserve
and capital ratios or Government accounting with its cash account
accounting, it doesn�t matter, they have all been systematically
exploited.
There is only one goal, obscure debt
or financial obligations, commitments, guarantees or contingent
liabilities. This is to allow an improvement or maintenance in the cost of
capital and thereby allow further increases and gearing (leverage).
REGULATORY
ARBITRAGE
 Today
we have layered yet another layer of risk onto the already existing
structure. It is called Regulatory Arbitrage.
Today
we have layered yet another layer of risk onto the already existing
structure. It is called Regulatory Arbitrage.
Regulatory arbitrage
is any transaction that has little or no economic impact on a financial
institution while either increasing its capital or decreasing its required
capital. Just as trading
arbitrage
identifies and exploits inconsistencies in market prices, regulatory
arbitrage identifies and exploits inconsistencies in capital regulations.
Regulatory arbitrage undermines the effectiveness of capital regulations.
It is one of the primary motivators for regulators to continually improve
capital requirements. (3)
This new strategy is again intended to remove risks but in this case you
are transferring it to a sovereign government in a number of fashions.
Whether debt or contingent liability obligations, the strategy involves
the sovereign government assuming responsibility and being forced to
create the credit to further the arbitrage.
It is highly sophisticated with many elements but like the previous
stages, it will end badly and likely violently. This time the probability
is that it ends when sovereign governments fail or are unable to attract
investors at satisfactory rates (i.e. Greece now having to pay over 9% on
10 Year Treasuries versus an expected 3.5%). Credit rating downgrades and
forced increases in collateral calls will be the catalyst. We are now
seeing just the tip of this iceberg throughout the southern European
countries (PIIGS).
�TOO BIG TO FAIL or are they TOO BIG TO SAVE?�
We have �saved� the following by the public assuming the liabilities after
all the profits were earned and distributed.
1.
Fannie Mae / Freddie Mac Agencies 1.5 - 2+T
2.
AIG 180B
3.
GM / GMAC 45B
4.
TARP � Banks 700B
5.
FDIC � Regional Banks ??
===
~ $3 Trillion
CONCLUSION
When markets stop functioning any algorithm breaks down.
Trading algorithms are based on certain fundamental assumptions that have
proven invalid over long
periods of time. The false assumptions include:
1.
Continuous market
liquidity
2.
Continuity of markets
3.
Counterparty Risk
The exposure these �discontinuities� create is well respected but to my
knowledge it is still not able to be modeled effectively. The trick
therefore is to make as much money as possible before �time� delivers the
proverbial �fat tail�. In layman�s language, as former Citigroup CEO
Charles Prince so famously quipped� it is a game of musical chairs and
�you must get up and dance while the music is playing�. If you don�t
�dance� your competitor will have the competitive advantage to be able to
use an improved stock price to take you out. It forces fiduciary risk
taking. As in a child�s game, it takes enforced rules or the cheating
begets cheating.
If the Legislators and Regulators won�t address excessive fiduciary risk
taking � then the market will in a violent and unexpected fashion - with
the innocent as the casualties.
Sign Up for the next release in the
Extend & Pretend series:
Commentary
SOURCES:
(1) John Hussman�s Analysis � (Unable to find link � noted it years ago
� sorry John)
(2)
Dynamic Hedging
� The Risk Glossary.com
(3)
Regulatory Arbitrage
� The Risk Glossary.com
The
last Extend & Pretend article:
EXTEND & PRETEND - Uncle Sam, You Sly Devil!
Gordon T Long
Tipping Points
Mr. Long is a former senior group executive with IBM & Motorola, a
principle in a high tech public start-up and founder of a private venture
capital fund. He is presently involved in private equity placements
internationally along with proprietary trading involving the development &
application of Chaos Theory and Mandelbrot Generator algorithms.
Gordon T Long is not a registered advisor and does not give investment
advice. His comments are an expression of opinion only and should not be
construed in any manner whatsoever as recommendations to buy or sell a
stock, option, future, bond, commodity or any other financial instrument
at any time. While he believes his statements to be true, they always
depend on the reliability of his own credible sources. Of course, he
recommends that you consult with a qualified investment advisor, one
licensed by appropriate regulatory agencies in your legal jurisdiction,
before making any investment decisions, and barring that, you are
encouraged to confirm the facts on your own before making important
investment commitments.
� Copyright 2010 Gordon T Long. The information herein was obtained from
sources which Mr. Long believes reliable, but he does not guarantee its
accuracy. None of the information, advertisements, website links, or any
opinions expressed constitutes a solicitation of the purchase or sale of
any securities or commodities. Please note that Mr. Long may already have
invested or may from time to time invest in securities that are
recommended or otherwise covered on this website. Mr. Long does not intend
to disclose the extent of any current holdings or future transactions with
respect to any particular security. You should consider this possibility
before investing in any security based upon statements and information
contained in any report, post, comment or recommendation you receive from
him.