|
JOHN RUBINO'SLATEST BOOK |
||||||||||||||||||||||||||||||||||||||||||||||||||||||||||||||||||||||||||||||||||||||||||||||||||||||||||||||||||||||||||||||||||||||||||||||||||||||||||||||||||||||||||||||||||||||||||||||||||||||||||||||||||||||||||||||||||||||||||||||||||||||||||||||||||||||||||||||||||||||||||||||||||||||||||||||||||||||||||||||
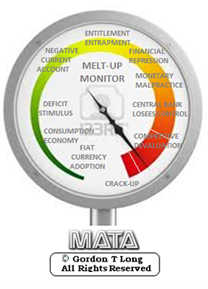
"MELT-UP MONITOR "
Meltup Monitor: FLOWS - The Currency Cartel Carry Cycle - 09 Dec 2013 Meltup Monitor: FLOWS - Liquidity, Credit & Debt - 04 Dec 2013 Meltup Monitor: Euro Pressure Going Critical - 28- Nov 2013 Meltup Monitor: A Regression-to-the-Exponential Mean Required - 25 Nov 2013
|

![]()
"DOW 20,000 "
Lance Roberts Charles Hugh Smith John Rubino Bert Dohman & Ty Andros
|

HELD OVER
Currency Wars
Euro Experiment
Sultans of Swap
Extend & Pretend
Preserve & Protect
Innovation
Showings Below
"Currency Wars "
|


"SULTANS OF SWAP" archives open ACT II ACT III
ALSO Sultans of Swap: Fearing the Gearing! Sultans of Swap: BP Potentially More Devistating than Lehman! |

"EURO EXPERIMENT"
archives open EURO EXPERIMENT : ECB's LTRO Won't Stop Collateral Contagion!
EURO EXPERIMENT: |

![]()
"INNOVATION"
archives open |

"PRESERVE & PROTE CT"
archives open |

RECAP
Weekend Jan. 10th, 2016
Follow Our Updates
on TWITTER
https://twitter.com/GordonTLong
AND FOR EVEN MORE TWITTER COVERAGE
![]()
| JANUARY | ||||||
| S | M | T | W | T | F | S |
| 1 | 2 | |||||
| 3 | 4 | 5 | 6 | 7 | 8 | 9 |
| 10 | 11 | 12 | 13 | 14 | 15 | 16 |
| 17 | 18 | 19 | 20 | 21 | 22 | 23 |
| 24 | 25 | 26 | 27 | 28 | 29 | 30 |
| 31 | ||||||
KEY TO TIPPING POINTS |
| 1- Bond Bubble |
| 2 - Risk Reversal |
| 3 - Geo-Political Event |
| 4 - China Hard Landing |
| 5 - Japan Debt Deflation Spiral |
| 6- EU Banking Crisis |
| 7- Sovereign Debt Crisis |
| 8 - Shrinking Revenue Growth Rate |
| 9 - Chronic Unemployment |
| 10 - US Stock Market Valuations |
| 11 - Global Governance Failure |
| 12 - Chronic Global Fiscal ImBalances |
| 13 - Growing Social Unrest |
| 14 - Residential Real Estate - Phase II |
| 15 - Commercial Real Estate |
| 16 - Credit Contraction II |
| 17- State & Local Government |
| 18 - Slowing Retail & Consumer Sales |
| 19 - US Reserve Currency |
| 20 - US Dollar |
| 21 - Financial Crisis Programs Expiration |
| 22 - US Banking Crisis II |
| 23 - China - Japan Regional Conflict |
| 24 - Corruption |
| 25 - Public Sentiment & Confidence |
| 26 - Food Price Pressures |
| 27 - Global Output Gap |
| 28 - Pension - Entitlement Crisis |
| 29 - Central & Eastern Europe |
| 30 - Terrorist Event |
| 31 - Pandemic / Epidemic |
| 32 - Rising Inflation Pressures & Interest Pressures |
| 33 - Resource Shortage |
| 34 - Cyber Attack or Complexity Failure |
| 35 - Corporate Bankruptcies |
| 36 - Iran Nuclear Threat |
| 37- Finance & Insurance Balance Sheet Write-Offs |
| 38- Government Backstop Insurance |
| 39 - Oil Price Pressures |
| 40 - Natural Physical Disaster |
Reading the right books?
No Time?

We have analyzed & included
these in our latest research papers Macro videos!
![]()
OUR MACRO ANALYTIC
CO-HOSTS
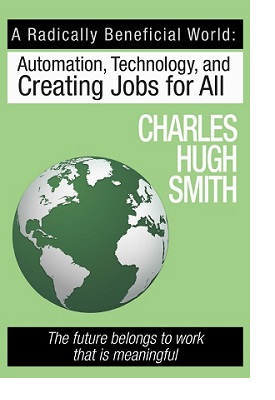
John Rubino's Just Released Book

![]()
Charles Hugh Smith's Latest Books
![]()
![]()
Our Macro Watch Partner
Richard Duncan Latest Books

MACRO ANALYTIC
GUESTS
F William Engdahl

![]()

![]()

![]()

![]()

![]()
OTHERS OF NOTE
![]()
![]()

![]()


![]()
Book Review- Five Thumbs Up
for Steve Greenhut's
Plunder!
![]()
|
Have your own site? Offer free content to your visitors with TRIGGER$ Public Edition!
Sell TRIGGER$ from your site and grow a monthly recurring income!
Contact [email protected] for more information - (free ad space for participating affiliates).
HOTTEST TIPPING POINTS |
Theme Groupings |
||
We post throughout the day as we do our Investment Research for: LONGWave - UnderTheLens - Macro
|
|||
|
MOST CRITICAL TIPPING POINT ARTICLES TODAY
|
|
||
TIPPING POINTS, STUDIES, THESIS, THEMES & SII COVERAGE THIS WEEK PREVIOUSLY POSTED - (BELOW)
|
|||
| MOST CRITICAL TIPPING POINT ARTICLES THIS WEEK - Jan 3rd, 2016 - Jan 9th, 2016 | |||
| TIPPING POINTS - This Week - Normally a Tuesday Focus | |||
| BOND BUBBLE | 1 | ||
| RISK REVERSAL - WOULD BE MARKED BY: Slowing Momentum, Weakening Earnings, Falling Estimates | 2 | ||
| GEO-POLITICAL EVENT | 3 | ||
| CHINA BUBBLE | 4 | ||
| JAPAN - DEBT DEFLATION | 5 | ||
EU BANKING CRISIS |
6 |
||
2- RISK REVERSAL HAPPY NEW YEARWhat a Start!
Submitted by Tyler Durden on 01/04/2016 - 12:53 |
01-15-16 | 2- Risk Reversal | |
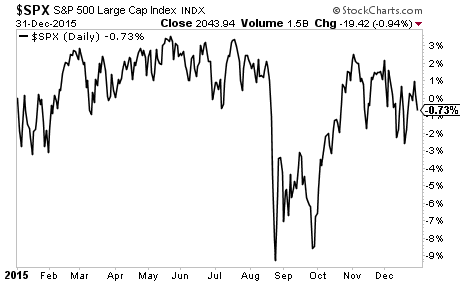
Three Reasons Stocks Will Crater in 2016Phoenix Capital Research on 01/04/2016 Last year (2015) likely will represent the top for the bull market that began in 2009. Stocks finished the year down, representing the first down year since the March 2009 bottom.
Many analysts will point to the August sell-off as the reason stocks performed so badly, however, looking at the chart, stocks struggled throughout the year, long before the August sell-off. Indeed, at best the S&P 500 was up 3% for the year! Things are only going to worsen from here. FIRST REASON - Fed Tightening
SECOND REASON - US Recession
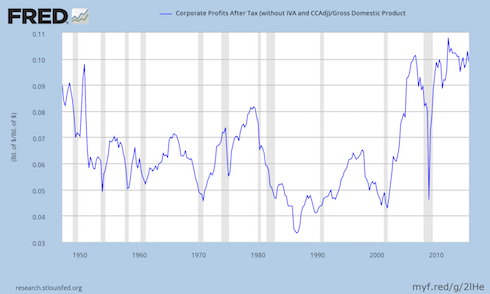
THIRD REASON - Profits Relative to GDP Rolling Over
With the US back in recession and the Fed tightening, both #s 1 and 2 are over. This leaves #3. And while productivity did increase marginally in first half of 2015, it’s now rolling over again towards 0%. In short, the sources of growth for US corporates have all dried up. Stocks have yet to adjust to this, but when they do it’s going to be an all out collapse. |
|||
| TO TOP | |||
| MACRO News Items of Importance - This Week | |||
GLOBAL MACRO REPORTS & ANALYSIS |
|||
US ECONOMIC REPORTS & ANALYSIS |
|||
| CENTRAL BANKING MONETARY POLICIES, ACTIONS & ACTIVITIES | |||
| Market - WEDNESDAY STUDIES | |||
| STUDIES - MACRO pdf | |||
TECHNICALS & MARKET Once again, the S&P 500 catches down to The Fed's balance sheet...
|
01-06-1 |
STUDY | |
First $1.5 Billion Hedge Fund Casualty Of 2016
|
|||
| COMMODITY CORNER - AGRI-COMPLEX | |||
| THESIS - Mondays Posts on Financial Repression & Posts on Thursday as Key Updates Occur | |||
| 2015 - FIDUCIARY FAILURE | 2015 | THESIS 2015 |  |
| 2014 - GLOBALIZATION TRAP | 2014 |  |
|
 |
|||
|
2013 2014 |
 |
||
FINANCIAL REPRESSION |
01-04-16 | FINANCIAL REPRESSION |
|
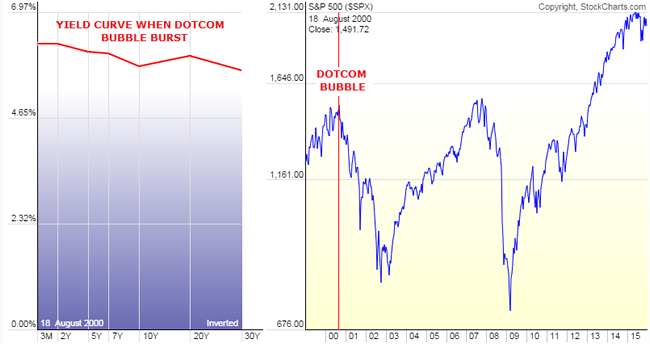
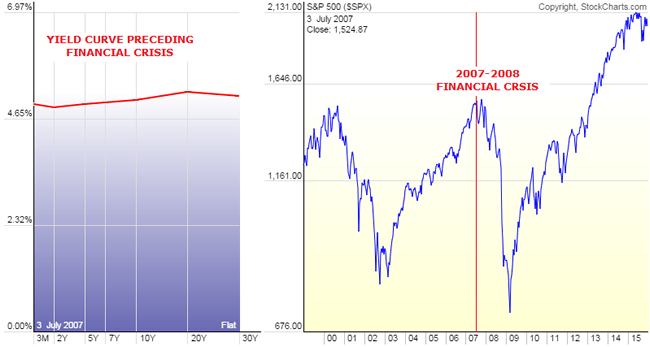
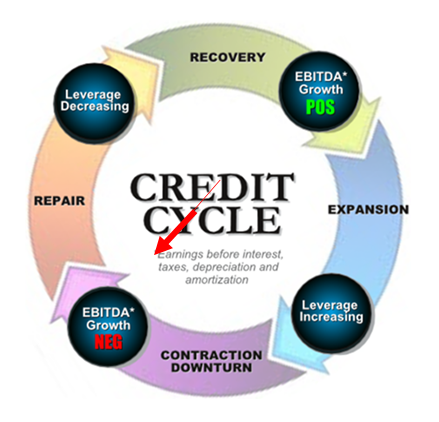
A “WITCH’S BREW” BUBBLING IN BOND ETFsWe believe the Credit Cycle has turned and with it will come some massive unexpected shocks. One of these will be the fall out in the Bond Market, centered around the dramatic growth explosion in Bond ETFs coupled with the post financial crisis regulatory changes that effectively removed banks from making markets in corporate bonds. It is a ‘Witch’s Brew’ with a flattening yield curve bringing it to a boil. 2000 – Flat to Inverted Yield Curve
2007 – Flat Yield Curve
TODAY – Signalling a Flattening at Seriously Lower Bound!
PRESSURES FLATTENING THE YIELD CURVE
In the last six weeks, the spread between the Ten Year and the Two year treasuries has flattened exactly 25 basis points, which is EXACTLY the same amount that the Fed just moved the Fed Funds target rate this past Wednesday. With investors starved for yield many are being forced further out on the yield curve taking rates down further and pushing prices up. Dan Norcini at http://traderdan.com lays it out pretty clearly:
THE “WITCH’S BREW” Many Including Morningstar Have Hyped “The Great New Yield Opportunity”
What has been sold to many investors, speculators and even desperate Fund Managers is using Bond ETFs to play the old “Roll Down the Yield Curve” Strategy. Here is how it works in case you are not familiar with the strategy.
YRA HARRIS WARNS “ALL HELL MAY BREAK LOOSE!” Legendary trader Yra Harris who we recently interviewed at the Financial Repression Authority has been pounding the table for some time but just issued this warning:
CONCLUSION What Yra doesn’t say is we now have $2.2 Trillion of troubled High Yield bonds peddled to yield starved investors since the financial crisis, which matches 2/3’s of the $3.5 Trillion increase in the Federal Reserves balance sheet during the same period. Additionally, there are well north of $60 Trillion of Bond ETFs out there with anyone guess on how many fast money speculators are playing the “Rolling Down the Yield Curve” Strategy now up against the warning Morningstar so clearly disclaimed: “the roll down strategy will lose a lot of steam if the yield curve flattens more than expected.” With serious liquidity issues clearly evident it should be interesting as a potential positioning scramble ensues. It somewhat reminds me of someone potentially shouting “FIRE” in a theater, except this times the theater doors will be barred and the only way out will be to have someone outside take your seat inside! ETF holders may find it easier to sell that old bridge over the East River in Brooklyn than get their money out of their ETFs. Maybe what we will actually soon hear is someone shouting “CUSTODIAL RISK!”
|
|||
2011 2012 2013 2014 |
 |
||
| THEMES - Normally a Thursday "Themes" Post & a Friday "Flows" Post | |||
I - POLITICAL |
|||
CENTRAL PLANNING - SHIFTING ECONOMIC POWER - STATISM
MACRO MAP - EVOLVING ERA OF CENTRAL PLANNING
|
G | THEME | |
| - - CRISIS OF TRUST - Era of Uncertainty | G | THEME | |
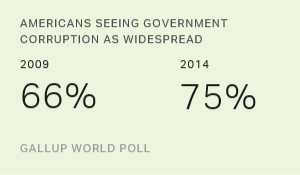
CORRUPTION & MALFEASANCE - MORAL DECAY - DESPERATION - RESENTMENT. |
US | THEME PAGE |  |
Submitted by Tyler Durden on 01/06/2016
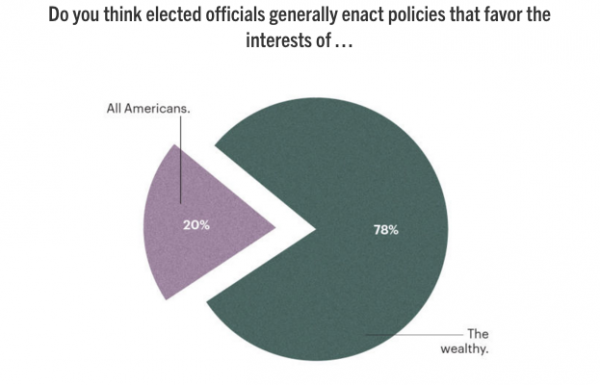
Gallup Explains Trump:"A Staggering 75% Of Americans Believe In Widespread Government Corruption"Back in July, when the HuffPo was covering Donald Trump's campaign in its "Entertainment Section" (they are not laughing now), and when not a single political pundit thought Trump had any chance of winning the GOP primary (now most of them do), we said that "Donald Trump's Soaring Popularity "Is The Country's Collective Middle Finger To Washington." Here is what we said:
Six months later, virtually everyone recognizes and admits that this is the case: a vote for Trump is not "a vote for Trump", It is a vote against the broken, corrupt, crony-capitalist model. Which explains why increasingly more are terrified he just may win. But what explains America's revulsion with the existing system? The answer comes from the latest Gallup article: "Explaining Trump: Widespread Government Corruption" in which it finds that once the silent majority of the population can identify the object of their distrust and anger - in this case Congress and the political status quo - and once they can subsequently identify an object that represents its opposite, the latter object's distance to the Oval Office becomes considerably shorter. From Gallup: Explaining Trump: Widespread Government Corruption It's been fashionable to make jokes about Congress' historically low approval ratings, unbelievable incompetence in the government and now, unfortunately, the perception of widespread government corruption. Pundits and talk-radio hosts have a field day with this. So do late-night comics. It's not funny anymore.
This sense of corruption probably contributes to much of the extreme anxiety and unrest we see today - including protests, lower voter turnout and increased interest in guns. Guns -- a symbol of freedom from government tyranny to many people -- are now a key voting issue. A quarter of U.S. voters say the presidential candidate they vote for must share their view on guns. Protests are growing in cities and campuses all around the country. Students and citizens generally have lost faith in their national institutions -- the biggest and most powerful of which is, of course, the federal government. The last presidential election had
The perception that there's widespread corruption in the national government could be a symptom of citizen disengagement and anger. Or it could be a cause -- we don't know. But it's very possible this is a big, dark cloud that hangs over this country's progress. And it might be fueling the rise of an unlikely, non-traditional leading Republican candidate for the presidency, Donald Trump. To make matters worse, that dark cloud appears to be hanging over the growth of small business, which is where virtually all new GDP growth and good jobs originate. Simply put, startups and shootups (small businesses that grow larger) have been in a death spiral. The U.S. Census Bureau reported that the total number of business startups and business closures per year crossed for the first time in 2008. And the economy isn't growing nearly fast enough -- it's been running at an average rate of 2% since the 2008 financial collapse and the Great Recession. Just to compare, following the recession of 1981-1982, GDP grew for six years at 4.5% -- one of our greatest economic eras in history. Jobs haven't come back. According to the U.S. Bureau of Labor Statistics, the percentage of the total adult population that has a full-time job has been hovering around 48% since 2010 -- the lowest full-time employment level since 1983. This is why the middle class has been dangerously shrinking. You don't have to connect too many dots to conclude that if a government has an alarmingly high appearance of widespread corruption -- and that same government creates regulations that businesses cite as a leading barrier to growth -- then entrepreneurs might be reluctant to stick their necks out to start a business. Or to boom the businesses they already have. Why would they start or boom a business if they think a corrupt government is creating rules and regulations that don't serve their interests -- but rather rules that serve the interests of
Any wonder why so many Americans want a candidate who's outside of that system? |
|||
Submitted by George Washington on 01/06/2016 How Corrupt Is the American GovernmentGovernment corruption has become rampant:
The biggest companies own the D.C. politicians. Indeed, the head of the economics department at George Mason University has pointed out that it is unfair to call politicians “prostitutes”. They are in fact pimps … selling out the American people for a price. Government regulators have become so corrupted and “captured” by those they regulate that Americans know that the cop is on the take. Institutional corruption is killing people’s trust in our government and our institutions. Neither the Democratic or Republican parties represent the interests of the American people. Elections have become nothing but scripted beauty contests, with both parties ignoring the desires of their own bases. Indeed, America is no longer a democracy or republic … it’s officially an oligarchy. And the allowance of unlimited campaign spending allows the oligarchs to purchase politicians more directly than ever. No wonder polls show that the American people say that the system is so thoroughly corrupt that government corruption is now Americans’ number one fear. And politicians from both sides of the aisle say that corruption has destroyed America. And see this. Moreover, there are two systems of justice in America … one for the big banks and other fatcats … and one for everyone else. Indeed, Americans have less access to justice than Botswanans … and are more abused by police than Kazakhstanis. Big Corporations Are Also Thoroughly CorruptBut the private sector is no better … for example, the big banks have literally turned into criminal syndicates engaged in systemic fraud. Wall Street and giant corporations are literally manipulating every single market. And the big corporations are cutting corners to make an extra penny … wreaking havoc with their carelessness. For example:
(Further examples here, here, here, here and here.) We’ve Forgotten the Lessons of HistoryThe real problem is that we need to learn a little history:
Beyond Partisan PoliticsConservatives and liberals tend to blame our country’s problems on different factors … but they are all connected. The real problem is the malignant, symbiotic relationship between big corporations and big government. |
|||
Authored by Paul Craig Roberts, The Rule Of Law No Longer Exists In Western CivilizationMy work documenting how the law was lost began about a quarter of a century ago. A close friend and distinguished attorney, Dean Booth, first brought to my attention the erosion of the legal principles on which rests the rule of law in the United States. My columns on the subject got the attention of an educational institution that invited me to give a lecture on the subject. Subsequently, I was invited to give a lecture on “How The Law Was Lost” at the Benjamin Cardozo School of Law in New York City. The work coalesced into a book, The Tyranny Of Good Intentions, coauthored with my research associate, Lawrence M. Stratton, published in 2000, with an expanded edition published in 2008. We were able to demonstrate that Sir Thomas More’s warning about prosecutors and courts disregarding law in order to more easily convict undesirables and criminals has had the result of turning law away from being a shield of the people and making it into a weapon in the hands of government. That is what we witness in the saga of the Hammonds, long-time ranchers in the Harney Basin of Oregon. With the intervention of Ammon Bundy, another rancher who suffered illegal persecution by the Bureau of Land Management but stood them off with help from armed militia, and his supporters, the BLM’s decades long persecution of the innocent Hammonds might have come to a crisis before you read this. Bundy and militiamen, whose count varies from 15 to 150 in the presstitute media, have seized an Oregon office of the BLM as American liberty’s protest against the frame-up of the Hammonds on false charges. As I write the Oregon National Guard and FBI are on the way. The militiamen have said that they are prepared to die for principles, and the rule of law is one of them.Of course, the presstitute media is making the militiamen into the lawbreakers—and even calling them terrorists—and not the federal government’s illegal prosecution of the Hammonds, whose crime was their refusal to sell their ranch to the government to be included in the Masher National Wildlife Refuge. If there are only 15 militiamen, there is a good chance that they will all be killed, but if there are 150 armed militiamen prepared for a shootout, the outcome could be different. I cannot attest to the accuracy of this report of the situation (the resources required to verify the information in this account of how the government escalated a “crisis” out of the refusal of a family to bend is beyond the resources of this website) - However, the story fits perfectly with everything Lawrence Stratton and I learned over the years that we prepared our book on how the law was lost. This account of the persecution of the Hammonds is the way government behaves when government has broken free of the rule of law. I can attest with full confidence that the United States no longer has a rule of law. The USA is a lawless country. By that I do not mean what conservative Republicans mean, which is, if I understand them, that racial minorities violate law with something close to impunity. What I mean is that only the mega-banks and the One Percent have legal protection, and that is because these people control the government. For everyone else law is a weapon in the hands of the government to be used against the American people. The fact that the shield of law no longer exists for American citizens is why, according to US Department of Justice statistics, only 4 percent of federal felonies ever go to trial. Almost the entirety of federal felonies are settled by coerced plea bargains that force defendants to admit to crimes that they did not commit in order to avoid “expanded indictments” that, if presented to the typical stupid, trusting, gullible American “jury of their peers,” would lock them away for hundreds of years. American justice is a joke. It does not exist. You can see this in the American prison population. “Freedom and Democracy” America not only has the largest percentage of its population in prison than any country on the planet, but also the largest number of prisoners. If you consider that “authoritarian” China has four times the population of the United States but fewer prisoners, you understand that “authoritarian” China has a more protective rule of law than the United States. Compared to “freedom and democracy America,” Russia has hardly anyone in prison. Yet, Washington and its media whores have defined the President of Russia as “the new Hitler.” The only thing we can conclude from the facts is that the United States Government and those ignorant fools who worship it are evil incarnate. Out of evil comes dictatorship. The White House Fool, at best a two-bit punk, has decided that he doesn’t like the Second Amendment to the US Constitution any more than he likes any of the other constitutional protections of US citizens. He is looking for dictatorial methods, that is, unlegislated executive orders, to overturn the Second Amendment. He has the corrupt US Department of Justice, a criminal organization, looking for ways for the dictator to overturn both Congressional legislation and Supreme Court rulings. The media whores have fallen in line with the would-be dictator. All we hear is “gun violence.” If only Karl Marx were still with us. He would ridicule those who turn inanimate objects into purposeful actors. It is extraordinary that the American left-wing thinks that guns, not people, kill people. The position of the “progressive left-wing” in the United States is perplexing. Here are Americans, immersed into a police state, as are the Hammonds, and the progressive left-wing wants to disarm the population. Whatever this “progressive left-wing opposition” is, it has nothing in common with revolutionaries. The American left-wing is totally irrevelant, a defeated force that sold out and no longer represents the people or the truth. If protesting the murder of a young black American by Ferguson police is not legitimate and the protesters are “terrorists,” why aren’t the Oregon protestors terrorists for trying to protect jailbirds from their “lawful sentence”? This is the wrong question. It really is discouraging that the American black community is unable to understand that if any American can be dispossessed, all Americans can be dispossessed. It is also discouraging that RT decided to play the race card instead of comprehending that law is no longer a shield of the American people but is a weapon in the hands of Washington. Why doesn’t RT at least listen to the President of Russia, who states repeatedly that America and the West are lawless. Putin is correct. America and its vassals are lawless. No one is safe from the government. |
|||
|
|||
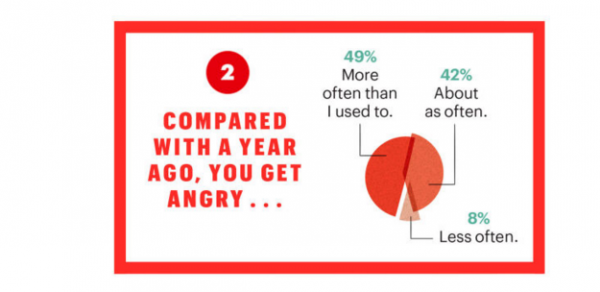
Submitted by Tyler Durden on 01/06/2016 "We The People Are Pissed"New Poll Finds Whites And Republicans Are Angriest Americans
If Donald Trump’s poll numbers tell us anything, it’s that Americans are angry. Angry with what they perceive to be government ineptitude, angry with the economy, angry with US foreign policy, angry with just about everything. The palpable sense of rage has manifested itself in support for dark horse presidential candidates like Donald Trump and Bernie Sanders and is also apparent in “incidents” like that which occurred on Saturday when armed militiamen seized a remote government building in Oregon. Just how mad are Americans? Very, according to a new poll conducted by Esquire, SurveyMonkey, and NBC News. Here’s the preface from Esquire:
Below, find some of the highlights which include the fact that when it comes to being "pissed", no one is angrier than white people and Republicans. "Overall, 49 percent of Americans said they find themselves feeling angrier now about current events than they were one year ago," NBC writes. "Whites are the angriest, with 54 percent saying they have grown more outraged over the past year [while] sixty-one percent of Republicans say current events irk them more today than a year ago, compared to 42 percent of Democrats."
|
|||
| - - SECURITY-SURVEILLANCE COMPLEX - STATISM | G | THEME | |
| - - CATALYSTS - FEAR (POLITICALLY) & GREED (FINANCIALLY) | G | THEME | |
II-ECONOMIC |
|||
| GLOBAL RISK | |||
| - GLOBAL FINANCIAL IMBALANCE - FRAGILITY, COMPLEXITY & INSTABILITY | G | THEME | |
| - - SOCIAL UNREST - INEQUALITY & A BROKEN SOCIAL CONTRACT | US | THEME | |
| - - ECHO BOOM - PERIPHERAL PROBLEM | M | THEME | |
| - -GLOBAL GROWTH & JOBS CRISIS | |||
| - - - PRODUCTIVITY PARADOX - NATURE OF WORK | THEME | MA w/ CHS |
|
| 01-08-16 | THEME | MA w/ CHS |
|
“The American Dream May Be DyingBut It Can Be Revived!” GORDON T LONG & CHARLES HUGH SMITH - Discuss CHS' new book
DECLINING LABOR PERTICIPATION RATE - Status quo has no solution!
New tech creates far fewer jobs than it replaces/destroys Today's Tech Giants Are Creating Loads Of Wealth But Pitifully Few Jobs PUBLIC NARRATIVE
"A Solution to Automation—Universal Basic Income for all"
Charles Hugh Smith says:
Gordon T Long says:
.....not just survive on the dole. UNIVERSAL BASIC INCOME => THE DOLE
We need new ways of understanding our systemic problems and new solutions. Going back to 1930 and super-welfare schemes are not real solutions.
CHS' solution is to build a community-based economy that provides funding, mentoring and ample opportunities to build capital and wealth. What we need (and what CHS book is about)
Blog essay does the heavy lifting on the financial analysis— but its really the social-economic differences between:
SUBSISTENCE SERFDOM
THE KEYNESIAN IDEOLOGY
New crypto-currencies offer a way to escape the financial repression of central bank-issued money, which flows to banks and financiers, not the real economy. |
|||
| - - - STANDARD OF LIVING - EMPLOYMENT CRISIS, SUB-PRIME ECONOMY | US | THEME | MA w/ CHS |
III-FINANCIAL |
|||
|
FLOWS - Liqudity, Credit & Debt
|
MATA RISK ON-OFF |
THEME |
w/ R Duncan |
| CRACKUP BOOM - ASSET BUBBLE | 12-31-15 | THEME | |
| SHADOW BANKING - LIQUIDITY / CREDIT ENGINE | M | THEME | |
| GENERAL INTEREST |
|
||
| STRATEGIC INVESTMENT INSIGHTS - Weekend Coverage | |||
 |
|||
|
SII | ||
|
SII | ||
|
SII | ||
|
SII | ||
FACTOIDS:
Globally, signs of the glut are everywhere, and growing.
As a result, OPEC revenue is down some $500 billion a year, and counting. 3 key reasons oil’s caught in a death spiral:
Oil prices are likely to remain under pressure until there are signs that either:
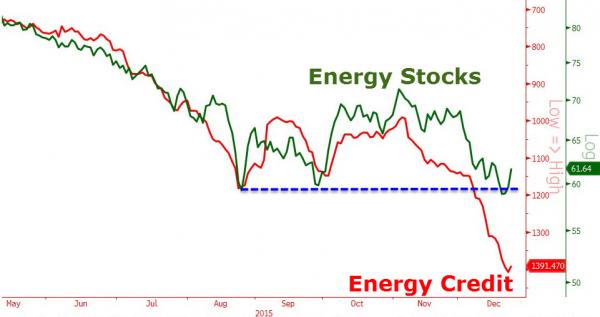
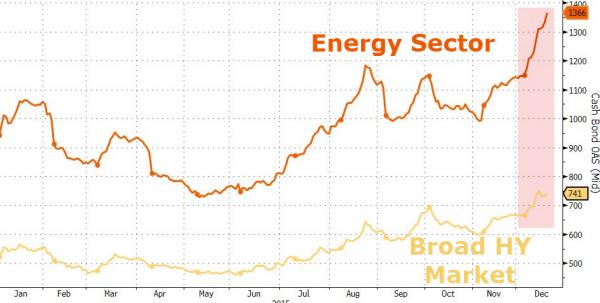
..... and Energy spreads spike to recod highs...
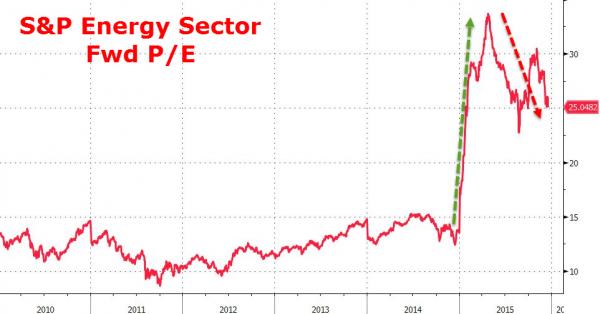
As Energy Fwd P/Es begin to fall back to reality...
WATCH LIST - Shorts:
|
12-26-15 | SII | |
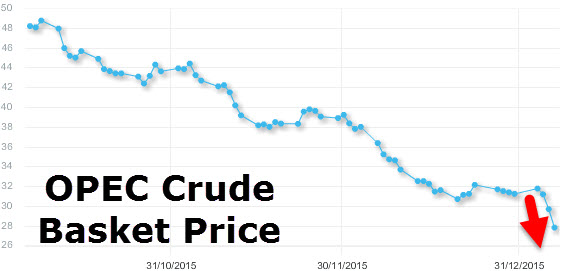
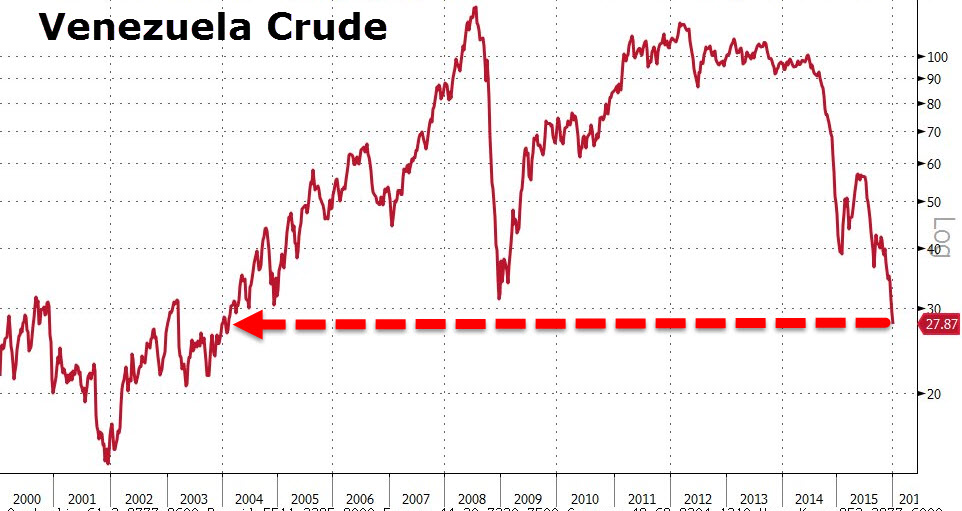
OPEC - after its crude basket price dropped below $30 for the first time in 12 years - slashed its price overnight by $2 to $27.85 - the biggest single-day drop in history and lowest level since November 2003...
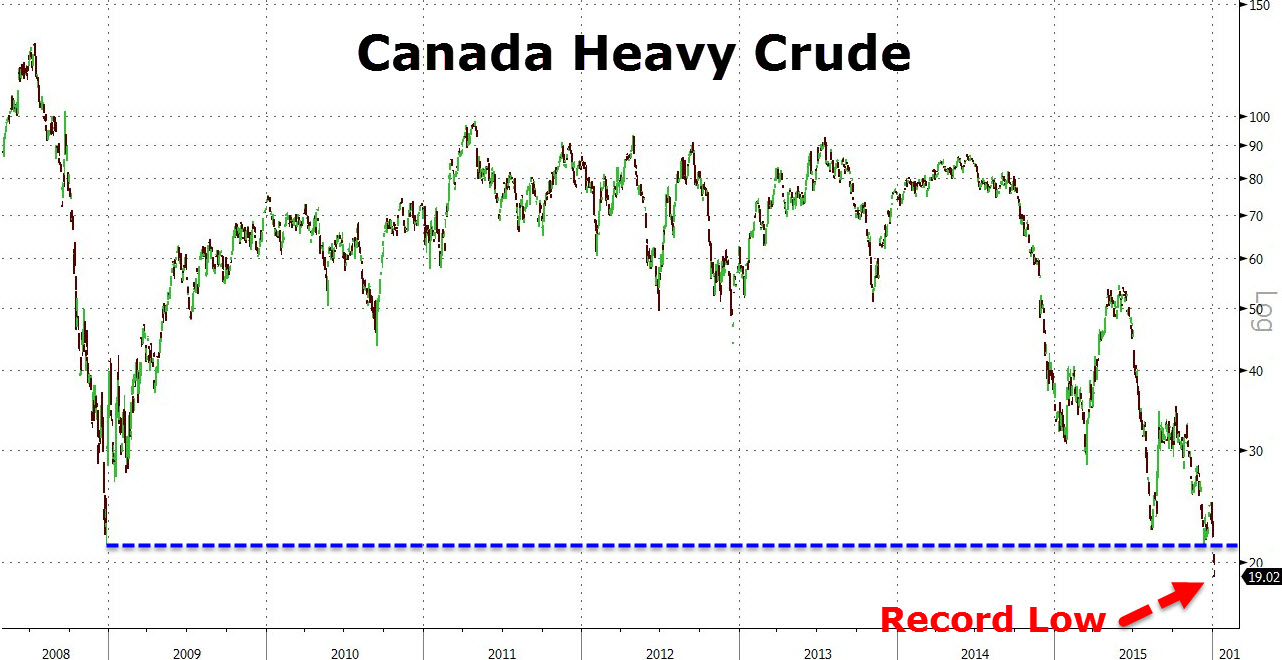
CANADIAN heavy crude oil collapse below $20 - a record low!!
VENEZUELA lowers its crude below crucial $30 level - Feb 2004 lows...
.... but apart from that, the bottom must be close right? |
|||
2016: Oil Limits & The End Of The Debt SupercycleSubmitted by Gail Tverberg via Our Finite World blog, What is ahead for 2016? Most people don’t realize how tightly the following are linked:
It looks to me as though this linkage is about to cause a very substantial disruption to the economy, as oil limits, as well as other energy limits, cause a rapid shift from the benevolent version of the economic supercycle to the portion of the economic supercycle reflecting contraction. Many people have talked about
... without realizing that the underlying problem is really the same–the fact the we are reaching the limits of a finite world. There are actually a number of different kinds of limits to a finite world, all leading toward the rising cost of commodity production. I will discuss these in more detail later. In the past, the contraction phase of the supercycle seems to have been caused primarily by too high population relative to resources. This time, depleting fossil fuels–particularly oil–plays a major role. Other limits contributing to the end of the current debt supercycle include rising pollution and depletion of resources other than fossil fuels. The problem of reaching limits in a finite world manifests itself in an unexpected way: slowing wage growth for non-elite workers. Lower wages mean that these workers become less able to afford the output of the system. These problems first lead to commodity oversupply and very low commodity prices. Eventually these problems lead to falling asset prices and widespread debt defaults. These problems are the opposite of what many expect, namely oil shortages and high prices. This strange situation exists because the economy is a networked system. Feedback loops in a networked system don’t necessarily work in the way people expect.I expect that the particular problem we are likely to reach in 2016 is limits to oil storage. This may happen at different times for crude oil and the various types of refined products. As storage fills, prices can be expected to drop to a very low level–less than $10 per barrel for crude oil, and correspondingly low prices for the various types of oil products, such as gasoline, diesel, and asphalt. We can then expect to face a problem with debt defaults, failing banks, and failing governments (especially of oil exporters). The idea of a bounce back to new higher oil prices seems exceedingly unlikely, in part because of the huge overhang of supply in storage, which owners will want to sell, keeping supply high for a long time. Furthermore, the underlying cause of the problem is the failure of wages of non-elite workers to rise rapidly enough to keep up with the rising cost of commodity production, particularly oil production. Because of falling inflation-adjusted wages, non-elite workers are becoming increasingly unable to afford the output of the economic system. As non-elite workers cut back on their purchases of goods, the economy tends to contract rather than expand. Efficiencies of scale are lost, and debt becomes increasingly difficult to repay with interest. The whole system tends to collapse. How the Economic Growth Supercycle Works, in an Ideal Situation In an ideal situation, growth in debt tends to stimulate the economy. The availability of debt makes the purchase of high-priced goods such as factories, homes, cars, and trucks more affordable. All of these high-priced goods require the use of commodities, including energy products and metals. Thus, growing debt tends to add to the demand for commodities, and helps keep their prices higher than the cost of production, making it profitable to produce these commodities. The availability of profits encourages the extraction of an ever-greater quantity of energy supplies and other commodities. The growing quantity of energy supplies made possible by this profitability can be used to leverage human labor to an ever-greater extent, so that workers become increasingly productive. For example, energy supplies help build roads, trucks, and machines used in factories, making workers more productive. As a result, wages tend to rise, reflecting the greater productivity of workers in the context of these new investments. Businesses find that demand for their goods and services grows because of the growing wages of workers, and governments find that they can collect increasing tax revenue. The arrangement of repaying debt with interest tends to work well in this situation. GDP grows sufficiently rapidly that the ratio of debt to GDP stays relatively flat. Over time, the cost of commodity production tends to rise for several reasons:
As long as the cost of commodity production is rising only slowly, its increasing cost is benevolent. This increase in cost adds to inflation in the price of goods and helps inflate away prior debt, so that debt is easier to pay. It also leads to asset inflation, making the use of debt seem to be a worthwhile approach to finance future economic growth, including the growth of energy supplies. The whole system seems to work as an economic growth pump, with the rising wages of non-elite workers pushing the growth pump along. The Big “Oops” Comes when the Price of Commodities Starts Rising Faster than Wages of Non-Elite Workers Clearly the wages of non-elite workers need to be rising faster than commodity prices in order to push the economic growth pump along. The economic pump effect is lost when the wages of non-elite workers start falling, relative to the price of commodities. This tends to happen when the cost of commodity production begins rising rapidly, as it did for oil after 1999 (Figure 1). The loss of the economic pump effect occurs because the rising cost of oil (or electricity, or food, or other energy products) forces workers to cut back on discretionary expenditures. This is what happened in the 2003 to 2008 period as oil prices spiked and other energy prices rose sharply. (See my article Oil Supply Limits and the Continuing Financial Crisis.) Non-elite workers found it increasingly difficult to afford expensive products such as homes, cars, and washing machines. Housing prices dropped. Debt growth slowed, leading to a sharp drop in oil prices and other commodity prices. 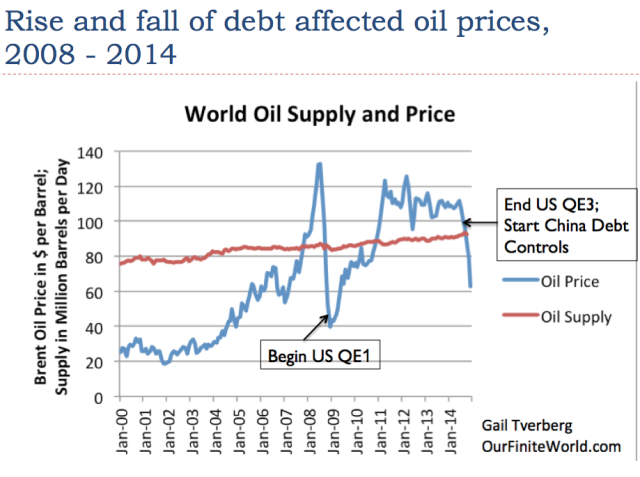 Figure 2. World oil supply and prices based on EIA data. It was somewhat possible to “fix” low oil prices through the use of Quantitative Easing (QE) and the growth of debt at very low interest rates, after 2008. In fact, these very low interest rates are what encouraged the very rapid growth in the production of US crude oil, natural gas liquids, and biofuels. Now, debt is reaching limits. Both the US and China have (in a sense) “taken their foot off the economic debt accelerator.” It doesn’t seem to make sense to encourage more use of debt, because recent very low interest rates have encouraged unwise investments. In China, more factories and homes have been built than the market can absorb. In the US, oil “liquids” production rose faster than it could be absorbed by the world market when prices were over $100 per barrel. This led to the big price drop. If it were possible to produce the additional oil for a very low price, say $20 per barrel, the world economy could probably absorb it. Such a low selling price doesn’t really “work” because of the high cost of production. Debt is important because it can help an economy grow, as long as the total amount of debt does not become unmanageable. Thus, for a time, growing debt can offset the adverse impact of the rising cost of energy products. We know that oil prices began to rise sharply in the 1970s, and in fact other energy prices rose as well. 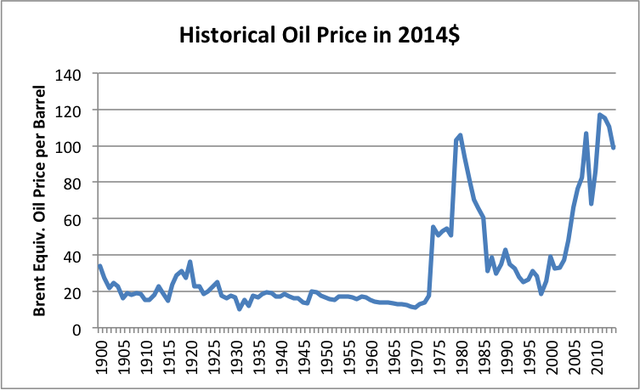 Figure 3. Historical World Energy Price in 2014$, from BP Statistical Review of World History 2015. Looking at debt growth, we find that it rose rapidly, starting about the time oil prices started spiking. Former Director of the Office of Management and Budget, David Stockman, talks about “The Distastrous 40-Year Debt Supercycle,” which he believes is now ending. 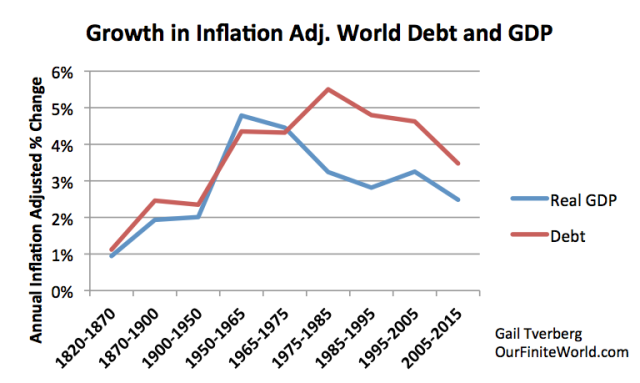 Figure 4. Worldwide average inflation-adjusted annual growth rates in debt and GDP, for selected time periods. See post on debt for explanation of methodology. In recent years, we have been reaching a situation where commodity prices have been rising faster than the wages of non-elite workers. Jobs that are available tend to be low-paid service jobs. Young people find it necessary to stay in school longer. They also find it necessary to delay marriage and postpone buying a car and home. All of these issues contribute to the falling wages of non-elite workers. Some of these individuals are, in fact, getting zero wages, because they are in school longer. Individuals who retire or voluntarily leave the work force further add to the problem of wages no longer rising sufficiently to afford the output of the system. The US government has recently decided to raise interest rates. This further reduces the buying power of non-elite workers. We have a situation where the “economic growth pump,” created through the use of a rising quantity of cheap energy products plus rising debt, is disappearing. While homes, cars, and vacation travel are available, an increasing share of the population cannot afford them. This tends to lead to a situation where commodity prices fall below the cost of production for a wide range of types of commodities, making the production of commodities unprofitable. In such a situation, a person expects companies to cut back on production. Many defaults may occur. China has acted as a major growth pump for the world for the last 15 years, since it joined the World Trade Organization in 2001. China’s growth is now slowing, and can be expected to slow further. Its growth was financed by a huge increase in debt. Paying back this debt is likely to be a problem. 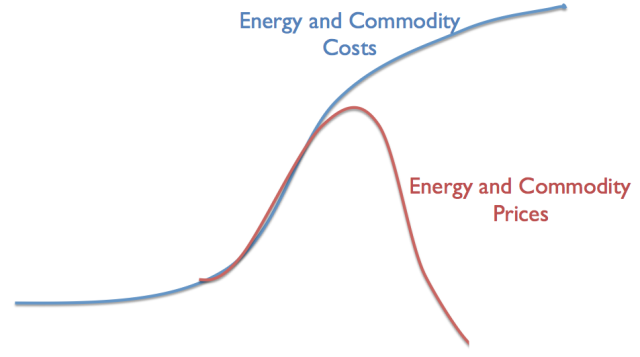 Figure 5. Author’s illustration of problem we are now encountering. Thus, we seem to be coming to the contraction portion of the debt supercycle. This is frightening, because if debt is contracting, asset prices (such as stock prices and the price of land) are likely to fall. Banks are likely to fail, unless they can transfer their problems to others–owners of the bank or even those with bank deposits. Governments will be affected as well, because it will become more expensive to borrow money, and because it becomes more difficult to obtain revenue through taxation. Many governments may fail as well for that reason. The U. S. Oil Storage Problem Oil prices began falling in the middle of 2014, so we might expect oil storage problems to start about that time, but this is not exactly the case. Supplies of US crude oil in storage didn’t start rising until about the end of 2014. 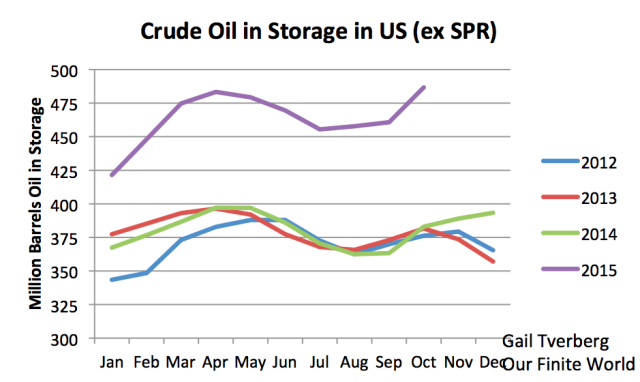 Figure 6. US crude oil in storage, excluding Strategic Petroleum Reserve, based on EIA data. Once crude oil supplies started rising rapidly, they increased by about 90 million barrels between December 2014 and April 2015. After April 2015, supplies dipped again, suggesting that there is some seasonality to the growing crude oil supply. The most “dangerous” time for rapidly rising amounts added to storage would seem to be between December 31 and April 30. According to the EIA, maximum crude oil storage is 551 million barrels of crude oil (considering all storage facilities). Adding another 90 million barrels of oil (similar to the run-up between Dec. 2014 and April 2015) would put the total over the 551 million barrel crude oil capacity. Cushing, Oklahoma, is the largest storage area for crude oil. According to the EIA, maximum working storage for the facility is 73 million barrels. Oil storage at Cushing since oil prices started declining is shown in Figure 7. 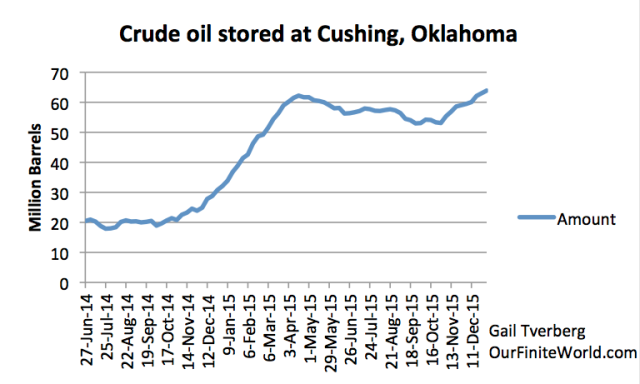 Figure 7. Quantity of crude oil stored at Cushing between June 27, 2014, and June 1, 2016, based on EIA data. Clearly the same kind of run up in oil storage that occurred between December and April one year ago cannot all be stored at Cushing, if maximum working capacity is only 73 million barrels, and the amount currently in storage is 64 million barrels. Another way of storing oil is as finished products. Here, the run-up in storage began earlier (starting in mid-2014) and stabilized at about 65 million barrels per day above the prior year, by January 2015. Clearly, if companies can do some pre-planning, they would prefer not to refine products for which there is little market. They would rather store unneeded oil as crude, rather than as refined products. 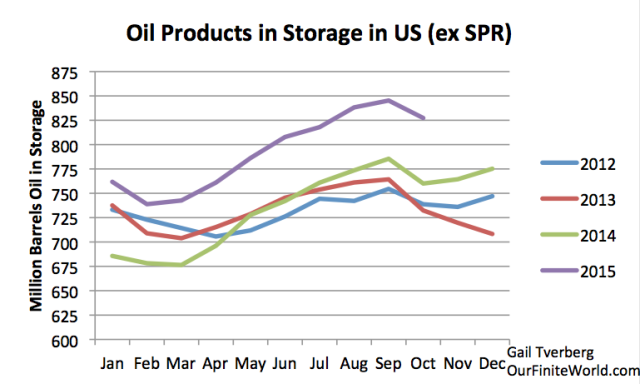 Figure 8. Total Oil Products in Storage, based on EIA data. EIA indicates that the total capacity for oil products is 1,549 million barrels. Thus, in theory, the amount of oil products stored can be increased by as much as 700 million barrels, assuming that the products needing to be stored and the locations where storage are available match up exactly. In practice, the amount of additional storage available is probably quite a bit less than 700 million barrels because of mismatch problems. In theory, if companies can be persuaded to refine more products than they can sell, the amount of products that can be stored can rise significantly. Even in this case, the amount of storage is not unlimited. Even if the full 700 million barrels of storage for crude oil products is available, this corresponds to less than one million barrels a day for two years, or two million barrels a day for one year. Thus, products storage could easily be filled as well, if demand remains low. At this point, we don’t have the mismatch between oil production and consumption fixed. In fact, both Iraq and Iran would like to increase their production, adding to the production/consumption mismatch. China’s economy seems to be stalling, keeping its oil consumption from rising as quickly as in the past, and further adding to the supply/demand mismatch problem. Figure 9 shows an approximation to our mismatch problem. As far as I can tell, the problem is still getting worse, not better. 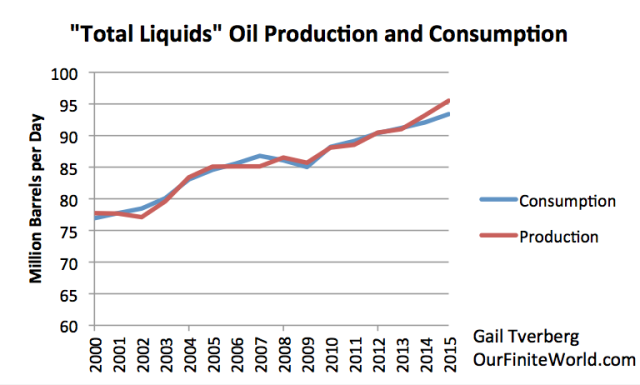 Figure 9. Total liquids oil production and consumption, based on a combination of BP and EIA data. There has been a lot of talk about the United States reducing its production, but the impact so far has been small, based on data from EIA’s International Energy Statistics and its December 2015 Monthly Energy Review. 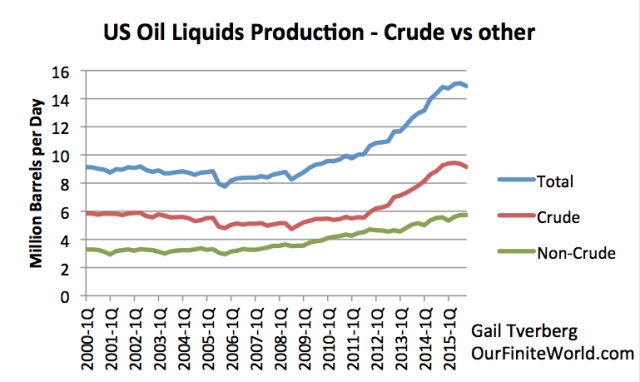 Figure 10. US quarterly oil liquids production data, based on EIA’s International Energy Statistics and Monthly Energy Review. Based on information through November from EIA’s Monthly Energy Review, total liquids production for the US for the year 2015 will be over 800,000 barrels per day higher than it was for 2014. This increase is likely greater than the increase in production by either Saudi Arabia or Iraq. Perhaps in 2016, oil production of the US will start decreasing, but so far, increases in biofuels and natural gas liquids are partly offsetting recent reductions in crude oil production. Also, even when companies are forced into bankruptcy, oil production does not necessarily stop because of the potential value of the oil to new owners. Figure 11 shows that very high stocks of oil were a problem, way back in the 1920s. There were other similarities to today’s problems as well, including a deflating debt bubble and low commodity prices. Thus, we should not be too surprised by high oil stocks now, when oil prices are low. 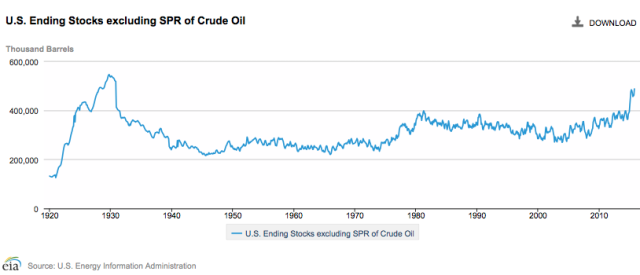 Figure 11. US ending stock of crude oil, excluding the strategic petroleum reserve. Figure by EIA. Many people overlook the problems today because the US economy tends to be doing better than that of the rest of the world. The oil storage problem is really a world problem, however, reflecting a combination of low demand growth (caused by low wage growth and lack of debt growth, as the world economy hits limits) continuing supply growth (related to very low interest rates making all kinds of investment appear profitable and new production from Iraq and, in the near future, Iran). Storage on ships is increasingly being filled up and storage in Western Europe is 97% filled. Thus, the US is quite likely to see a growing need for oil storage in the year ahead, partly because there are few other places to put the oil, and partly because the gap between supply and demand has not yet been fixed. What is Ahead for 2016?
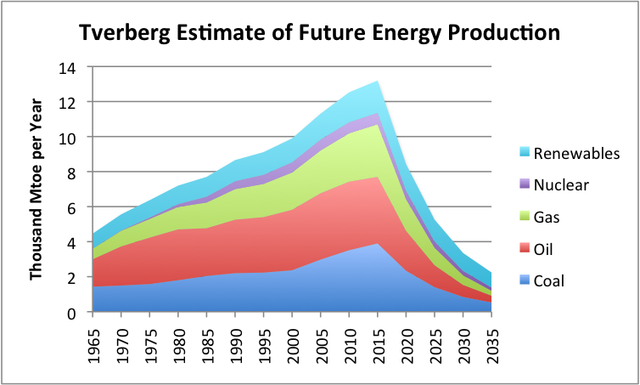 Figure 12. Estimate of future energy production by author. Historical data based on BP adjusted to IEA groupings. Conclusion We are certainly entering a worrying period. We have not really understood how the economy works, so we have tended to assume we could fix one or another part of the problem. The underlying problem seems to be a problem of physics. The economy is a dissipative structure, a type of self-organizing system that forms in thermodynamically open systems. As such, it requires energy to grow. Ultimately, diminishing returns with respect to human labor–what some of us would call falling inflation-adjusted wages of non-elite workers–tends to bring economies down. Thus all economies have finite lifetimes, just as humans, animals, plants, and hurricanes do. We are in the unfortunate position of observing the end of our economy’s lifetime. Most energy research to date has focused on the Second Law of Thermodynamics. While this is a contributing problem, this is really not the proximate cause of the impending collapse. The Second Law of Thermodynamics operates in thermodynamically closed systems, which is not precisely the issue here. We know that historically collapses have tended to take many years. This collapse may take place more rapidly because today’s economy is dependent on international supply chains, electricity, and liquid fuels–things that previous economies were not dependent on. |
|||
| TO TOP | |||


 A staggering


Read More - OUR RESEARCH - Articles Below

Tipping Points Life Cycle - Explained
Click on image to enlarge
TO TOP
 |
YOUR SOURCE FOR THE LATEST THINKING & RESEARCH
|
�
TO TOP