|
JOHN RUBINO'SLATEST BOOK |
||||||||||||||||||||||||||||||||||||||||||||||||||||||||||||||||||||||||||||||||||||||||||||||||||||||||||||||||||||||||||||||||||||||||||||||||||||||||||||||||||||||||||||||||||||||||||||||||||||||||||||||||||||||||||||||||||||||||||||||||||||||||||||||||||||||||||||||||||||||||||||||||||||||||
"MELT-UP MONITOR " Meltup Monitor: FLOWS - The Currency Cartel Carry Cycle - 09 Dec 2013 Meltup Monitor: FLOWS - Liquidity, Credit & Debt - 04 Dec 2013 Meltup Monitor: Euro Pressure Going Critical - 28- Nov 2013 Meltup Monitor: A Regression-to-the-Exponential Mean Required - 25 Nov 2013
|
"DOW 20,000 " Lance Roberts Charles Hugh Smith John Rubino Bert Dohman & Ty Andros
|
HELD OVER
Currency Wars
Euro Experiment
Sultans of Swap
Extend & Pretend
Preserve & Protect
Innovation
Showings Below
"Currency Wars "
|
"SULTANS OF SWAP" archives open ACT II ACT III ALSO Sultans of Swap: Fearing the Gearing! Sultans of Swap: BP Potentially More Devistating than Lehman! |
"EURO EXPERIMENT"
archives open EURO EXPERIMENT : ECB's LTRO Won't Stop Collateral Contagion!
EURO EXPERIMENT: |
"INNOVATION"
archives open |
"PRESERVE & PROTE CT"
archives open |

Weekend May 3rd, 2014
Follow Our Updates
on TWITTER
https://twitter.com/GordonTLong
AND FOR EVEN MORE TWITTER COVERAGE
STRATEGIC MACRO INVESTMENT INSIGHTS
 2014 THESIS: GLOBALIZATION TRAP
NOW AVAILABLE FREE to Trial Subscribers
185 Pages
What Are Tipping Poinits?
Understanding Abstraction & Synthesis
Global-Macro in Images: Understanding the Conclusions
| APRIL | ||||||
| S | M | T | W | T | F | S |
| 1 | 2 | 3 | 4 | 5 | ||
| 6 | 7 | 8 | 9 | 10 | 11 | 12 |
| 13 | 14 | 15 | 16 | 17 | 18 | 19 |
| 20 | 21 | 22 | 23 | 24 | 25 | 26 |
| 27 | 28 | 29 | 30 | 1 | 2 | 3 |
KEY TO TIPPING POINTS |
| 1 - Risk Reversal |
| 2 - Japan Debt Deflation Spiral |
| 3- Bond Bubble |
| 4- EU Banking Crisis |
| 5- Sovereign Debt Crisis |
| 6 - China Hard Landing |
| 7 - Chronic Unemployment |
| 8 - Geo-Political Event |
| 9 - Global Governance Failure |
| 10 - Chronic Global Fiscal ImBalances |
| 11 - Shrinking Revenue Growth Rate |
| 12 - Iran Nuclear Threat |
| 13 - Growing Social Unrest |
| 14 - US Banking Crisis II |
| 15 - Residential Real Estate - Phase II |
| 16 - Commercial Real Estate |
| 17 - Credit Contraction II |
| 18- State & Local Government |
| 19 - US Stock Market Valuations |
| 20 - Slowing Retail & Consumer Sales |
| 21 - China - Japan Regional Conflict |
| 22 - Public Sentiment & Confidence |
| 23 - US Reserve Currency |
| 24 - Central & Eastern Europe |
| 25 - Oil Price Pressures |
| 26 - Rising Inflation Pressures & Interest Pressures |
| 27 - Food Price Pressures |
| 28 - Global Output Gap |
| 29 - Corruption |
| 30 - Pension - Entitlement Crisis |
| 31 - Corporate Bankruptcies |
| 32- Finance & Insurance Balance Sheet Write-Offs |
| 33 - Resource Shortage |
| 34 - US Reserve Currency |
| 35- Government Backstop Insurance |
| 36 - US Dollar Weakness |
| 37 - Cyber Attack or Complexity Failure |
| 38 - Terrorist Event |
| 39 - Financial Crisis Programs Expiration |
| 40 - Natural Physical Disaster |
| 41 - Pandemic / Epidemic |
Reading the right books?
No Time?
We have analyzed & included
these in our latest research papers Macro videos!
![]()
OUR MACRO ANALYTIC
CO-HOSTS
John Rubino's Just Released Book
Charles Hugh Smith's Latest Books
Our Macro Watch Partner
Richard Duncan Latest Books
MACRO ANALYTIC
GUESTS
F William Engdahl
OTHERS OF NOTE
Book Review- Five Thumbs Up
for Steve Greenhut's
Plunder!
|
Scroll TWEETS for LATEST Analysis
Read More - OUR RESEARCH - Articles Below
HOTTEST TIPPING POINTS |
Theme Groupings |
||||||||||||||||||||||||||||||||||||||||||
|
|||||||||||||||||||||||||||||||||||||||||||
We post throughout the day as we do our Investment Research for: LONGWave - UnderTheLens - Macro |
|||||||||||||||||||||||||||||||||||||||||||
"BEST OF THE WEEK " |
Posting Date |
Labels & Tags | TIPPING POINT or THEME / THESIS or INVESTMENT INSIGHT |
||||||||||||||||||||||||||||||||||||||||
|
|||||||||||||||||||||||||||||||||||||||||||
US GROWTH - Q1 2014 GDP In their first estimate of the US GDP for the first quarter of 2014, the Bureau of Economic Analysis (BEA) reported that the economy was growing at an anemic 0.11% annualized rate. When compared to prior quarters, the new measurement is down over 2.5% from the 2.64% growth rate reported for the 4th quarter of 2013, and it is now more than 4% lower than the 4.19% reported for the 3rd quarter of 2013 -- indicating that the deceleration in the growth rate first noticed last quarter has both continued and sharply intensified. The Numbers As a quick reminder, the classic definition of the GDP can be summarized with the following equation: or, as it is commonly expressed in algebraic shorthand: In the new report the values for that equation (total dollars, percentage of the total GDP, and contribution to the final percentage growth number) are as follows: GDP Components Table
Quarterly Changes in % Contributions to GDP
Summary and Commentary |
05-03-14 | INDICATORS GROWTH |
US ECONOMICS |
||||||||||||||||||||||||||||||||||||||||
| MOST CRITICAL TIPPING POINT ARTICLES THIS WEEK - April 27th, 2014 - May 3rd, 2014 | |||||||||||||||||||||||||||||||||||||||||||
| JAPAN - DEBT DEFLATION | 2 | ||||||||||||||||||||||||||||||||||||||||||
JAPAN - Stalled Inflation Adds Pressure for Second Round of Stimulus Japan’s Stalled Inflation Adds Pressure for Second Round of Stimulus
A year after the Bank of Japan launched its strategy for re-inflating the country’s economy, stalled price increases raise expectations of a second round of easing. Core inflation excluding food prices came in at 1.3 percent year on year in March, unchanged for a fourth month. Data showed inflation in Tokyo at 2.7 percent in April, up from 1 percent in March. That reflects the consumption tax increase rather than a shift in price pressure. In a speech heralding the launch of quantitative and qualitative easing last year, Governor Haruhiko Kuroda said the BO J’s asset purchases would spur growth and inflation through three channels.
Still, the pass-through to stronger demand has been mixed. For companies, lower real interest rates and higher profits are stoking stronger investment spending. Machine orders were contracting when the B o J announced its stimulus. Now they are growing at double-digit rates. The impact for consumers is harder to see because wage growth has failed to keep up with rising prices. With real wag- es falling since o ctober 2013, households may be reluctant to hit the shops. Pressure for rising prices is set to fade in the months ahead. Import prices, which were up 17.8 percent year on year at the end of 2013, rose just 4.4 percent in March. That reflects the end of the yen’s period of rapid depreciation. The question on a second round of easing is not ‘if’ it will occur but ‘when.’ The B o J’s o utlook Report, slated for publication April 30, will provide clues to the answer |
04-29-14 | JAPAN | 2 - Japan Debt Deflation Spiral | ||||||||||||||||||||||||||||||||||||||||
| BOND BUBBLE | 3 | ||||||||||||||||||||||||||||||||||||||||||
EU BANKING CRISIS |
4 |
||||||||||||||||||||||||||||||||||||||||||
| SOVEREIGN DEBT CRISIS [Euope Crisis Tracker] | 5 | ||||||||||||||||||||||||||||||||||||||||||
| CHINA BUBBLE | 6 | ||||||||||||||||||||||||||||||||||||||||||
CHINA - Is China is Exporting Deflation Worldwide by Driving Down Yuan? Suspicion grows that China is exporting deflation worldwide by driving down yuan 04-24-14 Anbrose Evans-Pritchard
The Chinese Yuan weakened yet again this morning, punching through the key line of 6.25 against the dollar. It is almost back to where it was two years ago. This is the biggest story in the global currency markets. Yuan devaluation has reached 3.1pc this year. The longer this goes on, the harder it is to accept Beijing’s story that it is one-off measure to teach speculators a lesson and curb hot money inflows.
The US Treasury clearly suspects that the Chinese authorities have reverted to their mercantilist tricks, driving down the exchange rate to keep struggling exporters afloat. Officials briefed journalists in Washington two weeks ago in very belligerent language. The Treasury’s currency report this month accused China of trying to “impede” the market by boosting foreign reserves by $510bn last year to $3.8 trillion – “excessive by any measure”. It gave a strong hint that China is disguising its reserve accumulation. You don’t have to dig hard. Simon Derrick from BNY Mellon said a recent buying spree of US Treasuries and agency debt by Belgium of all places looks like a Chinese front. Holdings by entities in Belgium have jumped to $341bn from $169bn last August. This would appear to explain how China’s FX reserves have kept rising to $3.95 trillion even as its custody holdings in the US itself have been falling. If so, China is playing dirty pool. Hans Redeker from Morgan Stanley says China seems to have adopted a “beggar thy neighbour policy” to
Albert Edwards from Societe Generale said in a note today that China is “sliding inexorably towards deflation”. Factory gate prices have been falling for 25 months in a row. The GDP deflator – which proved a much better gauge of trouble at the onset of Japan’s Lost Decade than consumer prices – has plummeted from 1.4pc to 0.4 over the last year.
This means that China’s nominal GDP growth has dropped to just 7.4pc and is nearing the levels of the post-Lehman trough. This is the indicator that matters for the solvency of China’s heavily-indebted companies. Mr Edwards said the next shoe to drop in world the economy (leaving aside the Donbass) is a systematic attempt by China to export its deflation to any other sucker willing to accept it by driving down the yuan. Those countries that have failed to build adequate defences by keeping inflation safely above 1pc could face a nasty shock when this happens. The eurozone looks like the sucker of last resort. A Chinese deflationary tide would push Southern Europe over the edge. Perhaps that is why the ECB’s Mario Draghi sounded ever more alarmed today in his efforts to talk down the euro today. I take no view on how far China intends to go with this. It may reverse course any time. I merely pass on SocGen’s view for readers to think about. Nor have I made up my mind whether the yuan is correctly valued. Diana Choyleva from Lombard Street Research says it is 15pc to 25pc overvalued as a result of
The IMF and US say it is still undervalued.
The true picture has been masked by unsustainable levels of investment. Quite so. China invested $5 trillion last year, as much as the US and the EU combined. It is no mystery why the world is drifting ever closer towards deflation. That one figure tells you most of what you need to know. The dollar/yuan exchange rate tells you the rest. |
04-28-14 | CHINA | 6 - China Hard Landing | ||||||||||||||||||||||||||||||||||||||||
CHINA - Someone Is Betting That The Chinese Currency Collapses By The End Of 2014 Someone Is Betting That The Chinese Currency Collapses By The End Of 2014? 04-26-14 Zero Hedge Last week, USDCNY began to accelerate lower and break across the "real pain" threshold that we have been discussing for many of the world's so-called "hedgers" who have been riding the one-way strengthening trend of the CNY for years and piled in with leveraged trades on what had been a one-way bet. The collapse this week, to levels not seen since pre-BoJ QQE and pre-Fed QE3 appeared to trigger an avalanche of unwinds or hedges of the exposures we have been worrying about. As the chart below shows, billions of dollars of upside calls on USDCNY were purchased on Friday with serious size out to 6.65 strikes (levels not seen since 2009) by the end of 2014. The losses are mounting, as we explained in great detail here... Simply put, if the CNY keeps going (whether by PBOC hand or a break of the virtuous cycle above), then things get ugly fast... How Much Is at Stake?
And clearly the hedging of those losses is underway en masse... (the size of the circles is the notinal being hedged - we have highlighted a few for context) as it is clear, hedgers are concerned that CNY would weaken to 6.65 or beyond by the end of the year The escalation of the unwind in recent days suggests the vicious circle is beginning. Finally, putting aside speculative trader P&L losses, many of which are said to be of Japanese origin and thus will hardly enjoy much or any PBOC sympathies, here is CLSA's Russel Napier on what the long-tern fate of the Renminbi will be:
|
04-28-14 | CHINA | 6 - China Hard Landing | ||||||||||||||||||||||||||||||||||||||||
CHINA - Problems in the Target Redemption Forwards Derivatives market & Dim-Sum Bonds Yuan Continues Slide, and It Hasn't Hit Bottom 04-25-14 WSJ The tumble in China's yuan is showing no signs of letting up, with the currency falling near daily for three straight months as the economy slows, fueling fears that the slide has further to go. The yuan has dropped 3.4% against the dollar since the end of January to a 16-month low, more than double the previous three-month decline seen two years ago, when investors retreated from risky markets amid the depths of the European debt crisis. In the offshore market, where the currency is freely traded, the yuan is falling at an even faster pace.
"A depreciating renminbi is symptomatic of a faster slowing economy and it can depreciate further," RBS currency strategists said in a research note, forecasting the yuan to drop a possible 2.3% from here. The unexpected fall is triggering even bulls like HSBC, the biggest foreign bank in China, to reduce their expectations for yuan gains. On Friday they predicted the yuan would trade at 6.14 a dollar at the end of the year, compared with an old estimate of 5.98. A high number means a weaker yuan, with the currency at 6.2536 Friday. On Friday, the yuan dropped as much as 1.6% from the so-called parity rate, a daily peg for trading of the yuan against the U.S. dollar set by the central bank, the widest gap ever. The decline also threatens to worsen tensions with trading partners like the U.S. who are pushing China to allow the currency to appreciate further, even after a more than 30% climb since 2005. Much of the fears of global money managers on China are focused around the country's
Investors yanked $275 million from China equity funds this week, the biggest outflow in Asia according to data from ANZ and EPFR Global. While the currency fall is a boon for exporters, it also brings financial risks. This week the yuan in the onshore and offshore markets breached 6.25 a dollar, a significant psychological level where analysts estimate billions in dollars of highly leveraged derivative products known as "target redemption forwards" could turn sour as the yuan unexpectedly falls. Geoff Kendrick, head of Asian foreign-exchange and rates strategy at Morgan Stanley, estimated that mark-to-market losses on these structured products now amount to around $4 billion. "Corporates buying [target redemption-forward products] are losing money. But almost no one is unwinding. They believe [yuan will rebound] again, increasing chances that they will make it back later on," Mr. Kendrick said. Other casualties of the currency's fall include funds investing in so-called dim-sum bonds, or yuan-denominated bonds issued outside China, which were top performers among Asian peers last year because of the currency's then resilience. This year they've reversed course and fallen an average 1.7% so far this year, according to Morningstar. "There's near-term pressure on the yuan, but the dim sum bond market isn't too panicked by and large, because China's fundamentals—trade surplus and higher interest rates—still support its currency. And investors remain calm and stable," said Pheona Tsang, head of fixed income at BEA Union Investment Management Ltd. in Hong Kong, with $6 billion in assets under management. Its yuan bond fund recorded a 0.5% loss in the last two months, according to Morningstar. Analysts and economists expect the yuan to continue sliding, with ING and CIBC forecasting it to touch 6.3 per dollar, which will be its weakest since September 2012 and will mark a close-to-4% tumble in the currency this year, which would be unprecedented. "We're now looking at the scenario [that the] yuan is no longer a one-way appreciation bet," said ING Asia economist Tim Condon. "With the band widening, the authorities aimed at adding more two-way risks in the currency's trading and they are very serious about that." |
|||||||||||||||||||||||||||||||||||||||||||
CHINA -Absence Of A Letter Of Credit! The Scarlet Absence Of A Letter Of Credit 04-26-14 Mark St.Cyr via ZH If there’s one thing we all know about banks and bankers: they love to tell tales in public of how much they value their customers. However, what you’ll never hear them profess in private: is how much they trust them. Although one may think that’s unseemly, believe it or not there is another entity banks hold at an even lower tier. Other banks. One of the known facts people remember about the melt down in 2008 (as opposed to general public) was when the banks no longer trusted each other, and what they earlier claimed was “collateral” wasn’t actually worth what it was stated to be. Credit default spreads (CDS) were supposedly the insurance to negate valuation concerns. But when the banks felt CDS weren’t worth the paper they were written on, not only did they operate in a fashion reminiscent of cutting their noses off to spite their faces, but rather they began cutting visible ties (and/or appendages) to other banks. The blinding issue with all that took place during that period is the speed in which it all took place. Once it seemed one bank (regardless of size) was not going to be able to make good on a promise of clearing, near overnight the banks regarded any and all collateral at a discount. This fed on itself to where even once valued pristine collateral such as hard materials let alone paper began to be not only discounted, but prices slashed at such discounts that would make a blue light special at K-Mart™ blush. So when I read the following article on Zero Hedge™: How China’s Commodity-Financing Bubble Becomes Globally Contagious. My blood ran cold. The implications of this development and the consequences it portends just might make it the proverbial “canary in a coal mine.” The underlying issue that makes this far more dangerous or different from times past is three-fold.
A vicious cycle begins something akin to this… (Yes this example is an oversimplification, but the implications are not.) The commodity producer is leveraged up and is either fully, or has over expanded needing to produce X at a rate consistent with structures and costs. The banks (markets, etc.) base their loans for operating expenses on sales, and value of on hand inventory. All rudimentary stuff. If the collateral backing the loans for operating expenses are mostly the refined product itself, and that product is a commodity, then both the product along with its value are at the mercy of a perishable overhang. e.g., The product can spoil, or the price can plummet via oversupply, etc. But the one thing it can’t do that’s possibly worse: is sit on a producers site, books, or more, indefinitely. The only way to turn that product into useable cash is to sell it. And here is where things get a little tricky. For what a sale “is” as to open or allow funds to be allocated to the producer for operating expenses, can sometimes have more in common with that other famous distinction of what exactly, “is” – is. If you’re a company and producing X where LOC’s are the requisite detail of paperwork that can not be overlooked or forgone, and is standard operating procedure for the industry, and you deviate from these expected practices: it sends signals that not only something may be wrong, but quite possibly something far worse. i.e., An act of desperation. Imagine yourself as if you owned the commodity and it were beginning to either pile up in excess inventory. Or, you had tentative sales yet, they were unable to come to fruition for lack of a LOC. What would you do? Well, if you hold onto the product and let it sit it begins to lose value via market forces. Second, your lender values you product as collateral less and less via those same market forces squeezing you even more. So do you sit idle and let the chips fall where they may? Or, do you send it off in hopes of getting paid? If you send it off it’s entirely plausible on your own books it will still remain as a “sale” and it keeps the demand narrative intact, reduces inventory, and helps in keeping production quotas all in check – for the time being. Keeping the spigots of operating revenues flowing. (Hopefully giving breathing room so fallacy can turn back into reality) However, at issue is also the recipient of the product, For either A: They didn’t want or need it. Or B: (which is far worse) Need it, but can’t pay for it. If that customer is honorable, they might just receive the product as an early shipment, store it, and state never do it again or they’ll drop you. Yet, they’ll penalize you by paying for it only when they actually would have ordered it to begin with. Regardless of when that date may fall. That’s the most wishful (and probably unicorn/rainbow treatment) of an outcome one could hope for. Yet things usually don’t happen that way do they? Let’s use the guise that’s turned a blind eye by the so-called “smart crowd” across the financial media, and look at the recipient of that product as someone being squeezed by their centralized government in an effort to dampen a real estate bubble. Couple this with the tenacity as to not give into outside pressures as to “inject liquidity” at others promptings. If the product is received by someone desperate of needing cash, than the first thing they’ll do with that product is whatever it takes to turn it into just that. And just like a drug sick shoplifter will sell any highly valuable stolen product for 50 cents on the dollar, so to will a credit induced financial addict with the overwhelming overhang of needing to supply a “credit fix” to their portfolio. As devastating as the above scenario can play out there’s another just as plausible and actually more probable. This is where the ruthless play. And these players make banker on banker squabbles look like a kinder-garden recess. To them: You shipped it without a LOC? Shame on you. Let’s start the bidding of you possibly ever see payment at a 50% discount today. If you don’t answer by the close of business today, it goes down even more. Think they’re not serious or want to call their bluff? No problem, they begin by informing you that you can easily reload it onto your boat if you want. But, just to let you know, it’s no longer stored where it was off loaded. It’s now at X, or Y, or Z, or had been sold immediately on arrival. Oh and by the way, they were just informed the people they sold it to, don’t seem to have any money now either. Credit crunch is taking its toll your informed. (what a coincidental shame, who’da thunk it?) Oh and by the way, it seems they’ve just instituted a new 90 day (or longer) advanced scheduling process, along with other “added expenses” that will need to be paid before you can get your product back. They’d love to put you at the front of the line however, you’re notified there’s a lot of corruption taking place on the docks and even they can’t jump in line without paying. By the looks of it, the farther one tries to work this out, it seems it just might cost you more to get it back than it was to ship it. Huh, funny how that happens. Well call back later they’ll say, and see what progress can be made as to rectify this for you. Click. If you think things like this don’t happen, I have some ocean front property in Kentucky I would love to sell you. Now take into account where the back half of the storm shows its presence throughout the commodity complex itself. (all hypothetical of course) Suddenly the market becomes aware that company X is dumping your commodity onto the open market for say a 20% discount. That in turn spurs other producers or holders to begin offering their own discounts. As they do, the bastardized market (because without a LOC they’re in essence dumping) they begin dumping even more – for less. That in turn pushes market forces in a downward spiral, which in turn reduces the value of everyone’s inventory leading into a black hole of who can discount faster. Which in turn begins in alerting “the lenders” to begin questioning any and all “sales” on clients books, and what they truly represents. Only to then find those “sales” were nothing but wishes and hopes. For without a LOC, what are they? One doesn’t have to look all that far back in time to see just how fast the impact of any cuts, or implosion of credit lines by the banks can decimated businesses. Yes the 2008 crisis showed when they no longer trusted each other. However, “The Savings and Loan Crisis” of the 1980′s should remind every one of just how fast this can take place along with its consequences for Main Street. Anyone that ran a credit line based business during that period remembers all too well the many businesses that were shuttered were not for a lack of business, but by the head spinning quickness LOC’s or lines of credit for operations were both changed as well as cancelled. This one could do the same but have far more reaching implications. Over the last few years since the financial melt down of 2008, we have seen what many have believed are precursors that may tip the hand of markets as to show just how unhealthy this levitating act fueled by free money has become. And yes there are always false indicators, and we all know correlation doesn’t equal causation. And even more may shrug and think, “No letter of credit, so what.” However, if there were ever a canary in a coalmine worth noting this is one not to let one’s eyes to divert from. The issue at hand is not just the foolishness of the absence contained in a one off LOC gamble some company would take. Far from it. It’s the desperation that could be hidden that’s a precursor one has to watch for. For the amount of desperation, or the degree that might be hidden beneath the surface to which a commodity will be sent overseas to another country, a country for all intents and purposes is using that very product as a pseudo currency to back other financial obligations without the requisite document to be paid; is mind numbingly dangerous in its implications in my view
|
04-28-14 | CHINA | 6 - China Hard Landing | ||||||||||||||||||||||||||||||||||||||||
CHINA - China Cracksdown on Commodity Credit Iron Ore Prices Tumble As China Crackdown Begins 04-28-14 Zero Hedge After the initial crash in many of the commodities backing China's shadow-banking system's ponzi, levels recovered modestly as rumors were spread of bailouts, stimulus, and in fact the exact opposite of what the Chinese government had declared it was trying to do. That ended for Iron Ore this weekend when, as The FT reports, China announced plans to get tougher on loans for iron ore imports as concerns grow that steel mills are using import loans to stay afloat in defiance of policies to reduce overcapacity in heavily polluting and lossmaking industries. Iron Ore prices tumbled overnight, closing near the lowest levels since Sept 2012 as it appears the PBOC and CBRC are serious and set to implement the tougher rules on May 1st. As The FT reports, The China Banking Regulatory Commission warned banks to tighten controls over letters of credit for iron ore imports in a document that caused iron ore futures in China to drop 5 per cent on Monday. Rumours of the stricter measures, which are expected after the May 1 holiday, have been circulating in China for at least two months, after a hasty stock sale caused ore prices to tumble in late February.
But it's clear, the mills are unable to stop for fear of what the consequences are...
And therefore...
The major problem, of course, is any restriction or tightening is necessarily lowering the price of the iron ore... thus reducing the value of collateral and thus worsening credit conditions in a vicious circle as firms can borrow less and less actual Yuan against their inventory at a time when cash flows are becoming increasingly negative from demand collapse
|
04-29-14 | CHINA | 6 - China Hard Landing | ||||||||||||||||||||||||||||||||||||||||
CHINA - Falling Yuan Chinese Currency Collapses To 18-Month Lows; Nears PBOC Limits 04-30-14 Zero Hedge After widening its tolerance for real world volatility mid-March, the PBOC has faced a daily battering of USD buyers and CNY sellers which have driven the Chinese currency to its weakest level in over 18 months. However, things are starting to become problematic... while call buying and hedging is exploding - as carry traders and local specs rush to cover exposures, Bloomberg notes that Morgan Stanley fears as the yuan approaches the lower end of PBOC’s permissible daily trading range, anticipated intervention to defend band could put other currencies under selling pressure. The last time - Summer 2012 - that the PBOC defended its currency, EUR came under selling pressure but as Morgan Stanley notes, “In the very unlikely case” of PBOC not defending band, FX volatility would surge globally with implications going beyond RMB as markets would assume China’s economic problems might be significant... whocouldanode? The Yuan is now trading 1.8% below (above on the chart) its fixing and near the 2% band limit the PBOC expanded to in March... Bloomberg reports that as yuan approaches lower end of PBOC’s permissible daily trading range, anticipated intervention to defend band could put currencies under selling pressure, helping USD, Morgan Stanley says in note.
What could given them that idea!!??
|
05-01-14 | CHINA | 6 - China Hard Landing | ||||||||||||||||||||||||||||||||||||||||
| TO TOP | |||||||||||||||||||||||||||||||||||||||||||
| MACRO News Items of Importance - This Week | |||||||||||||||||||||||||||||||||||||||||||
GLOBAL MACRO REPORTS & ANALYSIS |
|||||||||||||||||||||||||||||||||||||||||||
US ECONOMIC REPORTS & ANALYSIS |
|||||||||||||||||||||||||||||||||||||||||||
US ECONOMY - The Proof of the Death of the American Middle Class 17 Facts To Show To Anyone That Still Believes That The U.S. Economy Is Just Fine 04-30-14 Michael Snyder of The Economic Collapse blog, via ZH Things are definitely not getting better, and there are a whole host of signs that this bubble of false stability will soon come to an end and that our economic decline will accelerate once again. #1 The homeownership rate in the United States has dropped to the lowest level in 19 years. #2 Consumer spending for durable goods has dropped by 3.23 percent since November. This is a clear sign that an economic slowdown is ahead. #3 Major retailers are closing stores at the fastest pace that we have seen since the collapse of Lehman Brothers. #4 According to the Bureau of Labor Statistics, 20 percent of all families in the United States do not have a single member that is employed. That means that one out of every five families in the entire country is completely unemployed. #5 There are 1.3 million fewer jobs in the U.S. economy than when the last recession began in December 2007. Meanwhile, our population has continued to grow steadily since that time. #6 According to a new report from the National Employment Law Project, the quality of the jobs that have been "created" since the end of the last recession does not match the quality of the jobs lost during the last recession...
#7 After adjusting for inflation, men who work full-time in America today make less money than men who worked full-time in America 40 years ago. #8 It is hard to believe, but 62 percent of all Americans make $20 or less an hour at this point. #9 Nine of the top ten occupations in the U.S. pay an average wage of less than $35,000 a year. #10 The middle class in Canada now makes more money than the middle class in the United States does. #11 According to one recent study, 40 percent of all Americans could not come up with $2000 right now even if there was a major emergency. #12 Less than one out of every four Americans has enough money put away to cover six months of expenses if there was a job loss or major emergency. #13 An astounding 56 percent of all Americans have subprime credit in 2014. #14 There are now 49 million Americans that are dealing with food insecurity. #15 Ten years ago, the number of women in the U.S. that had jobs outnumbered the number of women in the U.S. on food stamps by more than a 2 to 1 margin. But now the number of women in the U.S. on food stamps actually exceeds the number of women that have jobs. #16 69 percent of the federal budget is spent either on entitlements or on welfare programs. #17 The number of Americans receiving benefits from the federal government each month exceeds the number of full-time workers in the private sector by more than 60 million. Taken individually, those numbers are quite remarkable. Taken collectively, they are absolutely breathtaking. In the real economy, the middle class is being squeezed out of existence. The quality of our jobs is declining and prices just keep rising. This reality was reflected quite well in a comment that one of my readers left on one of my recent articles...
And the false stock bubble that the wealthy are enjoying right now will not last that much longer. It is an artificial bubble that has been pumped up by unprecedented money printing by the Federal Reserve, and like all bubbles that the Fed creates, it will eventually burst. None of the long-term trends that are systematically destroying our economy have been addressed, and none of our major economic problems have been fixed. In fact, as I showed in this recent article, we are actually in far worse shape than we were just prior to the last major financial crisis. |
05-01-14 | US ECONOMICS |
|||||||||||||||||||||||||||||||||||||||||
| CENTRAL BANKING MONETARY POLICIES, ACTIONS & ACTIVITIES | |||||||||||||||||||||||||||||||||||||||||||
| Market | |||||||||||||||||||||||||||||||||||||||||||
| TECHNICALS & MARKET |
|
||||||||||||||||||||||||||||||||||||||||||
ENTERPRISE VALUE - Falling EBITDA and Free Cash - Buybacks and Dividents Bleeding Cash |
|||||||||||||||||||||||||||||||||||||||||||
PATTERNS - Nasdaq Leading the Way Towards June Market "Death Cross" As expected the higher risk stocks are leading the way (Read: Risk is Leaving the Market)
MOMENTUM LEAVING THE MARKETS
CREDIT MARKETS ARE WARNING
|
04-29-14 | PATTERNS | |||||||||||||||||||||||||||||||||||||||||
| COMMODITY CORNER - HARD ASSETS | PORTFOLIO | ||||||||||||||||||||||||||||||||||||||||||
| COMMODITY CORNER - AGRI-COMPLEX | PORTFOLIO | ||||||||||||||||||||||||||||||||||||||||||
| SECURITY-SURVEILANCE COMPLEX | PORTFOLIO | ||||||||||||||||||||||||||||||||||||||||||
| THESIS | |||||||||||||||||||||||||||||||||||||||||||
| 2014 - GLOBALIZATION TRAP | 2014 |  |
|||||||||||||||||||||||||||||||||||||||||
|
2013 2014 |
|||||||||||||||||||||||||||||||||||||||||||
|
"There is no freedom without noise - and no stability without volatility." FINANCIAL REPRESSION - EU Developments
EU: Financial Repression
|
04-30-14 | THESIS | |||||||||||||||||||||||||||||||||||||||||
2011 2012 2013 2014 |
|||||||||||||||||||||||||||||||||||||||||||
| THEMES | |||||||||||||||||||||||||||||||||||||||||||
| FLOWS -FRIDAY FLOWS | THEME | ||||||||||||||||||||||||||||||||||||||||||
|
FLOWS: Liquidity, Credit & Debt
For anyone who is interested in understanding my views on the global economic crisis, this is the video I would recommend watching, if I could only recommend one. In it, I am able to address almost all of the ideas I have tried to convey through my books and speeches over the past ten years. The pace is relaxed and the production quality is very good. It was filmed in a beautiful suite in the Trump Tower in Chicago. The interview was organized, produced and conducted by Tim Verduin. Tim is the CEO of The Resilience Group, an insurance and financial services agency located in Crown Point, Indiana. I thought he asked all the right questions. 1 Hour & 2 Minutes Video �
|
|||||||||||||||||||||||||||||||||||||||||||
| SHADOW BANKING -LIQUIDITY / CREDIT ENGINE | THEME | ||||||||||||||||||||||||||||||||||||||||||
| CRACKUP BOOM - ASSET BUBBLE | THEME | ||||||||||||||||||||||||||||||||||||||||||
| ECHO BOOM - PERIPHERAL PROBLEM | THEME | ||||||||||||||||||||||||||||||||||||||||||
| PRODUCTIVITY PARADOX -NATURE OF WORK | THEME | ||||||||||||||||||||||||||||||||||||||||||
| STANDARD OF LIVING -EMPLOYMENT CRISIS | THEME | ||||||||||||||||||||||||||||||||||||||||||
| CORPORATOCRACY -CRONY CAPITALSIM | THEME |  |
|||||||||||||||||||||||||||||||||||||||||
CORRUPTION & MALFEASANCE -MORAL DECAY - DESPERATION, SHORTAGES. |
THEME |  |
|||||||||||||||||||||||||||||||||||||||||
| SOCIAL UNREST -INEQUALITY & A BROKEN SOCIAL CONTRACT | THEME | ||||||||||||||||||||||||||||||||||||||||||
| SECURITY-SURVEILLANCE COMPLEX -STATISM | THEME | ||||||||||||||||||||||||||||||||||||||||||
| GLOBAL FINANCIAL IMBALANCE - FRAGILITY, COMPLEXITY & INSTABILITY | THEME | ||||||||||||||||||||||||||||||||||||||||||
| CENTRAL PLANINNG -SHIFTING ECONOMIC POWER | THEME | ||||||||||||||||||||||||||||||||||||||||||
| CATALYSTS -FEAR & GREED | THEME | ||||||||||||||||||||||||||||||||||||||||||
| GENERAL INTEREST |
|
||||||||||||||||||||||||||||||||||||||||||
| TO TOP | |||||||||||||||||||||||||||||||||||||||||||
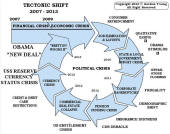
Tipping Points Life Cycle - Explained
Click on image to enlarge
TO TOP
�
TO TOP














 be taken to weaken the Euro.


