|
JOHN RUBINO'SLATEST BOOK |
||||||||||||||||||||||||||||||||||||||||||||||||||||||||||||||||||||||||||||||||||||||||||||||||||||||||||||||||||||||||||||||||||||||||||||||||||||||||||||||||||||||||||||||||||||||||||||||||||||||||||||||||||||||||||||||||||||||||||||||||||||||||||||||||||||||||||
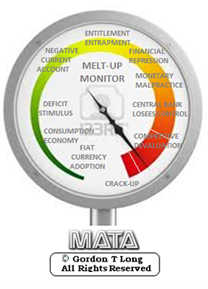
"MELT-UP MONITOR " Meltup Monitor: FLOWS - The Currency Cartel Carry Cycle - 09 Dec 2013 Meltup Monitor: FLOWS - Liquidity, Credit & Debt - 04 Dec 2013 Meltup Monitor: Euro Pressure Going Critical - 28- Nov 2013 Meltup Monitor: A Regression-to-the-Exponential Mean Required - 25 Nov 2013
|
"DOW 20,000 " Lance Roberts Charles Hugh Smith John Rubino Bert Dohman & Ty Andros
|
HELD OVER
Currency Wars
Euro Experiment
Sultans of Swap
Extend & Pretend
Preserve & Protect
Innovation
Showings Below
"Currency Wars "
|
"SULTANS OF SWAP" archives open ACT II ACT III ALSO Sultans of Swap: Fearing the Gearing! Sultans of Swap: BP Potentially More Devistating than Lehman! |
"EURO EXPERIMENT"
archives open EURO EXPERIMENT : ECB's LTRO Won't Stop Collateral Contagion!
EURO EXPERIMENT: |
"INNOVATION"
archives open |
"PRESERVE & PROTE CT"
archives open |

Weekend. Apr. 4th, 2015
Follow Our Updates
on TWITTER
https://twitter.com/GordonTLong
AND FOR EVEN MORE TWITTER COVERAGE
STRATEGIC INVESTMENT INSIGHTS
 2015 THESIS: FIDUCIARY FAILURE
NOW AVAILABLE FREE to Trial Subscribers
174 Pages
What Are Tipping Poinits?
Understanding Abstraction & Synthesis
Global-Macro in Images: Understanding the Conclusions
![]()
| MARCH | ||||||
| S | M | T | W | T | F | S |
| 1 | 2 | 3 | 4 | 5 | 6 | 7 |
| 8 | 9 | 10 | 11 | 12 | 13 | 14 |
| 15 | 16 | 17 | 18 | 19 | 20 | 21 |
| 22 | 23 | 24 | 25 | 26 | 27 | 28 |
| 29 | 30 | 31 | 1 | 2 | 3 | 4 |
KEY TO TIPPING POINTS |
| 1- Bond Bubble |
| 2 - Risk Reversal |
| 3 - Geo-Political Event |
| 4 - China Hard Landing |
| 5 - Japan Debt Deflation Spiral |
| 6- EU Banking Crisis |
| 7- Sovereign Debt Crisis |
| 8 - Shrinking Revenue Growth Rate |
| 9 - Chronic Unemployment |
| 10 - US Stock Market Valuations |
| 11 - Global Governance Failure |
| 12 - Chronic Global Fiscal ImBalances |
| 13 - Growing Social Unrest |
| 14 - Residential Real Estate - Phase II |
| 15 - Commercial Real Estate |
| 16 - Credit Contraction II |
| 17- State & Local Government |
| 18 - Slowing Retail & Consumer Sales |
| 19 - US Reserve Currency |
| 20 - US Dollar Weakness |
| 21 - Financial Crisis Programs Expiration |
| 22 - US Banking Crisis II |
| 23 - China - Japan Regional Conflict |
| 24 - Corruption |
| 25 - Public Sentiment & Confidence |
| 26 - Food Price Pressures |
| 27 - Global Output Gap |
| 28 - Pension - Entitlement Crisis |
| 29 - Central & Eastern Europe |
| 30 - Terrorist Event |
| 31 - Pandemic / Epidemic |
| 32 - Rising Inflation Pressures & Interest Pressures |
| 33 - Resource Shortage |
| 34 - Cyber Attack or Complexity Failure |
| 35 - Corporate Bankruptcies |
| 36 - Iran Nuclear Threat |
| 37- Finance & Insurance Balance Sheet Write-Offs |
| 38- Government Backstop Insurance |
| 39 - Oil Price Pressures |
| 40 - Natural Physical Disaster |
Reading the right books?
No Time?
We have analyzed & included
these in our latest research papers Macro videos!
![]()
OUR MACRO ANALYTIC
CO-HOSTS
John Rubino's Just Released Book
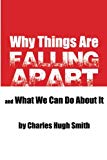
Charles Hugh Smith's Latest Books
Our Macro Watch Partner
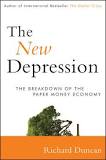
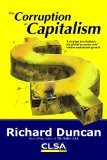
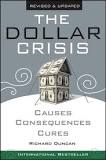
Richard Duncan Latest Books
MACRO ANALYTIC
GUESTS
F William Engdahl
OTHERS OF NOTE
Book Review- Five Thumbs Up
for Steve Greenhut's
Plunder!
TODAY'S TIPPING POINTS
|
![]() Scroll TWEETS for LATEST Analysis
Scroll TWEETS for LATEST Analysis ![]()
HOTTEST TIPPING POINTS |
Theme Groupings |
|||||
We post throughout the day as we do our Investment Research for: LONGWave - UnderTheLens - Macro |
||||||
|
|
Posting Date |
Labels & Tags | TIPPING POINT or THEME / THESIS or INVESTMENT INSIGHT |
|||
|
MOST CRITICAL TIPPING POINT ARTICLES TODAY
|
|
|||||
|
04-04-15 | |||||
OIL PRICES - Stanford Says Subdued for Next 20 Years Between $50-$60/bl Nick Cunningham via OilPrice.com, Oil prices will remain subdued for the next 20 years. That comes from a new policy brief from Stanford economist Frank Wolak, who says that a series of phenomena: Will combine to prevent oil prices from rising above $100 per barrel anytime soon.
Wolak correctly identifies several trends that are already underway, several of which contributed to the 2014-2015 oil bust. But there are very good reasons as to why the notion that oil prices will not rebound and instead stay in a moderate band of $50 to $60 per barrel over the next 20 years, as Wolak suggests, is a bit optimistic (or pessimistic, depending on your point of view). Wolak does offer some caveats for why his scenario for tepid oil prices may not play out, but they are treated more as outside risks rather than real possibilities. Let’s examine some of his points. Shale production has truly upended global supplies First is the argument that shale production has truly upended global supplies. Citing a 5 million barrel-per-day increase from North America – 4 million from U.S. shale and 1 million from Canada’s tar sands – Wolak wisely notes the role that shale has played in causing oil prices to crash over the past year. But the shale boom will likely be temporary. Most estimates project that U.S. shale will begin to fizzle after the next five years or so. The IEA in its 2014 World Energy Outlook said that U.S. shale will peak and then decline in the early 2020’s. Some think it could happen even sooner. After U.S. shale stops driving global growth, what are we left with? The IEA says that an overwhelming amount of oil growth will need to come from the Middle East, particularly from Iraq. Iraq, a war-torn country rife with insecurity and political gridlock, is expected to account for 50 percent of the growth in oil production that is needed in the 2020s. “We now have a problem,” IEA Chief Economist Fatih Birol said at a February conference, referring to the world’s likely inability to meet rising demand over the next 20 years. Moreover, an estimated $900 billion in investment each year will be needed to meet demand through 2030, an astronomic sum considering investment only reached a little under $700 billion in 2014, and is set to decline by around 17 percent in 2015. Massive cut backs in capital expenditures over the next few years will plant the seeds for the next oil price spike. The shale revolution will spread Another major reason that Wolak cites for why oil prices will remain stable and moderate is the fact that the shale revolution will spread like wildfire around the world. That is possible. Countries like China, Russia, and Argentina have massive shale oil and gas resources that in some cases even surpass those of the United States. But the spread of shale technology has proven stubborn, owing to a very complex set of circumstances. In Europe, the excitement in Poland in particular has proven to be ill-founded. After failing to find any commercial volumes of oil and gas and drilling some dry holes, oil majors Chevron and ExxonMobil, among others, packed up and left. Opposition to fracking has also walled off major sources of energy in Europe. In China, the going has been no better. The lack of infrastructure, complex geology, and increasingly scarce and contaminated water are all throwing up major roadblocks. Argentina is trying its best to replicate the shale boom, but a web of rules on the movement of capital, plus regulated prices that hurt investment over the long-term (but in the current low-price environment, are currently helping Argentina) could constrain further development. On the other hand, Wolak does cite the fact that increasing global efforts to deal with carbon pollution, the falling cost of alternatives, standardization and innovation, and weaker-than-expected demand could all keep a lid on prices. Those are all very possible scenarios. But there is also a wide array of upside forces that Wolak leaves out. Just to name a few:
In other words, Wolak’s scenario largely depends on several optimistic trends all coming true. If we have learned anything over the past year, it is that oil markets are highly volatile. A long and sustained period of moderate oil prices just isn’t likely. |
04-04-15 | |||||
| MOST CRITICAL TIPPING POINT ARTICLES THIS WEEK - Mar. 29th, 2015 - Apr. 4th, 2015 | ||||||
| RISK REVERSAL - WOULD BE MARKED BY: Slowing Momentum, Weakening Earnings, Falling Estimates | 1 | |||||
| CHINA BUBBLE | 2 | |||||
| JAPAN - DEBT DEFLATION | 3 | |||||
| BOND BUBBLE | 4 | |||||
EU BANKING CRISIS |
5 |
|||||
| SOVEREIGN DEBT CRISIS [Euope Crisis Tracker] | 6 | |||||
GEO-ECONOMICS - Echo Boom JP Morgan Has A "Problem" With Emerging Markets 03-30-15 Zero Hedge Over the weekend, we highlighted a new study by the Center for Global Development which identified the emerging markets that are most vulnerable to an “external shock” whether in the form of a Fed “liftoff” or a geopolitical shakeup such as a wholesale Russian invasion of Ukraine. With EM multiples, spreads, and currencies trading at a discount to their DM peers, some investors may be tempted to look for a relative value play in the face of increasingly overbought DM equities and fixed income. Despite what look to be "cheap" valuations, JPM calls the EM contrarian approach “tactically challenging” thanks to leverage, a difficult environment for economic growth and Janet Yellen:
EM growth has decelerated markedly…
...while both the public and private sectors have taken on more debt…
...and the market fears the first casualty of a rate hike cycle may well be EMs...
* * * As a reminder, here's the breakdown of who's most at risk, and who's improved their position since the eve of the crisis:
|
03-31-15 | THEMES ECHO BOOM | 12 - Chronic Global Fiscal ImBalances | |||
GEO-ECONOMICS - Echo Boom Here's Which Emerging Markets Are Most Vulnerable To "External Shock" 03-29-15 Zero Hedge With a no longer “patient” Fed set for “liftoff” sometime this year, some observers (including IMF chief Christine Lagarde) are bracing for emerging market turbulence. A new paper from the Center for Global Development attempts to discern which EMs are most vulnerable to an “external shock” (be it geopolitical or financial) and also seeks to determine which countries are more prepared to weather a storm now than they were pre-crisis. According to the study, the relevant factors are
From the study:
And here’s The Economist, simplifying things a bit further:
|
04-02-15 | THEMES ECHO BOOM |
12 - Chronic Global Fiscal ImBalances | |||
| TO TOP | ||||||
| MACRO News Items of Importance - This Week | ||||||
GLOBAL MACRO REPORTS & ANALYSIS |
||||||
US ECONOMIC REPORTS & ANALYSIS |
||||||
| CENTRAL BANKING MONETARY POLICIES, ACTIONS & ACTIVITIES | ||||||
| Market | ||||||
| TECHNICALS & MARKET |
|
|||||
| STUDIES - MARKETS PREPARE FOR APRIL 15TH IRA CONTRIBUTIONS | ||||||
PATTERNS - Markets Set Up For April 15th Tax Contributions
OUR MACRO BIA$
WHAT THE ELLIOTT WAVE PRACTICIANERS SAY
WHAT THE CYCLE PRACTICIANERS SAY
WHAT THE FIBONACCI PRACTICIANERS SAY WHAT THE SENTIMENT PRACTICIANERS SAY .... get the message?
|
04-01-15 | STUDY | ||||
| COMMODITY CORNER - AGRI-COMPLEX | PORTFOLIO | |||||
| SECURITY-SURVEILANCE COMPLEX | PORTFOLIO | |||||
| THESIS - Mondays Posts on Financial Repression & Posts on Thursday as Key Updates Occur | ||||||
| 2015 - FIDUCIARY FAILURE | 2015 | THESIS 2015 |  |
|||
| 2014 - GLOBALIZATION TRAP | 2014 |  |
||||
|
2013 2014 |
||||||
FINANCIAL REPRESSION -Swiss Re 
FINANCIAL REPRESSION TAX TO SAVERS HAS BEEN ~$470B SINCE 2000
FINANCIAL REPRESSION IS ALSO AN "OPAQUE TAX" ON YOUR PENSION & INSURANCE POLICIES
|
03-30-15 | THESIS | ||||
2011 2012 2013 2014 |
||||||
| THEMES - Normally a Thursday Themes Post & a Friday Flows Post | ||||||
I - POLITICAL |
||||||
| CENTRAL PLANNING - SHIFTING ECONOMIC POWER - STATISM | G | THEME | ||||
| - - CORPORATOCRACY - CRONY CAPITALSIM | THEME |  |
||||
- - CORRUPTION & MALFEASANCE - MORAL DECAY - DESPERATION, SHORTAGES. |
THEME |  |
||||
| - - SECURITY-SURVEILLANCE COMPLEX - STATISM | M | THEME | ||||
| - - CATALYSTS - FEAR (POLITICALLY) & GREED (FINANCIALLY) | G | THEME | ||||
II-ECONOMIC |
||||||
| GLOBAL RISK | ||||||
| - GLOBAL FINANCIAL IMBALANCE - FRAGILITY, COMPLEXITY & INSTABILITY | G | THEME | ||||
| - - SOCIAL UNREST - INEQUALITY & A BROKEN SOCIAL CONTRACT | US | THEME | ||||
| - - ECHO BOOM - PERIPHERAL PROBLEM | M | THEME | ||||
| - -GLOBAL GROWTH & JOBS CRISIS | ||||||
| - - - PRODUCTIVITY PARADOX - NATURE OF WORK | THEME | MACRO w/ CHS |
||||
| - - - STANDARD OF LIVING - EMPLOYMENT CRISIS | US | THEME | MACRO w/ CHS |
|||
III-FINANCIAL |
||||||
| FLOWS -FRIDAY FLOWS | MATA RISK ON-OFF |
THEME | ||||
FLOWS - Liqudity, Credit & Debt Soft Patch 04-01-15 Richard Duncan The US economy will expand by only 0.2% during the first quarter of 2015 according to GDPNow, an economic model published by the Federal Reserve Bank of Atlanta. The GDPNow model is revised after the release of every significant economic data point. At the end of January, it indicated that the economy would grow by 2.4% during the first quarter. Since then, however, the incoming economic data has been so consistently weak that the model now suggests the economy will barely grow at all. In other words, the United States has entered a new economic “soft patch”. Job creation has been strong. In January 237,000 new jobs were created and, in February, 288,000 more. Almost all other incoming data has been disappointing. Average Hourly Earnings were only 1.5% higher in February 2015 vs. February 2014. Personal Spending fell by 0.2% in January and only managed to expand by 0.1% during February. Retail sales contracted by 0.8% in January and by a further 0.6% in February. Industrial production contracted by 0.3% in January and increased by only 0.1% in February. That sent Capacity Utilization down to 78.9% in February from 79.4% as it was initially reported for January. Durable Goods Orders rose 2% in January, but fell 1.4% in February; and fell during both months when excluding volatile transportation equipment. Housing starts plunged 17% in February vs. January, leaving starts 3% lower than one year earlier. Exports were down 3.9% and imports were down 1.4% in January (the most recent data available) compared with one year earlier. Moreover, all of this weak first quarter data came on top of data for the fourth quarter that was not much better. US GDP expanded by just 2.2% during the fourth quarter of 2014. The Q4 GDP Deflator was only 0.1%. Had this been at the Fed’s inflation target of 2%, there would have been next to no real growth whatsoever. There is no shortage of valid reasons that explain why the US economy is weakening again. The strong US dollar makes US produced goods less competitive in the global market. That accounts for the depressed industrial production. The collapse in oil prices has caused a falloff in new investment in the US energy sector. Globalization – and the relocation of factories to ultra low wage countries - continues to put downward pressure on US wages, deterring consumption. Credit growth in the United States remains too weak to drive economic growth as it did in the past. The most recent data available shows total credit (adjusted for inflation, which was only 1.2%) increased by just 2.4% during the fourth quarter, whereas 5% to 6% credit growth would be required to return to the economic growth rates experienced during the decades leading up to the crisis of 2008. Economic weakness in the United States has put an end to US import growth, resulting in near recession conditions globally. And, as always, when the United States buys less from the rest of the world, the rest of the world buys less from the US. This and the strong dollar explain the slump in US exports. And, last, but not least, QE 3 ended in October. Consequently, asset prices are no longer rising as quickly as before. During 2013, the Fed created $1 trillion through QE and the S&P 500 Index rose 30%. Last year, the Fed created $500 billion and the S&P rose 11%. This year, the Fed has not created any money through a QE program and the stock market is flat. The QE-induced Wealth Effect has been the main driver of US economic growth since this crisis began. Now that QE 3 has ended, much less “wealth” is being created and the economy is slowing again. The sharp economic slowdown, in combination with the strong US dollar, is negatively impacting US corporate earnings, which not only fell during the full year in 2014 (for the first time since 2008), but which are also expected to contract further during both the first and second quarters of 2015. Equity valuations are already considerably stretched. Falling profits significantly increase the risk of a sharp stock market selloff. Against such a weak economic backdrop, the Fed will find it very difficult to justify an interest rate hike this year. The currency markets have already priced in higher US interest rates. If the Fed fails to deliver, the dollar’s sharp appreciation during recent months may suddenly reverse. If economic conditions continue to deteriorate next quarter, speculation will begin to mount that QE 4 cannot be far away. That kind of reversal in expectations would cause violent upheavals across numerous asset classes. So, keep an eye on the Atlanta Fed’s GDPNow model. If it continues to weaken, we may be in for a considerable amount of volatility – and excitement – during the weeks ahead.
If you are a subscriber to my video-newsletter, Macro Watch, log in and learn how the ongoing crisis in the global economy will affect you. If not, join here: If you are a subscriber to my video-newsletter, Macro Watch, log in and learn how the crisis in the global economy will affect you. If not, join here: http://www.gordontlong.com/RichardDuncan/Macrowatch.htm For a 55% subscription discount, hit the “Click Here to Subscribe Now” tab and use the coupon code: flows
|
04-03-15 | THEMES FLOWS |
FLOWS |
|||
| CRACKUP BOOM - ASSET BUBBLE | THEME | |||||
| SHADOW BANKING - LIQUIDITY / CREDIT ENGINE | M | THEME | ||||
| GENERAL INTEREST |
|
|||||
| STRATEGIC INVESTMENT INSIGHTS - Weekend Coverage | ||||||
|
SII | |||||
|
SII | |||||
|
SII | |||||
|
SII | |||||
| TO TOP | ||||||
Read More - OUR RESEARCH - Articles Below
Tipping Points Life Cycle - Explained
Click on image to enlarge
TO TOP
�
TO TOP
