|
JOHN RUBINO'SLATEST BOOK |
||||||||||||||||||||||||||||||||||||||||||||||||||||||||||||||||||||||||||||||||||||||||||||||||||||||||||||||||||||||||||||||||||||||||||||||||||||||||||||||||||||||||||||||||||||||||||||||||||||||||||||||||||||||||||||||||||||||||||||||||||||||||||||||||||||||||||||||||||||||||||||||||||||||||||||||||||||||||||||||||
"MELT-UP MONITOR " Meltup Monitor: FLOWS - The Currency Cartel Carry Cycle - 09 Dec 2013 Meltup Monitor: FLOWS - Liquidity, Credit & Debt - 04 Dec 2013 Meltup Monitor: Euro Pressure Going Critical - 28- Nov 2013 Meltup Monitor: A Regression-to-the-Exponential Mean Required - 25 Nov 2013
|
"DOW 20,000 " Lance Roberts Charles Hugh Smith John Rubino Bert Dohman & Ty Andros
|
HELD OVER
Currency Wars
Euro Experiment
Sultans of Swap
Extend & Pretend
Preserve & Protect
Innovation
Showings Below
"Currency Wars "
|
"SULTANS OF SWAP" archives open ACT II ACT III ALSO Sultans of Swap: Fearing the Gearing! Sultans of Swap: BP Potentially More Devistating than Lehman! |
"EURO EXPERIMENT"
archives open EURO EXPERIMENT : ECB's LTRO Won't Stop Collateral Contagion!
EURO EXPERIMENT: |
"INNOVATION"
archives open |
"PRESERVE & PROTE CT"
archives open |

Thurs. Mar. 10th , 2016
Follow Our Updates
on TWITTER
https://twitter.com/GordonTLong
AND FOR EVEN MORE TWITTER COVERAGE
![]()
| MARCH | ||||||
| S | M | T | W | T | F | S |
| 1 | 2 | 3 | 4 | 5 | ||
| 6 | 7 | 8 | 9 | 10 | 11 | 12 |
| 13 | 14 | 15 | 16 | 17 | 18 | 19 |
| 20 | 21 | 22 | 23 | 24 | 25 | 26 |
| 27 | 28 | 29 | 30 | 31 | ||
KEY TO TIPPING POINTS |
| 1- Bond Bubble |
| 2 - Risk Reversal |
| 3 - Geo-Political Event |
| 4 - China Hard Landing |
| 5 - Japan Debt Deflation Spiral |
| 6- EU Banking Crisis |
| 7- Sovereign Debt Crisis |
| 8 - Shrinking Revenue Growth Rate |
| 9 - Chronic Unemployment |
| 10 - US Stock Market Valuations |
| 11 - Global Governance Failure |
| 12 - Chronic Global Fiscal ImBalances |
| 13 - Growing Social Unrest |
| 14 - Residential Real Estate - Phase II |
| 15 - Commercial Real Estate |
| 16 - Credit Contraction II |
| 17- State & Local Government |
| 18 - Slowing Retail & Consumer Sales |
| 19 - US Reserve Currency |
| 20 - US Dollar |
| 21 - Financial Crisis Programs Expiration |
| 22 - US Banking Crisis II |
| 23 - China - Japan Regional Conflict |
| 24 - Corruption |
| 25 - Public Sentiment & Confidence |
| 26 - Food Price Pressures |
| 27 - Global Output Gap |
| 28 - Pension - Entitlement Crisis |
| 29 - Central & Eastern Europe |
| 30 - Terrorist Event |
| 31 - Pandemic / Epidemic |
| 32 - Rising Inflation Pressures & Interest Pressures |
| 33 - Resource Shortage |
| 34 - Cyber Attack or Complexity Failure |
| 35 - Corporate Bankruptcies |
| 36 - Iran Nuclear Threat |
| 37- Finance & Insurance Balance Sheet Write-Offs |
| 38- Government Backstop Insurance |
| 39 - Oil Price Pressures |
| 40 - Natural Physical Disaster |
Reading the right books?
No Time?
We have analyzed & included
these in our latest research papers Macro videos!
![]()
OUR MACRO ANALYTIC
CO-HOSTS
John Rubino's Just Released Book
Charles Hugh Smith's Latest Books
Our Macro Watch Partner
Richard Duncan Latest Books
MACRO ANALYTIC
GUESTS
F William Engdahl
OTHERS OF NOTE
Book Review- Five Thumbs Up
for Steve Greenhut's
Plunder!
|
Have your own site? Offer free content to your visitors with TRIGGER$ Public Edition!
Sell TRIGGER$ from your site and grow a monthly recurring income!
Contact [email protected] for more information - (free ad space for participating affiliates).
HOTTEST TIPPING POINTS |
Theme Groupings |
||
We post throughout the day as we do our Investment Research for: LONGWave - UnderTheLens - Macro
|
|||
|
MOST CRITICAL TIPPING POINT ARTICLES TODAY
|
|
||
| THEMES - Normally a Thursday "Themes" Post & a Friday "Flows" Post | |||
II-ECONOMIC |
|||
There Is No Spending GrowthSubmitted by Jeffrey Snider via Alhambra Investment Partners, The fiscal year for retailers ended in January with nothing like what it was supposed to be. Still, as always, the suggestions remained that a rebound in consumerism would be before too long. If it wasn’t to be evident right away in February, the start of the 2016 fiscal year was at least supposed to be back in the plus column. Last week, Thomson Reuters noted the starting weakness and all the hoped for blizzard implications.
Among the many prominent victims of the “unexpected” weakness was Macy’s. Not only have same store comps declined four straight quarters, it has left the company with enormous inventory stocks –historically so.
In other words, retailers are stuck at almost a contradiction. They want robust sales growth, and analysts are expecting that to come in relatively short order, but in order for the retail sector to get there it will need to clear inventory likely at significant (further) discounts in order to rebalance. And they need consumers to cooperate by being especially interested in all this discounted merchandise. Consumers were already absent in January:
January same store sales did not grow at all, instead declining rather sharply by 1.1%!
Since 2005, 44% of retailers, on average, beat their same store estimates each month. In February, only 14.3% did. Instead, 71.4% missed compared to the historical average of 54.5%. The weather may have improved, at least so far as an absence of big storms and snow-blown excuses, but shopping did not. That means that the retail environment, as far as sales are concerned, is worse than first believed and showed no improvement at all December to January to February. In short, as with the Census Bureau’s version of overall retail sales, there is a clear consumer problem with implications spread across not just the US economy but overseas (China) perhaps more so.Despite all that, however, the BLS somehow suggests US retailers are hiring at maybe an historic pace and even accelerated hiring greatly in February. The discrepancy is so large as to be mutually exclusive. It is all the more so given that robust hiring in general always leads to more spending, so if there is no spending growth then that already suggests something else about hiring. There is no spending growth. |
|||
Deflation Is Coming To The Auto Industry As Used Car Prices Drop, Off-Lease Deluge LoomsSubmitted by Tyler Durden on 03/08/2016
Last week, we learned that vehicle leasing as a percentage of monthly light-vehicle sales hit a record in February at 32.3%. In other words, a third of the over 1 million cars and light trucks “sold” during the month were leases, according to J.D. Power. This is indicative of what is now a long-term trend. Have a look at the following chart from WSJ, which shows that since 2009, the share of monthly auto leases as a percentage of vehicle sales well more than tripled:
Of course the thing about leased vehicles is that they come back, and as WSJ wrote last week, “about 3.1 million vehicles will return to dealer lots off leases this year, up 20% from 2015 [and] the number will climb to 3.6 million in 2017 and 4 million in 2018.” So what does that mean for dealers? Deflation. And what does that mean for the automakers? Hefty losses. Nothing about this is hard to understand. You get a supply glut causing pricing assumptions for your existing inventory to prove wildly optimistic and you end up with giant writedowns. This has happened before. "The auto industry expanded the use of leasing in the mid-1990s, helping to fuel retail sales of new vehicles," WSJ recounts. "Eventually, a glut of off-lease cars sent resale values down and auto lenders who had bet residuals would remain high ended up racking up billions of dollars in losses, having to sell the cars for much less than they anticipated." Right. Nothing difficult to grasp about that. But the especially silly thing about the dynamic with auto leases is that it was the dealers and the automaker-affiliated financing companies that made the leases in the first place. In other words, it's not like this was some supply shock that couldn't have been forecast ahead of time. In fact, they knew exactly when the off-lease deluge would start, so it's not entirely clear why they would have set optimistic residual assumptions. Anyway, the cracks are already starting to show. The Manheim Used Vehicle Value Index posted its largest Y/Y decline in over two years last month, falling -1.4% and -1.5% M/M. We're now 3.5% below the peak. "All else equal, it puts pressure on lease residuals - though we note most fincos had assumed declining used vehicle prices in their lease writing," Goldman said, earlier today. "Second, while improving inventory acquisition cost for the dealers, it may put downward pressure on the value of existing dealer inventories, which can be negative for used margins." Well yes, declining used vehicle prices "may" be a "negative for used margins" - in fact that's almost a tautology.
And of course falling used car prices means pressure on new car prices as well, which would be a shock to America's booming auto market. Obviously, the scariest part about all of the above is that consumers still have the pedal to the metal (pun fully intended) when it comes to leases, which means there's no end in sight to the off-leases and thus no way to determine, at this juncture, how big the residual writedown wave and deflationary auto industry calamity will ultimately end up being. So, you know... "buckle up." * * * Bonus chart: largest used car price decline for any February since 2008 Wholesale Trade "Gap" Reaches Record High As Sales Tumble, Inventories RiseSubmitted by Tyler Durden on 03/09/2016
Worst.Case.Scenario. In 24 years, the ratio of wholesale inventories to sales has only been higher than the current 1.35x once - at the peak of the recession in the last financial crisis. Wholesale sales tumbled 1.3% MoM (worse than the -0.3% exp) and inventories rose 0.3% MoM while expectations were for a drop of 0.1% (inventories over sales difference rose from $143.6BN to $151.2BN in one month, a new record high.) And finally, automotive inventories rose to 1.78x sales - the highest since the crisis. Keep stacking, despite tumbling sales... Which leaves us firmly in the "recession imminent" section of the business cycle...
And there has never been a wider absolute spread between inventories and sales... And as far as the automotive sector - that bubble may have a problem... This cannot end well. |
|||
TIPPING POINTS, STUDIES, THESIS, THEMES & SII COVERAGE THIS WEEK PREVIOUSLY POSTED - (BELOW)
|
|||
| MOST CRITICAL TIPPING POINT ARTICLES THIS WEEK - Mar 6th, 2016 to Mar 12th, 2016 | |||
| TIPPING POINTS - This Week - Normally a Tuesday Focus | |||
| BOND BUBBLE | 1 | ||
| RISK REVERSAL - WOULD BE MARKED BY: Slowing Momentum, Weakening Earnings, Falling Estimates | 2 | ||
| GEO-POLITICAL EVENT | 3 | ||
| CHINA BUBBLE | 4 | ||
| CHINA BUBBLE | 03-08-16 | 4 | |
"In The Last Seven Years, China Accounted For 40% Of All Global Debt Creation"Submitted by Tyler Durden on 03/07/2016
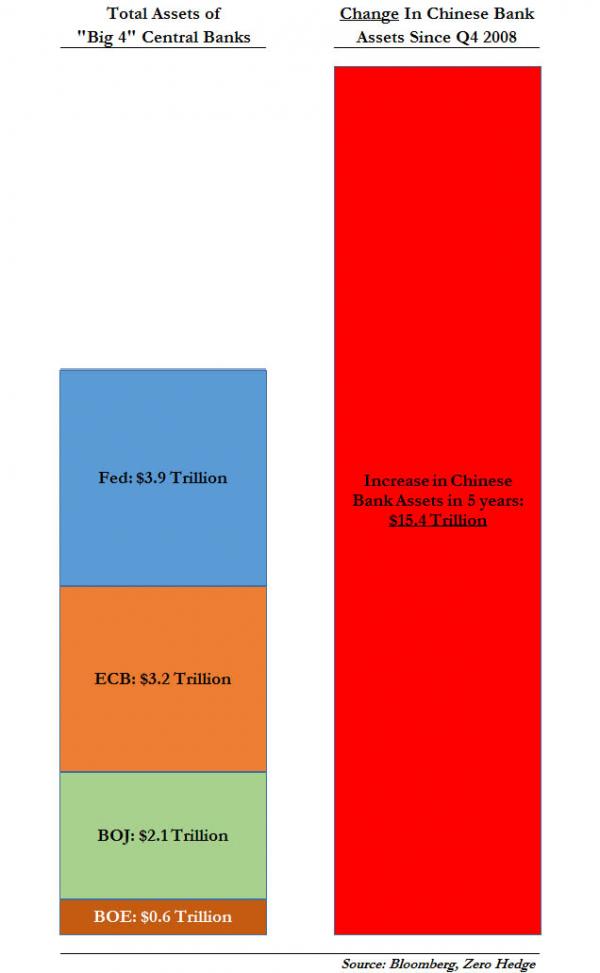
Back in November 2013, when few had an idea just how massive China's debt bubble truly was, we explained "How In Five Short Years, China Humiliated The World's Central Banks" and said the following:
To give a sense of perspective of the numbers involved, we showed the following chart: To be sure, since November 2013, all those numbers have grown substantially, especially at the ECB and BOJ but nowhere more so than in China, where a little over a year later, a famous study by McKinsey showed that not only has the world not delevered, but that the global "debt creation dynamo" was none other than China... ... whose debt/GDP has since grown to an even more astronomical 350% (and rising exponentially). China's - and the entire world's - debt load was very much the highlight of the latest BIS quarterly report (profiled yesterday) in which we learned that the "BIS calls time on world credit binge" and that "China’s Leaders Put the Economy on Bubble Watch" even as these same leaders just raised their budget deficit forecast to its highest ever and previewed an even faster increase in its monetary aggregates or M2, which is now supposed to pick up to 13% per year, or roughly double China's GDP growth rate. So yes, China debt is growing well over 100% faster than its GDP, a condition which is precisely the opposite of Ray Dalio's "beautiful deleveraging", and the outcome is clear to all. And yes, while two years ago few had a sense of the true proportion of China's debt load, now virtually everyone does, which is why its credit creation will be put under a microscope. But what does that mean in practical terms? Simple: recall that it was China's (and the entire EM sector) furious debt issuance spree in 2008 and onward that together with central bank QE, prevented the world from collapsing into an all out depression. But since China's exponential credit growth delayed the inevitable, it also means that any slowdown in China's credit growth (or outright debt destruction if and when the massive debt defaults and NPLs are finally recognized) will put the world right back into the deferred depression. And here, courtesy of Macquarie's Viktor Shvets, is the best encapsulation of the predicament the world finds itself in. From volume 52 of "What Caught My Eye"
Then, after showing the declining velocity of money in all developed markets as leverage exploded higher, Shvets focuses on China:
The punchline: China's velocity of money is now the lowest in the entire world, a world in which China provided 40% of the entire credit impulse since 2008!
And while we agree with the BIS and all those others who suddenly had an epiphany and confirmed what we have been saying for years about China's debt load, the question remains: just who will propel the global debt-creation growth dynamo if China is taken out of the picture, and if 25% of the world is covered in debt-demand destroying NIRP? We hope to get some answers just as soon as the massive short squeeze acorss global markets, the biggest in history, is over
|
|||
China: A 5-Year Plan And 50 Million Jobs LostSubmitted by Tyler Durden on 03/07/2016 13:52 -0500
Submitted by Raul Ilargi Meijer via The Automatic Earth blog,
Going into its 10-day, 3,000 delegates National People’s Congress opening on Friday, China was facing -and very much still is- two major and interconnected problems. Both are problems that the country has never faced before -not a minor point to make. The first is a giant debt load, one that could easily be as high as $40 trillion, or 350% of GDP, once one includes the shadow banking system (watch the shadows!). The second is the Communist Party’s -economic- credibility. The debt problem is impossible to solve without very far-reaching restructurings of both the debt itself and of the entire Chinese economy. There appears to be a problem within the problem, however: the Party neither looks prepared to truly tackle the debt nor does it seem to know how. As for the credibility issue, the very fact that a 5-year plan will be unveiled is the perfect in-a-nutshell illustration of what’s ailing Beijing. Not only does it hark back to communist days of old, not exactly a confidence booster, but trying to look 5 years ahead in today’s global economy is in itself not credible. It forces the Party to make statements nobody in their right mind will believe. And to compound the issue, that is something the leadership doesn’t really seem to take seriously. President Xi Jinping, more than anything else, looks like a man in the tradition of ‘what I say is true because I say so”. That may have worked for a long time inside the country, but the desire to be part of the global economy means the ‘because I say so’ attitude is now being questioned by people Xi can neither bully nor bend into submission. Something he doesn’t seem to have clued into yet. Surrounded as he will be over these ten days by people who’ll say Yes at any appropriate and inappropriate instance, and laugh at anything he says that might be construed as a joke, Xi won’t come out any the wiser. He’d probably be better off spending those days with someone like Kyle Bass, but he’s not doing that. Everybody, including most NPC delegates, knows that China’s grossly overleveraged, overproducing and overcapacitated economy needs another round of mass layoffs. Some initial numbers relating to job losses have been ‘leaked’ prior to the Congress. First, it was 1.8 million jobs cut in the coal and steel sectors, and a few days later that became 6 million. But that can only possibly be just a start. It’s all in the numbers. China has something in the order of a billion workers, give or take 100 million or so. Even with the largest mass migration in human history, in which 100s of millions moved from the countryside to the cities, there are still an estimated 300 million people working in agriculture. That’s the entire US population. It’s also 30% of the Chinese workforce. In the US just 2 or 3% work in farming. But that still leaves 700 million Chinese in other jobs. Many of these jobs were ‘invented’ in the past 20 years, as China’s ‘miracle growth’ transformed it first into the world’s no. 1 trinket producer, then into a kind of powerhouse that built highways to nowhere cities, and today a powerhouse with a fast plummeting global consumer base. Many millions of Chinese workers produce things that can’t be sold. This is by no means confined to just coal and steel. The sharply dropping Chinese import and export numbers, as well as the purchasing indices, tell a bleak story. It’s evident that China must re-invent itself. And while that may be exactly what it claims it’s doing, the -alleged- transition to a service- and/or consumer economy may sound good, but its practical success is far from guaranteed. Transforming a factory worker into a service sector employee is not a matter of flicking a switch. Repeating this 10 million times over, or 20 or 30 million, is a nightmare in an economy that is seeing its growth rates plummet while at the same time needing to deleverage its debt levels. What are all these people going to do that produces actual economic value? And what will be the character of the companies they produce this value at? China is still dominated by state-owned enterprises, with workers relying on the faith that Beijing will always make everything right that goes wrong. Losing that faith may have far-reaching consequences. At the same time, China cannot get the international economic status it so desperately seeks if so many de facto work for the government. Though most tend to forget this, China was in a similar situation not so long ago:
70 million – unproductive- jobs cut in 7 years. An average 10 million per year. A problem the country ‘solved’ by throwing tens of trillions (in US dollars) into overleveraged overproduction at exports-driven manufacturing enterprises. And by moving hundreds of millions of people into the cities that housed the enterprises. 15 years later, many of these newly created jobs have in their turn become unproductive. And the country may have to start the same process all over again. With probably tens of millions more jobs to replace. Question is, how will it fare this time around? Will people accept it as obediently as 15 years ago?
But before wondering about civil obedience, let’s ask again: what are all these people going to do that produces actual economic value? Service economy? Consumer economy? There is no move available this time into another giant and overleveraged export industry. They’re at the end of the -debt- line. Those people that had some money have lost a lot -and will lose much more- in equities and housing markets. Moreover, the government’s attempts to make them feel more secure about their old age would take decades to convince the people. So those who have something to save will do just that. So.. what consumer economy? Service economy? Much of that in China is in financial services. Which has no future. So what else is there? How about the US model of burger flippers? That looks like a winner… See, here’s a depiction of Chinese debt:
And here’s what they plan to do about it:
This’ll be great, as great as the western approach to drowning in debt. Mind you, the Chinese haven’t even started talking about ‘recovery’ like we have, they’re still thinking -or propagandizing- that they’re on an ever upward trail. Well, they’re not. One of the early notes coming out of the People’s Congress was this: “China Says Will Keep Yuan Basically Stable Against Basket Of Currencies ..” That’s not happening. They know it, we know it, and Kyle Bass knows it. Perhaps once the Congress is over, they’ll come clean? Hard to say. What’s certain is that global markets WILL force a substantial re-adjustment of the yuan, and there’s nothing Xi or the entire Communist Party can do to prevent it. And then, after a 30% readjustment, take another look at that dollar-denominated debt! And they’ll have to cut many millions of jobs, and try to ‘pacify’ the newly unemployed, and deleverage the insane debt levels they’ve created, and find a way to explain to their people where it all went so wrong. China no longer lives in a kids’ fantasy Toy Story. |
|||
The Market Has Lost Faith In Our Board, Bank Of International Settlements LamentsSubmitted by Tyler Durden on 03/06/2016
The BIS’ Claudio Borio was vindicated in January - and it was a long time coming. When last we checked in with Claudio, it was December and the bank’s Head of the Monetary and Economic Department was busy explaining what may befall $3.2 trillion in EM USD debt in the persistently strong dollar environment. “The stock of dollar-denominated debt, which has roughly doubled since early 2009 to over $3 trillion, is still there [and] in fact, its value in domestic currency terms has grown in line with the US dollar's appreciation, weighing on financial conditions and weakening balance sheets,” he warned. We also laid out the progression of Borio’s most recent warnings as delineated in the banks’ widely-read, if on occasion perfunctory, quarterly reports. Below, is a brief review. From 2014, warning about the market’s dependence on central bank omnipotence:
From March of 2015, speaking out about the dangers of increasingly illiquid secondary markets for corporate bonds:
And in September of last year, Borio delivered the following rather dramatic assessment of an overleveraged world hooked on central bank stimulus:
Right. So pretty much everything Claudio could be worried about, Claudio was worried about, and the most amusing thing about his concern over undue central banker influence is that the BIS board looks like this:
Well in any case, Borio is back at it and now he can say "I told you so." In the BIS' latest quarterly report, the bank wastes no time in describing the first two months of the year: "uneasy calm gives way to turbulence." After noting that January was one of the most abysmal months for stocks in market history, the bank breaks the meltdown into two distinct "phases":
And then came the obligatory nod to dwindling counter-cyclical capacity:
But the real punchline comes in the end, when the BIS touches on a topic that we've been discussing since mid-January. Namely that this seems to be the year in which the world woke up to the fact that central bankers are not, in fact, omnipotent. We went further:
Almost as if the BIS had simply read the quoted excerpt above and paraphrased it for their own report, here is what the central bank for central bankers says:
We couldn't have said it better ourselves. Except that we did.
|
|||
| JAPAN - DEBT DEFLATION | 5 | ||
EU BANKING CRISIS |
6 |
||
| TO TOP | |||
| MACRO News Items of Importance - This Week | |||
GLOBAL MACRO REPORTS & ANALYSIS |
|||
US ECONOMIC REPORTS & ANALYSIS |
|||
| CENTRAL BANKING MONETARY POLICIES, ACTIONS & ACTIVITIES | |||
| Market - WEDNESDAY STUDIES | |||
| STUDIES - MACRO pdf | |||
TECHNICALS & MARKET |
|
||
TECHNICALS & MARKET Jeff Gundlach, this is his favorite chart - backing his persepctive that equity markets have "2% upside and 20% downside) from here. In his words: "These lines will converge..." |
03-09-16 |
||
The "Smart Money" Is Quietly Getting Out Of Dodge: Sells For A Sixth Straight Week As Buybacks SoarOne week ago, when looking at the latest BofA client flow trend monitor, we noticed something strange: despite the S&P's surge higher due to either a record short squeeze or because it is merely another bear market rally, the smart money was selling. In fact, as BofA's Jill Hall calculated, the three groups that make up the so-called "smart money" basket, hedge funds, BofA's institutional clients as well its private clients, had been selling aggressively every week for the prior five. As she explained on March 1, "last week, during which the S&P 500 climbed 1.6%, BofAML clients were net sellers of US stocks for the fifth consecutive week, in the amount of $1.5bn. This was the biggest weekly outflow since mid-December." Someone clearly was very grateful for the selling opportunity that this squeeze was providing. Well, we can now add one more week to the total: in BofA's latest note, "last week, during which the S&P 500 rallied 2.7%, BofAML clients were net sellers of US stocks for the sixth week." She explains that "similar to the prior week, hedge funds, institutional clients, and private clients were all net sellers, though sales last week were led by private clients (vs. hedge funds the week prior). Our hedge fund clients remain the biggest net sellers of US stocks year-to-date." The full breakdown below:
So, like last week, we again know who is selling but what about the other side: was it just shorts covering who are providing the bid? The answer is no: "buybacks by corporate clients accelerated last week to their highest level since August, and are tracking above levels we saw this time last year, though below levels we observed in 2014 (see chart below). Clients sold both large and small caps last week, but continued to buy mid-caps—which have seen the most persistent buying by our clients over the last several years despite being crowded and expensive."
In retrospect, this makes a lot of sense: with the debt market for all but the moost pristine issuers jammed up, corporations who have relied on debt-funded buybacks to push their price higher have had to step on the accelerator in their buyback activity, to give the impression that the market is back to stable, which in turn could thaw the frozen debt market, allowing them to issue even more debt, whose proceeds they would then use to buy back even more stock. Indeed, the lower the market dropped, the greater the buyback activity had to be to offset the natural selling by the smart money. This is what we said one week ago:
Since then absolutely nothing has changed, and here we are now: 6 weeks of consecutive derisking and selling by hedge funds, institutions and private clients soaked up by what is now a record short squeeze, as well as a near record buyback spree to mask the fact that the "smart money" is bailing. We leave it up to readers to decide just how healthy is this "rally" if the smart money has been selling for nearly 2 months, and where the two primary buying groups are corporations themselves, and shorts squeezed into covering positions. |
|||
| COMMODITY CORNER - AGRI-COMPLEX | |||
| THESIS - Mondays Posts on Financial Repression & Posts on Thursday as Key Updates Occur | |||
|
2016 | THESIS 2016 |  |
| 2015 - FIDUCIARY FAILURE | 2015 | THESIS 2015 |  |
| 2014 - GLOBALIZATION TRAP | 2014 |  |
|
|
2013 2014 |
|||
Dan Amerman: MARGIN RULE CHANGES FORCE NEW PRIVATE FUNDING OF PUBLIC DEBT
FRA Co-Founder Gordon T.Long and Dan Amerman have an in-depth conversation covering various topics such as financial repression, quantitative easing, devious actions of the Fed and much more. Daniel R. Amerman is a Chartered Financial Analyst, author, and speaker, with BSBA and MBA degrees in Finance, and over 30 years of professional financial experience. As an investment banking vice president in the 1980s he did groundbreaking work in the security originations and asset/liability management areas, including CMO/REMIC originations as part of portfolio restructurings for financial institutions, as well as the creation of synthetic securities for institutional clients. As an independent quantitative analyst in the 1990s and 2000s, he structured mortgage-backed bond financings and provided analytical services for real estate acquisitions by multifamily and commercial real estate owners, investment banks, and tax-exempt issuers. Mr. Amerman is the creator of a number of DVDs and books on finance, including two books published by McGraw-Hill (and subsidiary):Mortgage Securities, and Collateralized Mortgage Obligations: Unlock The Secrets Of Mortgage Derivatives. He has been a speaker and workshop leader for sponsors including The Institute for International Research, New York University, and many banking groups. Mr. Amerman has spent a number of years in researching alternatives. Drawing upon his background outside the individual investor industry, he has developed an interrelated group of non-traditional solutions – including asset/liability management strategies – for such concerns as financial crisis, inflation, inflation taxes, low economic growth rates, and pervasive low yield markets. REVISiTING THE EXPANSION OF FIAT CURRENCY The bigger issue is that we had a change in the national debt super cycle. As of 1947 due to the expense of WWII, the outstanding US debt was approximately equal to the size of the total economy. This is as toxic for a country back in 1947 as it is today. Historically the growth rate of heavily indebted countries is much slower. It is a slow economic growth and a high interest rate risk environment. This was not just the US alone, this was most definitely global. What world leaders did as a result was get together, and yes Bretton Woods was part of this and they agreed to put rigid financial controls on the population. Effectively the size of national debt was held down for approximately 25 years while the economies experiences periods of substantial growth. Eventually these national debts as a percent of the economy had dropped down to below 30%. This decline promoted a rapid growth environment, free market interest rate, removal of capital controls, and lifted the limitations on private ownership which we have had since 1973; individuals in the US could not hold gold for investment purposes. RING FENCING “You’re not going to keep up with inflation and there is not much you can do about it. That’s the point of ring fencing.” I split it into two ways. The first is capital controls and second, forcing intermediaries to participate in financial repression. Another component as well is repressing the ownership of precious metals so people do not have an alternative protection from inflation. What’s surprising is that the term financial repression has a conspiracy theory connotation associated with it, when in fact financial repression is an integral part of macroeconomics. It has been a core part of managing financial systems over a long period of time. What’s surprising is that the term financial repression has a conspiracy theory connotation associated with it, when in fact financial repression is an integral part of macroeconomics. It has been a core part of managing financial systems over a long period of time. In the US in a relatively short period of time, particularly in 2010 all these elements were released for the first time since the 1970s. Interest rates were forced down below inflation by massive government intervention, quantitative easing and forms of capital controls all came out together and as a result dominated the markets ever since. The fascinating part is that there has been a series of developments over the last few months which may be the biggest round of financial repression that we have seen since 2010. “Ring fencing which I consider as the third pillar is the forced participation of financial intermediaries in the name of public safety. Two key developments were what came out in 2015 was that the Fed has a part of the financial stability board. This board is the G20, the IMF, World Bank combined and all simultaneously agreed to change their money fund policy as well as their margin rules.” Ring fencing which I consider as the third pillar is the forced participation of financial intermediaries in the name of public safety. Two key developments that came out in 2015 was that the Fed has a part of the financial stability board. This board is the G20, the IMF, World Bank combined and all simultaneously agreed to change their money fund policy as well as their margin rules. They changed regulation on money funds which are apparently done in the name of public safety such that it was an expensive burden for any funds to use anything other than federal debt for their money funds. Effectively creating an enormous financial advantage. “This is a classic scenario. Take a financial intermediary and in the name of public safety make them hold US government debt.” This is a classic scenario. Take a financial intermediary and in the name of public safety make them hold US government debt. In doing this you have expanded the market for government debt by whatever the net change is. Essentially locking in an additional trillion dollars of funding for the debt. “A key thing to make note of is that these are all financial intermediaries, so when people ask who is funding the debt, the answer is all of us are.” We are essentially financing the government through an intermediary. By changing regulations they are both increasing the relationship and locking into it. At this short term end of the yield curve we are doing this for virtually no yield whatsoever. We are providing the money to the federal government through an intermediary whose participation is forced. FORCED MACROPRUDENTIAL POLICIES “They are forcing ever lower interest rates on more of the population. This is providing larger low-cost funds to the government in an ever more constrained manner where it becomes harder for people to escape.” On Nov 12, 2015 the financial stability board agreed to implement margin rule changes. They were talking about it being a blast from the past, it was what central banks used to do in the 1970s. This is now brought back out, but in this case it is also an expansion of the mandate of the Fed. Where we are with these changes is that the Fed will be without active congress and expanding their control over the US markets to all investment firms to participate in some sort of secured lending. Financial firms often need cheap money on a short term basis. They can sell a treasury security to someone else at a given price and agree to buy it back at a higher price; in effect it becomes a short term loan. The difference in price is the interest rate that they are paying, this can be done without an actual sale and instead with the pledge of the securities as collateral. “Central banks are concerned that these low quality collateral loans are now considered to be at risk for triggering a new financial crisis. That’s why they’re changing the regulations where they have the ability to change margin rules at will.” The best known forms of margin deal with stock ownership where your borrowings become limited. If this was raised to 60% or 70% to bring down stock values, people will have to scramble to sell these securities or they will have to come up with the additional cash through some other means, otherwise there will be a forced liquidation. What has been created is a major incentive to use US treasuries securities as collateral for repurchase agreements. Once everyone does this then you get a situation where the Fed is no longer in control of leverage in the market. PREPARING FOR THE FUTURE
Funding for US national debt has just increased by $2.5 trillion. This is very similar to something that is far controversial and that is quantitative easing. Total US treasuries securities held by the Fed are between 2.4 to 2.5 trillion. They are holding this approximate level because they say they are not doing quantitative easing and rather doing purchases every time they take principal to keep at that level. This was major news and made headlines throughout the world, yet something just as big happened and nobody noticed; this is a forced funding of the federal debt that is just as large as what happened with QE. “The Fed is in the process of deploying two massive stabilizers. Why are they doing this in 2016 when they hadn’t done so in 2010?” The logical interpretation would be they are very concerned of what’s to unfold in the future. They are pre-emptively moving major stabilizers in place. To follow Daniel Amerman and his work, please visit http://danielamerman.com/aHome.htm Abstract written by, Karan Singh
|
|||
2011 2012 2013 2014 |
|||
| THEMES - Normally a Thursday "Themes" Post & a Friday "Flows" Post | |||
I - POLITICAL |
|||
CENTRAL PLANNING - SHIFTING ECONOMIC POWER - STATISM
MACRO MAP - EVOLVING ERA OF CENTRAL PLANNING
|
G | THEME | |
| - - CRISIS OF TRUST - Era of Uncertainty | G | THEME | |
CORRUPTION & MALFEASANCE - MORAL DECAY - DESPERATION - RESENTMENT. |
US | THEME PAGE |  |
| - - SECURITY-SURVEILLANCE COMPLEX - STATISM | G | THEME | |
| - - CATALYSTS - FEAR (POLITICALLY) & GREED (FINANCIALLY) | G | THEME | |
II-ECONOMIC |
|||
| GLOBAL RISK | |||
| - GLOBAL FINANCIAL IMBALANCE - FRAGILITY, COMPLEXITY & INSTABILITY | G | THEME | |
| - - SOCIAL UNREST - INEQUALITY & A BROKEN SOCIAL CONTRACT | US | THEME | |
| - - ECHO BOOM - PERIPHERAL PROBLEM | M | THEME | |
| - -GLOBAL GROWTH & JOBS CRISIS | |||
| - - - PRODUCTIVITY PARADOX - NATURE OF WORK | THEME | MA w/ CHS |
|
| 01-08-16 | THEME | MA w/ CHS |
|
| - - - STANDARD OF LIVING - EMPLOYMENT CRISIS, SUB-PRIME ECONOMY | US | THEME | MA w/ CHS |
III-FINANCIAL |
|||
|
FLOWS - Capital, Liqudity & Credit Flows
|
MATA RISK ON-OFF |
THEME | |
| CRACKUP BOOM - ASSET BUBBLE | 12-31-15 | THEME | |
| SHADOW BANKING - LIQUIDITY / CREDIT ENGINE | M | THEME | |
| GENERAL INTEREST |
|
||
| STRATEGIC INVESTMENT INSIGHTS - Weekend Coverage | |||
 |
|||
|
SII | ||
|
SII | ||
|
SII | ||
|
SII | ||
| TO TOP | |||
Read More - OUR RESEARCH - Articles Below
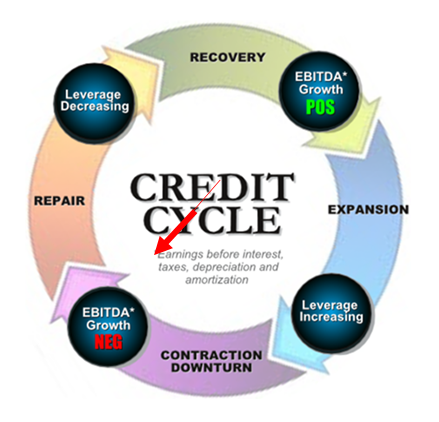
Tipping Points Life Cycle - Explained
Click on image to enlarge
TO TOP
�
TO TOP
