|
JOHN RUBINO'SLATEST BOOK |
|||||||||||||||||||||||||||||||||||||||||||||||||||||||||||||||||||||||||||||||||||||||||||||||||||||||||||||||||||||||||||||||||||||||||||||||||||||||||||||||||||||||||||||||||||||||||||||||||||||||||||||||||||||||||
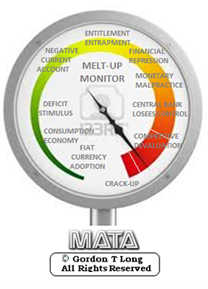
"MELT-UP MONITOR "
Meltup Monitor: FLOWS - The Currency Cartel Carry Cycle - 09 Dec 2013 Meltup Monitor: FLOWS - Liquidity, Credit & Debt - 04 Dec 2013 Meltup Monitor: Euro Pressure Going Critical - 28- Nov 2013 Meltup Monitor: A Regression-to-the-Exponential Mean Required - 25 Nov 2013
|

![]()
"DOW 20,000 "
Lance Roberts Charles Hugh Smith John Rubino Bert Dohman & Ty Andros
|

HELD OVER
Currency Wars
Euro Experiment
Sultans of Swap
Extend & Pretend
Preserve & Protect
Innovation
Showings Below
"Currency Wars "
|


"SULTANS OF SWAP" archives open ACT II ACT III
ALSO Sultans of Swap: Fearing the Gearing! Sultans of Swap: BP Potentially More Devistating than Lehman! |

"EURO EXPERIMENT"
archives open EURO EXPERIMENT : ECB's LTRO Won't Stop Collateral Contagion!
EURO EXPERIMENT: |

![]()
"INNOVATION"
archives open |

"PRESERVE & PROTE CT"
archives open |

Wed. Mar. 12th, 2014
![]()
Follow Our Updates
on TWITTER
https://twitter.com/GordonTLong
AND FOR EVEN MORE TWITTER COVERAGE
STRATEGIC MACRO INVESTMENT INSIGHTS
 2014 THESIS: GLOBALIZATION TRAP
NOW AVAILABLE FREE to Trial Subscribers
185 Pages
What Are Tipping Poinits?
Understanding Abstraction & Synthesis
Global-Macro in Images: Understanding the Conclusions
| MARCH | ||||||
| S | M | T | W | T | F | S |
| 1 | ||||||
| 2 | 3 | 4 | 5 | 6 | 7 | 8 |
| 9 | 10 | 11 | 12 | 13 | 14 | 15 |
| 16 | 17 | 18 | 19 | 20 | 21 | 22 |
| 23 | 24 | 25 | 26 | 27 | 28 | 29 |
| 30 | 31 | |||||
KEY TO TIPPING POINTS |
| 1 - Risk Reversal |
| 2 - Japan Debt Deflation Spiral |
| 3- Bond Bubble |
| 4- EU Banking Crisis |
| 5- Sovereign Debt Crisis |
| 6 - China Hard Landing |
| 7 - Chronic Unemployment |
| 8 - Geo-Political Event |
| 9 - Global Governance Failure |
| 10 - Chronic Global Fiscal ImBalances |
| 11 - Shrinking Revenue Growth Rate |
| 12 - Iran Nuclear Threat |
| 13 - Growing Social Unrest |
| 14 - US Banking Crisis II |
| 15 - Residential Real Estate - Phase II |
| 16 - Commercial Real Estate |
| 17 - Credit Contraction II |
| 18- State & Local Government |
| 19 - US Stock Market Valuations |
| 20 - Slowing Retail & Consumer Sales |
| 21 - China - Japan Regional Conflict |
| 22 - Public Sentiment & Confidence |
| 23 - US Reserve Currency |
| 24 - Central & Eastern Europe |
| 25 - Oil Price Pressures |
| 26 - Rising Inflation Pressures & Interest Pressures |
| 27 - Food Price Pressures |
| 28 - Global Output Gap |
| 29 - Corruption |
| 30 - Pension - Entitlement Crisis |
| 31 - Corporate Bankruptcies |
| 32- Finance & Insurance Balance Sheet Write-Offs |
| 33 - Resource Shortage |
| 34 - US Reserve Currency |
| 35- Government Backstop Insurance |
| 36 - US Dollar Weakness |
| 37 - Cyber Attack or Complexity Failure |
| 38 - Terrorist Event |
| 39 - Financial Crisis Programs Expiration |
| 40 - Natural Physical Disaster |
| 41 - Pandemic / Epidemic |
Reading the right books?
No Time?

We have analyzed & included
these in our latest research papers Macro videos!
![]()
OUR MACRO ANALYTIC
CO-HOSTS
John Rubino's Just Released Book

![]()
Charles Hugh Smith's Latest Books
![]()
![]()
Our Macro Watch Partner
Richard Duncan Latest Books

MACRO ANALYTIC
GUESTS
F William Engdahl

![]()

![]()

![]()

![]()

![]()
OTHERS OF NOTE
![]()
![]()

![]()


![]()
Book Review- Five Thumbs Up
for Steve Greenhut's
Plunder!

![]()
|
Scroll TWEETS for latest Analysis
Read More - OUR RESEARCH - Articles Below
We post throughout the day as we do our Investment Research for: LONGWave - UnderTheLens - Macro |
|||
"BEST OF THE WEEK "
|
Posting Date |
Labels & Tags | TIPPING POINT or 2013 THESIS THEME |
HOTTEST TIPPING POINTS |
Theme Groupings |
||
RETAIL CRE - Unfolding Implosion Consumer Discretionary Sector Has Seen Largest Cuts to Earnings Estimates since December 31
The estimated earnings growth rate for Q1 2014 of 0 .5% is below the estimate of 4.4% at the start of the quarter (December 31). Nine of the ten sectors have recorded a decline in expected earnings growth during this time frame, led by the Consumer Discretionary, Materials, Consumer Staples, and Information Technology sectors. The only sector that has seen an increase in projected earnings growth over this period is the Utilities sector. LARGEST DECLINE: The Consumer Discretionary sector has witnessed the largest decline in expected earnings growth (to 4.6% from 12.8%) since the beginning of the quarter . Companies that have seen the largest cuts to estimates during this time include
SECOND LARGEST: The Materials sector has witnessed the second large st dip in expected earnings growth (to 1.5% from 9.1%) since the start of the quarter. Companies in the Metals & Mining industry have seen major reductions to EPS estimates during this time, inclu ding Allegheny Technologies (to -$0.08 from $0.03), Cliffs Natural Resources (to $0.10 from $0.39), and Newmont Mining (to $0.19 from $0.48). THIRD LARGEST: The Consumer Staples sector has seen the third larg est drop in expected earnings growth (to 1.6% from 6.9%) since the beginning of the quarter. Companies that have seen significant reductions in EPS estimates during this time include
EPS Guidance: High Percentage (84%) of Negative Guidance At this stage of the quarter, 103 companies in the index have issued EPS guidance for the fourth quart er. Of these 103 companies, 86 have issued negative EPS guidance and 17 have issued positive EPS guidance. Thus, the percentage of companies issuing negative EPS guidance to date for the fourth quarter is 84% (86 out of 103). This percentage is well above the 5-year average of 63%. If the final percentage is 84%, it will mark the third consecuti ve quarter in which 80% or more of the companies that issued EPS guidance for the quarter issued neg ative EPS guidance.
|
03-12-14 | RETAIL CRE | 20 - Slowing Retail & Consumer Sales |
RETAIL CRE - Unfolding Implosion 20 Stunning Facts On The US Retail Apocalypse 03-10-14 Michael Snyder of The Economic Collapse blog, via ZH If the U.S. economy is getting better, then why are major retail chains closing thousands of stores? If we truly are in an "economic recovery", then why do sales figures continue to go down for large retailers all over the country? Without a doubt, the rise of Internet retailing giants such as Amazon.com have had a huge impact. Today, there are millions of Americans that actually prefer to shop online. Personally, when I published my novel I made it solely available on Amazon. But Internet shopping alone does not account for the great retail apocalypse that we are witnessing. In fact, some retail experts estimate that the Internet has accounted for only about 20 percent of the decline that we are seeing. Most of the rest of it can be accounted for by the slow, steady death of the middle class U.S. consumer. Median household income has declined for five years in a row, but all of our bills just keep going up. That means that the amount of disposable income that average Americans have continues to shrink, and that is really bad news for retailers. And sadly, this is just the beginning. Retail experts are projecting that the pace of store closings will actually accelerate over the course of the next decade. So as you read this list below, please take note that things will soon get even worse. The following are 20 facts about the great U.S. retail apocalypse that will blow your mind... #1 As you read this article, approximately a billion square feet of retail space is sitting vacant in the United States. #2 Last week, Radio Shack announced that it was going to close more than a thousand stores. #3 Last week, Staples announced that it was going to close 225 stores. #4 Same-store sales at Office Depot have declined for 13 quarters in a row. #5 J.C. Penney has been dying for years, and it recently announced plans to close 33 more stores. #6 J.C. Penney lost 586 million dollars during the second quarter of 2013 alone. #7 Sears has closed about 300 stores since 2010, and CNN is reporting that Sears is "expected to shutter another 500 Sears and Kmart locations soon". #8 Overall, sales numbers have declined at Sears for 27 quarters in a row. #9 Target has announced that it is going to eliminate 475 jobs and not fill 700 positions that are currently empty. #10 It is being projected that Aéropostale will close about 175 stores over the next couple of years. #11 Macy's has announced that it is going to be closing five stores and eliminating 2,500 jobs. #12 The Children’s Place has announced that it will be closing down 125 of its "weakest" storesby 2016. #13 Best Buy recently shut down about 50 stores up in Canada. #14 Video rental giant Blockbuster has completely shut down all of their stores. #15 It is being projected that sales at U.S. supermarkets will decline by 1.7 percent this year even as the overall population continues to grow. #16 McDonald's has reported that sales at established U.S. locations were down 3.3 percent in January. #17 A home appliance chain known as "American TV" in the Midwest is going to be shutting down all 11 stores. #18 Even Wal-Mart is struggling right now. Just check out what one very prominent Wal-Mart executive recently admitted...
#19 In a recent CNBC article entitled "Time to close Wal-Mart stores? Analysts think so", it was recommended that Wal-Mart should close approximately 100 "underperforming" supercenters in rural locations across America. #20 Retail consultant Howard Davidowitz is projecting that up to half of all shopping malls in America may shut down within the next 15 to 20 years...
So is there any hope that things will turn around? Well, if the U.S. economy started producing large numbers of good paying middle class jobs there would definitely be cause for optimism. Unfortunately, that is just not happening. On Friday, we were told that the U.S. economy added 175,000 jobs during the month of February. That sounds pretty good until you realize that it takes almost that many jobs each month just to keep up with population growth. And according to CNS News, the number of unemployed Americans actually grew faster than the number of employed Americans in February...
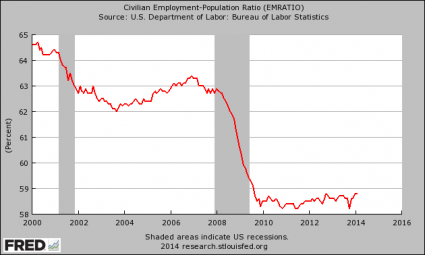
Meanwhile, the labor force participation rate continues to sit at a 35 year low, and a staggering 70 percent of all Americans not in the labor force are below the age of 55. That is outrageous. And things look particularly depressing when you look at the labor force participation rate for men by themselves. In 1950, the labor force participation rate for men was sitting at about 87 percent. Today, it has dropped beneath 70 percent to a brand new all-time record low. The truth is that there simply are not enough jobs for everyone anymore. The chart posted below shows how the percentage of working age Americans that actually have a job has changed since the turn of the millennium. As you can see, the employment-population ratio declined precipitously during the last recession, and it has stayed below 59 percent since late 2009...
If we were going to have a "recovery", we should have had one by now. Since there are not enough jobs, what is happening is that more highly educated workers are taking the jobs that were once occupied by less educated workers and bumping them out of the labor force entirely. The following is an excerpt from a recent Bloomberg article...
Due to the fact that there are not enough middle class jobs to go around, the middle class has been steadily shrinking. In 2008, 53 percent of all Americans considered themselves to be "middle class". Today, only44 percent of all Americans consider themselves to be "middle class". That is a pretty significant shift in just six years, don't you think? For much more on this, please see my previous article entitled "28 Signs That The Middle Class Is Heading Toward Extinction". Despite what the politicians and the mainstream media are telling you, the truth is that something is fundamentally wrong with our economy. On a gut level, most people realize this. According to one recent survey, only 35 percent of all Americans say that they are better off financially than they were a year ago. And according to a recent NBC News/Wall Street Journal poll, only 28 percent of all Americans believe that this country is moving in the right direction. The frightening thing is that this is about as good as things are going to get. The next great wave of the economic collapse is approaching, and when it strikes the plight of the middle class is going to get a whole lot worse.
|
03-11-14 | RETAIL CRE | 20 - Slowing Retail & Consumer Sales |
Q1 VALUATIONS - Markets in a "Topping Process" Is the S&P 500 Overvalued? 03-07-14 Excerpted & Annotated from Fastset During the past week (on March 6), the value of the S&P 500 index closed at yet another all-time high. The forward 12-month P/E ratio for the S&P 500 now stands at 15.4, based on yesterday’s closing price (1877.03) and forward 12-month EPS estimate ($121.8 6). Given the record high values driving the “P” in the P/E ratio, how does this 15.4 P/E ratio compare to historical averages? The current forward 12-month P/E ratio is above both the 5-year average (13.2) and the 10-year average (13.8). The P/E ratio has been above the 5-year ave rage for more than a year (since January 2013), while it has been above the 10-year average for the past six months. With the forward P/E ratio well above the 5-year and 10-year averages, one could argue th at the index may now be overvalued. On the other hand, the current forward 12-month P/E ratio is still below the 15-year average (16.0). During the first two years of this time frame (1999 – 2001), the forward 12-month P/E ratio was consistently above 20.0, peaking at around 25.0 at various points in time. With the forward P/E ratio still below the 15-year average and not close to the high er P/E ratios recorded in the early years of this period, one could argue that the index may still be undervalued. It is interesting to note that the forward 12-month P/E ratio would be even higher if analysts were no t projecting record-level EPS for the next four quart ers. At this time, the Q4 2013 quarter has the reco rd for the highest bottom-up EPS at $28.78. However, s tarting in Q2 2014, industry analysts are projectin g EPS for each of the next four quarters to exceed th is record amount. In aggregate, they are calling fo r 11.3% growth in EPS over the next four quarters (Q2 14 – Q115), compared to the previous four quarters (Q213 – Q114)
|
03-12-14 | Q1 VALUATIONS | |
RUSSELL - 42% above 200 WMA. Historically a Top. Expect pain after April 15th and before June Witching
|
03-11-14 | RISK | |
STRATEGIC MACRO INVESTMENT INSIGHTS TRIGGER$ ANALYSIS |
03-10-14 | GOLD | |
| MOST CRITICAL TIPPING POINT ARTICLES THIS WEEK - March 9th - March 15th, 2014 | |||
| RISK REVERSAL | 1 | ||
| JAPAN - DEBT DEFLATION | 2 | ||
| BOND BUBBLE | 3 | ||
EU BANKING CRISIS |
4 |
||
| SOVEREIGN DEBT CRISIS [Euope Crisis Tracker] | 5 | ||
| CHINA BUBBLE | 6 | ||
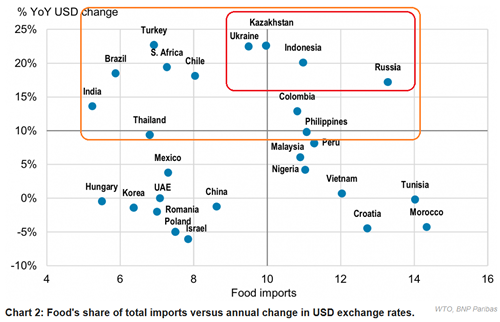
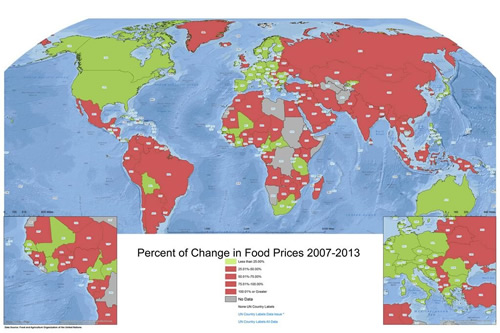
UKRAINE - Disruptive Choke Points The Ukrainean Breadbasket Has Food Price Pressures
Things Could Potentially Get Worse
There is a Correlation Between Food Price Inflation & Social Unrest
|
03-11-14 | UKRAINE | 8 - Geo-Political Event |
| TO TOP | |||
| MACRO News Items of Importance - This Week | |||
GLOBAL MACRO REPORTS & ANALYSIS |
|||
US ECONOMIC REPORTS & ANALYSIS |
|||
| CENTRAL BANKING MONETARY POLICIES, ACTIONS & ACTIVITIES | |||
| Market | |||
| TECHNICALS & MARKET |
|
||
| COMMODITY CORNER - HARD ASSETS | PORTFOLIO | ||
| COMMODITY CORNER - AGRI-COMPLEX | PORTFOLIO | ||
| SECURITY-SURVEILANCE COMPLEX | PORTFOLIO | ||
| THESIS | |||
| 2014 - GLOBALIZATION TRAP | 2014 |  |
|
 |
|||
|
2013 2014 |
 |
||
2011 2012 2013 2014 |
 |
||
| THEMES | |||
| FLOWS -FRIDAY FLOWS | THEME |  |
|
| SHADOW BANKING -LIQUIDITY / CREDIT ENGINE | THEME | ||
| CRACKUP BOOM - ASSET BUBBLE | THEME | ||
| ECHO BOOM - PERIPHERAL PROBLEM | THEME | ||
| PRODUCTIVITY PARADOX -NATURE OF WORK | THEME | ||
| STANDARD OF LIVING -EMPLOYMENT CRISIS | THEME | ||
| CORPORATOCRACY -CRONY CAPITALSIM | THEME |  |
|
CORRUPTION & MALFEASANCE -MORAL DECAY - DESPERATION, SHORTAGES. |
THEME |  |
|
| SOCIAL UNREST -INEQUALITY & A BROKEN SOCIAL CONTRACT | THEME | ||
| SECURITY-SURVEILLANCE COMPLEX -STATISM | THEME | ||
| GLOBAL FINANCIAL IMBALANCE - FRAGILITY, COMPLEXITY & INSTABILITY | THEME | ||
| CENTRAL PLANINNG -SHIFTING ECONOMIC POWER | THEME | ||
| CATALYSTS -FEAR & GREED | THEME | ||
| GENERAL INTEREST |
|
||
| TO TOP | |||


Tipping Points Life Cycle - Explained
Click on image to enlarge
TO TOP
 |
YOUR SOURCE FOR THE LATEST THINKING & RESEARCH
|
�
TO TOP