|
 Scroll TWEETS for LATEST Analysis Scroll TWEETS for LATEST Analysis 
HOTTEST TIPPING POINTS |
|
|
Theme Groupings |
|
We post throughout the day as we do our Investment Research for:
LONGWave - UnderTheLens - Macro |
"BEST OF THE WEEK "
|
Posting Date |
Labels & Tags |
TIPPING POINT
or
THEME / THESIS
or
INVESTMENT INSIGHT
|

MOST CRITICAL TIPPING POINT ARTICLES TODAY
|
|
|
|
|
|
|
|
BYE BUY - 14 big stores shrink fastest
Bye buy: 14 big stores shrink fastest
It's going to be harder to find a Walgreens – the drugstore chain is closing hundreds of stores in the U.S. You'll also have to look harder to find office supply sellers and some apparel sellers, too.
Walgreens Boots Alliance, the parent of the Walgreens drugstore, is just one of 14 major publicly traded companies that are reducing their store counts the quickest (even as the economy is growing?), according to a USA TODAY analysis of data from S&P Capital IQ. The closures show just how some bricks-and-mortar retailers are contracting as online shopping grows and consumers tastes shift.
Department store Sears Holdings, office supply seller Office Depot and teen apparel retailer Aeropostale reported the largest percentage declines in the number of stores in their most recently reported annual counts compared with a year ago. The analysis is limited to the stores that report annual store counts, which is most, but not all.
So far, investors don't seem to mind the strategy of cutting stores. A custom equal-weighted index of the 14 retailers closing stores the fastest is up 18% over the past year, topping the 11% gain by the entire Russell 3000 index during the same time period. Much of the outperformance has occurred this year.
| Company |
Symbol |
% ch. # of stores * |
Ch. # of stores |
% ch. stock past 12 mo. * |
| Abercrombie & Fitch |
ANF |
-3.7 |
-37 |
-41 |
| Aeropostale |
ARO |
-8.1 |
-97 |
-30.1 |
| Build-A-Bear Workshop |
BBW |
-3.4 |
-14 |
82.5 |
| Christopher & Banks |
CBK |
-8 |
-45 |
-11.8 |
| Fred’s |
FRED |
-6.1 |
-43 |
-8.7 |
| J.C. Penney |
JCP |
-3.8 |
-42 |
4.3 |
| Land’s End |
LE |
-13.8 |
-40 |
26.4 |
| Office Depot |
ODP |
-11.3 |
-255 |
118.1 |
| Rent-A-Center |
RCII |
-4.6 |
-152 |
0 |
| Roundy’s |
RNDY |
-9.2 |
-15 |
-16 |
| Sears Holdings |
SHLD |
-29 |
-704 |
20.7 |
| SpartanNash |
SPTN |
-5.8 |
-10 |
40.8 |
| Staples |
SPLS |
-8.6 |
-186 |
33 |
| Walgreens Boots Alliance |
WBA |
-3.2 |
-273 |
41.4 |
Part of the run in the shares of retailers closing stores, though, is part of what's been a surprising retail stock rally. The index of retailers closing stores is actually underperforming the 27.7% gain of the S&P 500 Retailing index. It's the smaller retailers, measured by the S&P 600 Retailing index, that are underperforming as the smaller players struggle.
Read More Sears reacts to critics, moves forward with REIT
Sears Holdings, the retailer that's been trying to fix itself for years, is the U.S. retailer shrinking the most. The company reported 1,725 total stores of during its fiscal year ended January 2015. That's down 29% from the 2,429 stores it reported in fiscal 2013.
Reducing stores is part of the company's strategy to regain its footing as consumers shift more spending online and prefer more specialized or larger retailers. It's the third straight year Sears reported a smaller number of stores. Sears now has less than half the number of stores it had in 2011. Unfortunately, the company's losses are only expanding.
Read More Aéropostale investors lose hope in turnaround
The company reported a net loss of $1.7 billion during the fiscal year ended in January. It hasn't made money since 2011. But hey, the stock is up 21% over the past year. Maybe it should close even more stores?
Office supply stores have also been rapidly closing locations – urging customers to move their business online. Office Depot reported 255 fewer stores this past fiscal year, down 11% from the same period a year ago. Interestingly, the company's revenue rose in fiscal 2014 by 43% to $16.1 billion despite the fewer number of locations.
Read More JC Penney is a dark horse retail stock: Analyst
But its losses widened, too, hitting $354 million during the fiscal year. The company is being bought by rival Staples, which reduced its number of stores by nearly 9%.
Walgreens is the latest retailer to turn to store closings this year. But it was already reducing store counts last fiscal year ended in August 2014. The company reported 273 fewer stores in fiscal 2014, which was a reduction of 3.2%. But the stock? That's up 41% over the past year.
Hope investors don't need to find a drugstore.
RELATED SECURITIES
Symbol |
Price |
|
Change |
%Change |
| FRED |
16.98 |
--- |
UNCH |
0% |
| SPLS |
16.72 |
--- |
UNCH |
0% |
| ANF |
21.72 |
--- |
UNCH |
0% |
| WBA |
92.02 |
--- |
UNCH |
0% |
| LE |
33.70 |
--- |
UNCH |
0% |
| SHLD |
42.93 |
--- |
UNCH |
0% |
| ODP |
9.27 |
--- |
UNCH |
0% |
| RCII |
27.41 |
--- |
UNCH |
0% |
| CBK |
5.63 |
--- |
UNCH |
0% |
| SPTN |
32.04 |
--- |
UNCH |
0% |
| ROUNDYS |
5.68 |
--- |
UNCH |
0% |
| BBW |
20.75 |
--- |
UNCH |
0% |
| JCP |
9.22 |
--- |
UNCH |
0% |
| ARO |
3.43 |
--- |
UNCH |
0% |
|
04-11-15 |
SII
RETAIL - CRE |
|
| MOST CRITICAL TIPPING POINT ARTICLES THIS WEEK - April 5th, 2015 - Apr. 11th, 2015 |
|
|
|
| RISK REVERSAL - WOULD BE MARKED BY: Slowing Momentum, Weakening Earnings, Falling Estimates |
|
|
1 |
| CHINA BUBBLE |
|
|
2 |
| JAPAN - DEBT DEFLATION |
|
|
3 |
| BOND BUBBLE |
|
|
4 |
EU BANKING CRISIS |
|
|
5 |
| SOVEREIGN DEBT CRISIS [Euope Crisis Tracker] |
|
|
6 |
GLOBAL RISK - IMF Warns of Permanent Stagnation
Exhausted world stuck in permanent stagnation warns IMF 04-07-15 Teelgraph Ambose Evans-Pritchard
The global economy is acutely vulnerable to a fresh recession with debt ratios at record highs. The authorities have already used up most of their ammunition.
LOW GROWTH TRAP
- Innovation withers and the
- Population ages across the Northern Hemisphere.
The global economy is caught in a low-growth trap as innovation withers and the population ages across the Northern Hemisphere. It will not regain its lost dynamism in the foreseeable future, the International Monetary Fund has warned.
The IMF said
the world as a whole has seen a “persistent reduction” in its growth rate since the Great Recession and shows no sign of returning to normal, marking a fundamental break in historical patterns.
This exposes the global economic system to a host of pathologies that may be hard to combat, and leaves it acutely vulnerable to a fresh recession. It is unclear what the authorities could do next to fight off a slump given that debt ratios are already at record highs and central banks are running out of ammunition.
“Lower potential growth will make it more difficult to reduce high public and private debt ratios,” the IMF said in an advance chapter from next week’s World Economic Outlook. "It is also likely to be associated with low equilibrium real interest rates, meaning that monetary policy in advanced economies may again be confronted with the problem of the zero lower bound if adverse growth shocks materialise."
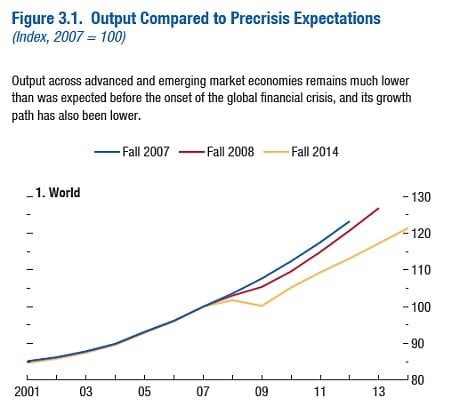
The developing world is likely to limp on with average growth of just 1.6pc from 2015 to 2020, too little to make a dent on the edifice of public debt left from the Great Recession.
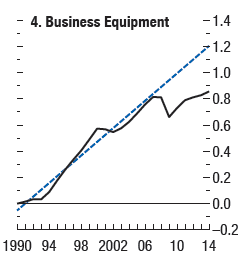
The Fund said global bourses have charged ahead of reality, soaring to new highs despite a 25pc slump in levels of business investment since 2008. There has been a chronic lack of spending on the sorts of equipment and computer software that drive gains in competitiveness. “This development is worrying, because business investment is essential for supporting the economy’s future productive capacity,” it said.
“In some countries, weak business investment has contrasted with the ebullience of stock markets, suggesting a possible disconnect between financial and economic risk taking,” it said.
The great hope is that booming asset prices will trigger a surge of investment, allowing economic fundamentals to catch up with markets. But it is far from certain that this will happen unless governments change policy and launch a blitz of spending on infrastructure and research to unlock frozen capital and set off a virtuous circle.
While the IMF has supported quantitative easing in the past, the implicit message is that this form of stimulus chiefly has the effect of boosting asset prices and has proved a very blunt tool for the real economy, at least in the manner currently conducted. It cannot fully counter the effects of fiscal austerity.
FALLING PRODUCTIVITY
The IMF says Europe and the US began to falter at the turn of the century. Total factor productivity growth – the primary driver of wealth-creation - slid from 0.9pc to 0.5pc even before the collapse of the financial system in 2008.
The emerging world has since succumbed to the same malaise as it runs into structural barriers and exhausts the low-hanging fruit from easy catch-up growth, forcing the IMF to downgrade its global growth forecasts repeatedly since 2011.
Productivity in these countries has almost halved from 4.25pc to 2.25pc since the Lehman Brothers crisis and is likely to fall further as they hit the “technology frontier”, where the middle income trap lies in wait for any that fail to adapt in time. Many need root-and-branch reforms of their product and labour markets, and an assault on excess regulation.
The report almost seemed to describe a spent world where the great leap forward from the computer age and the internet is already over and little more can be squeezed out of universities as the “marginal return to additional education” keeps falling.
Casting a shadow over all else is the demographic crunch. The working-age population will be shrinking at a rate of 0.2pc a year in Germany and Japan by 2020, with Korea close behind, and China following on hard. Almost the whole of Eastern Europe faces an ageing crisis.
Whether the world really is nearing the end of its growth miracle is a hotly disputed theme. Ben Bernanke, the former chairman of the US Federal Reserve, insisted in a recent inaugural blog for the Brookings Institution that the US economy would right itself naturally as so often before.
He reminded pessimists that leading economists fretted about the end of growth in much the same way during the Great Depression. Harvard’s Alvin Hansen – the leading American Keynesian of his age – coined today’s vogue term “secular stagnation” in 1938, arguing even then that population growth was slowing and the big advances in technology were mostly finished.
He lived long enough to witness three decades of spectacular global progress after 1945.
|
04-08-15 |
MACRO OUTLOOK |
8 - Shrinking Revenue Growth Rate |
GLOBAL RISK - March “the moment the United States lost its role as the underwriter of the global economic system.”
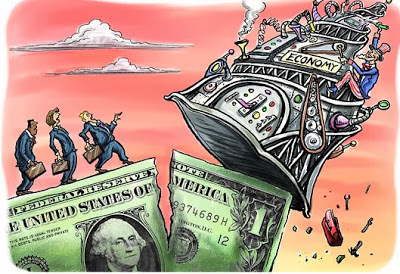
Time US Leadership Woke Up To New Economic Era, 04-06-15 FT Larry Summers
This past month may be remembered as the moment the United States lost its role as the underwriter of the global economic system.
True, there have been any number of periods of frustration for the US before, and times when American behaviour was hardly multilateralist, such as the 1971 Nixon shock, ending the convertibility of the dollar into gold. But I can think of no event since Bretton Woods comparable to the combination of
- China’s effort to establish a major new institution andTthe failure of the US to persuade dozens of its traditional allies, starting with Britain, to stay out of it.
This failure of strategy and tactics was a long time coming, and it should lead to a comprehensive review of the US approach to global economics. With China’s economic size rivalling America’s and emerging markets accounting for at least half of world output,
the global economic architecture needs substantial adjustment.
Political pressures from all sides in the US have rendered it increasingly dysfunctional.
Largely because of resistance from the right, the US stands alone in the world in failing to approve the International Monetary Fund governance reforms that Washington itself pushed for in 2009. By supplementing IMF resources, this change would have bolstered confidence in the global economy. More important, it would come closer to giving countries such as China and India a share of IMF votes commensurate with their new economic heft.
Meanwhile, pressures from the left have led to pervasive restrictions on infrastructure projects financed through existing development banks, which consequently have receded as funders, even as many developing countries now see infrastructure finance as their principle external funding need.
With US commitments unhonoured and US-backed policies blocking the kinds of finance other countries want to provide or receive through the existing institutions, the way was clear for China to establish the Asian Infrastructure Investment Bank.
There is room for argument about the tactical approach that should have been taken once the initiative was put forward. But the larger question now is one of strategy. Here are three precepts that US leaders should keep in mind.
First, American leadership must have a bipartisan foundation at home, be free from gross hypocrisy and be restrained in the pursuit of self-interest. As long as
- One of our major parties is opposed to essentially all trade agreements, and the other is
- Resistant to funding international organisations,
.. the US will not be in a position to shape the global economic system.
Other countries are legitimately frustrated when US officials ask them to adjust their policies — then insist that American state regulators, independent agencies and far-reaching judicial actions are beyond their control. This is especially true when many foreign businesses assert that US actions raise real rule of law problems.
The legitimacy of US leadership depends on our resisting the temptation to abuse it in pursuit of parochial interest, even when that interest appears compelling. We cannot expect to maintain the dollar’s primary role in the international system if we are too aggressive about limiting its use in pursuit of particular security objectives.
Second, in global as well as domestic politics, the middle class counts the most. It sometimes seems that the prevailing global agenda combines elite concerns about matters such as intellectual property, investment protection and regulatory harmonisation with moral concerns about global poverty and posterity, while offering little to those in the middle. Approaches that do not serve the working class in industrial countries (and rising urban populations in developing ones) are unlikely to work out well in the long run.
Third, we may be headed into a world where capital is abundant and deflationary pressures are substantial. Demand could be in short supply for some time. In no big industrialised country do markets expect real interest rates to be much above zero in 2020 or inflation targets to be achieved. In the future, the priority must be promoting investment, not imposing austerity. The present system places the onus of adjustment on “borrowing” countries. The world now requires a symmetric system, with pressure also placed on “surplus” countries.
These precepts are just a beginning, and many questions remain. There are questions
- about global public goods,
- about acting with the speed and clarity that the current era requires,
- about co-operation between governmental and non-governmental actors, and much more.
What is crucial is that the events of the past month will be seen by future historians not as the end of an era, but as a salutary wake up call.
|
04-07-15 |
GLOBAL RISK
GEO-POL
GOVERNANCE
AIIB |
11 - Global Governance Failure |
GLOBAL RISK - It just happened: “The moment the United States lost its role . . .”
It just happened: “The moment the United States lost its role . . .” 04-06-15 Sovereign Man
Sovereign Man explains the ramifications of the new Asian Infrastructure Investment Bank (AIIB) on the worldwide financial system, how it essentially is designed to displace the U.S./Western-controlled IMF & the World Bank
- "This is a huge coup for China, and probably the most obvious sign yet that the global financial system is in for a giant reset. Under the weight of nearly incalculable debt and liabilities, the United States is in terminal decline as the dominant superpower
- Everyone else in the world seems to get it .. except for the U.S. government -
- They act as if the financial universe will revolve around America forever—that they can print money, indebt future generations, and wage war as much as they want without consequence
- But they’re completely blind .. Practically the entire world is lining up against them to form a brand new financial system that is no longer controlled by the U.S. government."
- References an editorial in the Financial Times in which even former U.S. Treasury Secretary Larry Summers sums it up by saying "this may be remembered as the moment the United States lost its role as the underwriter of the global economic system."
Sovereign Man tries to describe the magnitude of what is happening:
"The consequences of this shift away from a U.S.-controlled financial system cannot be understated. No more endless spending. No more solving problems with more debt and more money printing. Suddenly it will be time for painful decisions in the U.S.—like slashing Social Security benefits, drastically scaling back the military, and selectively defaulting on the debt." |
04-07-15 |
GLOBAL RISK
GEO-POL
GOVERNANCE
AIIB |
11 - Global Governance Failure |
GLOBAL RISK -Asian Infrastructure Investment bank challenges U.S. supremacy
Asian Infrastructure Investment bank challenges U.S. supremacy 03-31-15 John Browne, Special to Financial Post
“The big blow came in mid-March when the United Kingdom decided to join”
Over the past few decades while the economic power of the Chinese has grown exponentially, many observers have been surprised by the relative willingness of China to operate within the financial and economic framework established by the dominant Western order. But it should now be blatantly clear that Beijing prefers to act slowly, deliberately and quietly to advance its agenda.
This is the case with the establishment of the Asian Infrastructure Investment Bank (AIIB), a Chinese-led lending institution which could emerge as an international rival to the World Bank and the International Monetary Fund. Such an institution could support Beijing’s political interests by controlling the flow of infrastructure financing that is vital for developing economies. As we all know, money can often buy loyalty.
Currently the regional infrastructure lending in Asia is led by the Asian Development Bank (ADB), modeled after the U.S.-dominated World Bank. Founded in the 1960s and headquartered in the Philippines, the ADB is headed by a Japanese appointee who enjoys the support of a 25% U.S./Japanese block vote, dwarfing China’s 6 percent. But according to 2013 figures from the World Bank, and excluding the European Union’s GDP of $17.5-trillion, China’s GDP, at $9.2-trillion, now is second only to that of the U.S. with $16.8-trillion. It should have been clear that China would not accept such relegation indefinitely.
In October of last year China and India led 19 other Asian and Middle Eastern nations in the formation of the AIIB, which was initially capitalized with more than $50-billion. The United States, angry at what it perceived as a clear threat to its domination, supported by European and Japanese interests, leaned heavily on its allies not to join. Notably absent from the AIIB launch celebrations were the important Asian nations of Australia, Japan and South Korea, all very close allies of the U.S. However, once China decided to yield veto power, some Western interests appear to have reconsidered their opposition.
The big blow came in mid-March when the United Kingdom (despite its “special relationship” with the United States) decided to join. This in turn encouraged other powerful EU nations, including Germany, France and Italy, to jump in as well. On March 26th, even South Korea joined, bringing the total AIIB membership to 37 nations, including nine non-regional countries. This clear move to support China’s campaign for greater regional power left the United States notably isolated. In response to the decision from London to lend its support, a U.S. government official told the Financial Times, “We are wary about a trend toward constant accommodation of China, which is not the best way to engage a rising power.”
The strength of support for the AIIB could be another step towards the “de-dollarization” that many expect to be the endgame of Chinese economic policy. The loss of the U.S. dollar’s coveted position as the international reserve currency would be a direct threat to America’s ability effectively to set world interest rates and to create seemingly limitless fiat dollars without the need to finance them in free markets. The AIIB represents one more indication that the “old” order of dollar hegemony may be nearing an end.
The ADB argues that there is an $8-trillion infrastructure gap in Asia and that investment there will yield true economic growth and wealth creation. However, the Japanese fear that China will try to tie and even annex Asian countries via a network of strategic pipelines, railways and roads. In all likelihood, China may use the newly established AIIB to do just that.
Under President Obama, America is appearing weak on many fronts, including defense and monetary affairs. Already a combination of Obama’s apparently inept foreign policy has led Chancellor Merkel of Germany to take a different posture over the Ukraine, exposing a potentially damaging split in the vitally important and longstanding NATO alliance. By leaning on its allies publicly, but ultimately ineffectively, to resist China’s AIIB overtures, Obama has exposed another level of increasing diplomatic and monetary weakness.
Clearly, the Obama Administration was angered by the UK’s reversal. Patrick Ventrell, a spokesman for the National Security Council, told CNNMoney that the White House had “concerns” over whether the AIIB will meet “high standards, particularly related to governance, and environmental and social safeguards.” He added, “This is the UK’s sovereign decision. We hope and expect that the UK will use its voice to push for adoption of high standards.”
It appears that de-dollarization is progressing slowly but surely, with the formation of the AIIB being just a single but important and highly visible step in that process.
John Browne, Senior Economic Consultant to Euro Pacific Capital.
|
04-07-15 |
GLOBAL RISK
GEO-POL
GOVERNANCE
AIIB |
11 - Global Governance Failure |
| TO TOP |
| MACRO News Items of Importance - This Week |
GLOBAL MACRO REPORTS & ANALYSIS |
|
|
|
US ECONOMIC REPORTS & ANALYSIS |
|
|
|
| CENTRAL BANKING MONETARY POLICIES, ACTIONS & ACTIVITIES |
|
|
|
|
|
|
|
| Market |
| TECHNICALS & MARKET |
|
|
|
| STUDIES - STOCK versus FLOW versus PRICE |
|
|
|
VALUATION STUDY - Stock versus Flow versus Price
Stock-Flow Accounting and the Coming $10 Trillion Loss in Paper Wealth 04-06-15 John P. Hussman, Ph.D.
Many of the misconceptions that investors hold about the economy and the financial markets can be clarified by understanding the relationship between the “flow” and “stock” of various quantities in the economy.
Before going further, let's take a minute for some background. The total quantity of currency and bank reserves in the economy – what’s known as the “monetary base” – is uniquely determined by the Federal Reserve, and is equal to the stock of Treasury and mortgage securities on the Fed’s balance sheet. Once the Fed creates a dollar of monetary base (which the Fed does by purchasing a government security and paying for it with Fed-created base money), that dollar remains in the form of base money until that dollar is retired by the Fed. Monetary base is retired when the Fed sells a government security, or receives payment at maturity. In both cases, the assets on the Fed’s balance sheet are reduced by the amount of government securities it no longer owns, and the liabilities on the Fed’s balance sheet are reduced by the amount of base money it takes back in. To see that a dollar bill is a liability of the Fed, read the top line of any bill in your pocket.
Again, base money, once created, cannot take another form. It must remain in the form of either currency or bank reserves, and must be held by someone in the economy at every point in time. From a “flow” perspective, it can only change hands until it is retired. One can use it to buy something else – stocks, bonds, apple pie, chinchillas – but the base money simply changes hands and becomes the property of the seller. It doesn’t “go into” stocks, bonds, apple pie, or chinchillas – unless the cash is actually baked in the pie or eaten by the chinchilla.
The same is true more generally. Every security that someone views as an asset is also a liability to someone else in the economy. Every share of stock that is issued must be held by someone in the economy, in the form of a stock certificate, until that stock is retired. Every bond that is issued must be held by someone in the economy until that bond is retired. In aggregate, stocks can’t “go into” bonds. Cash can’t “go into” stocks. Bonds can’t “go into” cash. They are all pieces of paper that remain in the form in which they have been created until they are retired by the issuer.
So how does the total volume of securities in the economy ever change? Simple. Securities are evidence of something very specific: the past saving of one person that is transferred (intermediated) to someone else. Securities are evidence that somebody earned money, had the option of spending it on consumption, and decided instead to save it and transfer it for use by another economic participant. New securities are created in the economy each time some amount of purchasing power is transferred to others, rather than consuming it.
Decker, Bessie, Joe and you
Consider a simple economy. You use wood from your back yard to produce lumber, which you sell to Decker for $100 of currency (which Decker holds as evidence of past saving he has done). At the same time, Bessie produces milk on her farm, which she sells to Joe. But Joe needs currency to pay Bessie, and instead has a few shares of stock (which embody past saving that Joe has done). At current prices, Joe can get $100 by selling one share of stock to you in exchange for your currency. He then pays Bessie for the milk, and drinks it. Bessie is a cash cow, and adds the $100 to her stack of currency that embodies her past saving. We can assume that there are many others in the economy who have currency, stocks, and bonds that embody their past saving, but we don’t need to name them for this example. On the security side, you now own $100 of stock that used to be held by Joe, and Bessie has $100 of currency that used to be held by Decker.
On the real side, the economy has produced $200 of wood and milk, but only $100 of that output has been consumed. So there’s $100 of new saving in the economy. On balance, you and Bessie produced without consuming, and Joe consumed without producing, so you and Bessie are the savers, and Joe is the dissaver in the current period. Given $100 of overall saving, there must be $100 of new real investment. Who’s got it? Decker, in the form of unused wood inventory. Decker has neither produced nor consumed – he’s just traded his prior saving for current investment. Has there been any new security issuance? No, because neither you nor Bessie has intermediated your savings for someone’s use. The stock trade just represented existing securities changing hands.
Now suppose that Decker uses the wood to build a small stairway for a government building, for which he sends a bill to Uncle Sam for $150. If the government goes into deficit to pay that bill, it has to sell $150 worth of bonds to someone, in return for $150 of currency. Who has currency? Bessie, and she uses $150 of currency to buy $150 of freshly printed Treasury bonds. The government uses the $150 of currency to pay Decker. If you account carefully, the whole set of transactions has now produced $150 of real investment (the stairs) on balance, so the economy must have produced $150 in net new saving: your $100 and Decker’s unspent $50 profit. Yet in this case, $150 of new securities have been created in the economy, while there were no new securities created in the previous paragraph. That may not make sense until you realize that that’s the amount of savings that Bessieintermediated to the government. The net acquisition of securities is still zero, because the bonds that Bessie counts as an asset are the same bonds that the government counts as a liability.
If the Fed now launches QE, it does so by purchasing Treasury securities from Bessie, and paying for them with newly printed currency or crediting Bessie’s bank account with reserves (base money). Does that inject new purchasing power into the economy? No, it does not. It just changes the form of government liabilities held by the public, from bonds to base money. Is Bessie more likely to consume just because her savings take the form of cash instead of bonds? No – not if she didn’t have spending plans already, and not unless the economy was otherwise constrained by a lack of currency.
Now, there’s a central issue we have yet to address, which relates to changes in the value of existing securities. Once issued, all of these pieces of paper can vary in price later, so the saving that someone did in a prior period,embodied in the form of some paper security, may be worth more or less consumption in the current period than it was initially. That’s really the main effect QE has – to encourage yield-seeking speculation that drives up the prices of risky securities, but without having any material effect on the real economy or the underlying cash flows that those securities will deliver over time.
For now, keep in mind that money doesn’t go “into” the stock market – it goes through it from a buyer to a seller. The resulting price changes are purely changes in the relative value that people place on these pieces of paper, and amount to changes the amount of “paper wealth” in the economy. These changes should emphatically be distinguished from the real wealth of the economy, and the underlying stream of cash flows that will be generated over time. The relationship between those two quantities – between the price of the piece of paper and the underlying stream of deliverable long-term cash flows – tells us about valuation and probable long-term investment returns (even if speculative factors play a role in driving paper wealth over the shorter term). We’ll cover those valuation issues shortly.
The wealth of a nation is its accumulated stock of real investment, human capital, and resources
So far, we’ve established that every security that is issued must be held by someone in the economy, in the form that it was issued, until that particular security is retired. Now let’s think about the “real” side of the economy – goods and services.
When output is produced in the economy, it has one of two fates. Either the output is consumed, or it isn’t. Those goods that are not consumed are called “real investment,” and may represent capital goods, machines, factories, housing, or just unplanned inventory buildup. Though the national income statistics don’t capture it, we can also think of some services that are produced and not fully “consumed” in the same period – the primary example being education. All of this real investment can depreciate as it is consumed over time, which occurs as machines wear out or education is forgotten or goes unused. But used productively, that real investment is also the basis of national wealth.
If one carefully accounts for what is spent, what is saved, and what form those savings take (securities that transfer the savings to others, or tangible real investment of output that is not consumed), one obtains a set of “stock-flow consistent” accounting identities that must be true at each point in time:
1) total real saving in the economy must equal total real investment in the economy;
2) for every investor who calls some security an “asset” there is an issuer that calls that same security a “liability”;
3) the netacquisition of all securities in the economy is always precisely zero, even though the gross issuance of securities can be many times the amount of underlying saving; and perhaps most importantly,
4) when one nets out all the assets and liabilities in the economy, the only thing that is left – the true basis of a society’s net worth – is the stock of real investment that it has accumulated as a result of prior saving, and its unused endowment of resources. Everything else cancels out because every security represents an asset of the holder and a liability of the issuer.
Conceptualizing “saved or unconsumed resources” as broadly as possible, the wealth of a nation consists of its stock of real private investment (e.g. housing, capital goods, factories), real public investment (e.g. infrastructure), intangible intellectual capital (e.g. education, inventions, organizational knowledge and systems), and its endowment of basic resources such as land, energy, and water. In an open economy, one would include the net claims on foreigners (negative, in the U.S. case). Understand that securities are not net economic wealth. They are a claim of one party in the economy – by virtue of past saving – on the future output produced by others.
Because the surplus of one economic sector must be identically equal to the sum of deficits across all other sectors, the net funds available to acquire financial assets across the economy as a whole (including net flows from abroad), will always be precisely zero. However, each sector taken separately will acquire net financial assets, or issue net financial liabilities, equal to that sector’s saving or deficit (the difference between the sector’s income and its spending). The importance of stock-flow consistent economic accounting was well-recognized by many economists sometimes dubbed the “New Cambridge” school (Godley, Cripps, Kaldor, Kalecki, and Tobin among others) but stock-flow consistency is rarely taught in economics courses, largely because the models often include additional arbitrary decision-making rules (like Keynes’ simplistic consumption function) that aren’t based on rational choice or optimization. Instead, mainstream academic models often exclude the financial sector completely, and include money as if it were simply dropped from the sky.
The failure to recognize that stock-flow consistency must hold in the economy and the financial markets is the basis for an enormous amount of misunderstanding in both fields. That omission of clear thinking about the link between economics and finance contributes to misguided policies that ignore the impact of financial distortions on the real economy, and invite speculation, malinvestment, and ultimately financial crisis.
Valuation: the link between financial prices and real economic flows
All securities are essentially a way to trade current saving for a claim on future output. The value of all the securities in the economy derives from the claim on future output that this stock of real and intellectual capital can generate over time. During speculative bubbles and periods of malinvestment, saving is invested in unproductive projects that essentially result in unintended consumption rather than accumulation of productive assets. This means that the stock of outstanding securities is essentially “backed” by a smaller stock of productive capital to service those securities over time.
This point is fundamental, because it is part of the reason the U.S. economy has been failing much of its population. The economic policies we’ve pursued have put a premium on current consumption and have encouraged yield-seeking speculation, while discouraging saving and productive investment in both the private and public sectors. For more on why this emphasis on debt-financed consumption is central to our economic challenges, see Eating Our Seed Corn: The causes of U.S. economic stagnation, and the way forward.
Yield-seeking speculation promoted by the Fed’s zero interest rate policy has done two things: On the real side of the economy, this policy has discouraged saving, while channeling what saving that does occur into increasingly speculative areas of the economy – witness the enormous issuance of junk debt and leveraged loans to already highly-indebted borrowers in recent years, as investors clamored for a “pickup” in yield over safer investments.
On the financial side, this yield-seeking has dramatically elevated the prices of existing securities, but with far less expansion in the stock of real, productive capital underlying those investments. When one compares the value of U.S. equities to corporate net worth, one observes the ratio (Tobin’s Q) beyond the extremes of 1907, 1929, 1937, 1972, and 2007 – with greater overvaluation evident only at the 2000 peak.
The Fed has been attempting to create a “wealth effect” driven by yield-seeking speculation, despite no empirical evidence that consumption responds significantly to changes in volatile assets like stocks – Friedman and Modigliani were right. Instead, QE does little but to encourage yield-seeking speculation that temporarily enhances the distribution of paper wealth toward the holders of risky securities. Still, turning this paper wealth into a claim on real output requires that existing holders cash out at those elevated valuations and pass the bag to someone else. Fortunately or unfortunately, the holders of risky assets have come to believe that elevated valuations are permanent and reliable, so as in 2000 and 2007, we expect the majority of holders to simply continue holding the bag as valuations retreat over the completion of the market cycle. Technically, most holders will have to, because the ability to exit at current prices requires some new buyer to take the bag. My impression is that the sideways churning we've observed in the broad market since last July (see the NYSE Composite for example) has represented just that sort of "distribution" process.
One might like to imagine that valuations are fine because corporate profits and profit margins have been at record levels in recent years. But this ignores that the source of that corporate surplus has been an unusual set of deficits in the government and household sectors, which have persisted for several years, but are already narrowing, and are unlikely to persist for five decades. When one recognizes that stocks are 50-year duration assets, and are a claim on decades of future cash flows (not just next year’s earnings, or even the next 3-5 years), it should be clear why the most historically reliable valuation measures, by far, are those that adjust for variations in profit margins over the economic cycle (see Margins, Multiples, and the Iron Law of Valuation).
Valuation measures that mute the year-to-year volatility of profit margins and earnings typically have the strongest correlation with actual subsequent S&P 500 total returns over the following 7-10 year period. The following chart shows the inverted ratio of market capitalization to GDP (left scale, log – lower levels represent richer valuation) compared with the actual subsequent 10-year total return of the S&P 500 (right scale). As I’ve frequently noted, periodic “errors” between actual 10-year returns and those that would have been projected a decade earlier are actually highly informative about current valuations (see Do the Lessons of History No Longer Apply?).
Market capitalization to GDP (one of the best stock/flow valuation indicators, in terms of predictive correlation) is quite close to the 2000 extreme, while Tobin’s Q is somewhat less extreme because corporate net worth is increasingly dominated by financial assets that boost the denominator of Q during periods of overvaluation. Regardless of which measure on uses, however, U.S. equity valuations are on the high side of obscene.Everything we observe from reliable valuation measures indicates that the S&P 500 Index is likely to belower a decade from now than it is today, though based on a broad range of reliable measures, we currently expect the total nominal return, including dividends, to be slightly positive at about 1.6% annually.
Creating a more vulnerable financial system
As indicated above, when we examine both the net worth of U.S. corporations and the net worth of U.S. households, both have become gradually dominated by paper assets instead of real ones. This is of significant economic concern.
Financial assets now represent over 82% of the net worth of both households and U.S. non-financial corporations (Data: Federal Reserve Z.1 Flow of Funds). Except for periods where total net worth had itself retreated (for example, 2008-2010), the concentration of private net worth on financial assets, rather than real assets or productive capital, has reached the highest extreme in history in recent years. In our view, this is just temporarily overvalued paper masquerading as something durable. The previous extreme – again, outside of periods where net worth itself had retreated – was not surprisingly in Q1 of 2000. We are rather helpless observers to this, as we were prior to the last financial crisis, and as we were prior to the technology collapse – despite the same conviction each time that the imbalances and elevated valuations would end badly.
There a strong correlation between private net worth and U.S. market capitalization. Examining the data, we find that the change in private net worth per dollar of change in U.S. market cap is actually about 1.5. That means that stocks have not only a direct impact on total private net worth, but an indirect effect, as many privately held assets such as corporate debt and junk bonds are also correlated with stock price fluctuations. At about $23 trillion in U.S. non-financial equity market capitalization, and over $100 trillion in total U.S. private net worth, a standard, run-of-the mill bear market decline in stocks on the order of 30% would likely be associated with totalpaper losses in the private sector on the order of $10 trillion.
Meanwhile, much has been made about “cash on the sidelines” held by corporations, where the sum of currency, bank deposits and foreign deposits of U.S. nonfinancial corporations has surged by $700 billion since 2008. What’s typically left out of this observation is that the debt of those same corporations has surged by $1.5 trillion over the same period. As my friend Albert Edwards and his colleagues have demonstrated, much of this debt issuance has been used to finance stock repurchases instead of expanding investments in productive capital. While this process may feel right in an environment of low interest rates and a belief in permanently rising stock prices, it has made corporate balance sheets much more vulnerable to debt refinancing risk down the road, particularly if earnings fall short or credit spreads rise as they have in prior cycles.
Of permabears and permabulls
People often like the idea of being part of an exclusive club, sometimes the more exclusive the better. As Groucho Marx put it, “I’d never join a club that would have me as a member.” With the percentage of bearish investment advisors recently plunging to just 14%, investment bears are certainly a rather exclusive group, mostly representing advisors who are considered “permabears.”
What’s odd is how little affinity I feel with members of that group. Though I seem to be one of the better-identified members, those who actually understand our narrative in recent years should recognize that I stumbled into this clubhouse quite unintentionally. The fact is that I’ve become constructive or aggressively bullish after each bear market retreat in the past quarter century. The main difficulty began with my 2009 insistence on stress-testing our methods against Depression-era data, which cut short our late-2008 turn to the constructive side (see Why Warren Buffett is Right and Why Nobody Cares). I continue to view that decision as a fiduciary necessity (as 2009-like valuations were followed, in the Depression, by another two-thirds loss in the market), but it was unfortunately timed. In hindsight, I wish I could have made that decision in 2007, when we became convinced of an impending collapse in the first place. Our awkward transition in the period from 2009 to mid-2014 had a great deal to do with knock-on effects from that stress-testing decision. The full narrative is readily available. See in particular Hard Won Lessons and the Bird in the Hand, and A Better Lesson than “This Time is Different.”
Still, ask the following question: Under what conditions have we been notably out of sync with the market for an extended period of time? The answer is simple: when valuations were elevated on a historical basis, but when both the uniformity of market internals and the behavior of credit spreads were still measurably favorable. Have we addressed that distinction in our present methods? Yes.
Ask the following question: Under what conditions have we been most correct in expecting wicked market losses? The answer again is simple: when valuations were rich and market conditions were overbought and overbullish, but when the uniformity of market internals and/or the behavior of credit spreads had also become unfavorable on our measures.
Ask the following question: Under what conditions have we been most correct about an aggressive outlook (as I encouraged after the 1990 bear market low, which helped to establish my reputation as a “lonely raging bull” earlier in my career) or constructive outlook (as I encouraged after the 2000-2002 collapse)? The answer is simple: when valuations had materially retreated and the uniformity of market internals and the behavior of credit spreads had become measurably favorable.
My hope is that the pattern is clear. For more on that central lesson, which was embedded in our pre-2009 methods, was not sufficiently captured in the methods that resulted from our 2009-2010 stress testing, and – after a challenging transition – are again embedded in our present methods of estimating market return/risk profiles, see A Most Important Distinction.
There is a problem with both permabears (among whom I feel decidedly misclassified) and permabulls (who would never call themselves that, preferring instead to extol the virtues of buy-and-hold, but who rarely advise investors to consider their investment horizon and risk tolerance, or to temper their expectations about future returns when valuations are elevated). The problem is that the evidence and analysis presented by each side is typically so darned thin. One would think that credible investment outlooks should be based on a healthy dose historical evidence and clear explanation of economic and accounting relationships that lead to a particular conclusion. Instead, both permabulls and permabears tend to cite statistics of various sorts without demonstrating that they have any systematic relationship with actual subsequent market returns.
My sense is that those who casually dismiss historically reliable evidence by appealing to our awkward transition – despite having admitted, addressed, and explained the challenges and lessons of that period – are likely to experience outcomes similar to those investors experienced following similar conditions in 1929, 1937, 1972, 1987, 2000 and 2007. If market internals and credit spreads improve, our immediate concerns about downside risks will be deferred. As I’ve emphasized in recent months, that won’t make obscene valuations any less extreme, but that sort of shift in market action would be indicative of a shift toward fresh risk-seeking by investors, and would encourage an investment outlook that might best be characterized as “constructive with a safety net.”
Meanwhile, the S&P 500 has posted annual nominal total returns of less than 4% annually since 2000, has posted those returns only because of a return to historically extreme valuations and recent record highs, and has lost half of its value on two separate occasions in the interim. To the extent that one was to choose to be a permabear, this would still be one of the best 15-year periods in history to have done so. I expect that by the completion of the present market cycle, most likely over the next couple of years, the period since 2000 will turn out to be uniquely the best span in history since the Great Depression to have been a “permabear” anyway.
As always, our investment horizon is focused on the complete market cycle. We have no intent of dissuading disciplined buy-and-hold investors from their discipline, but only encourage that you ensure your overall portfolio allocation is consistent with your investment horizon and actual risk tolerance (which you should test by asking whether a bear market loss on the order of 30-55%, commensurate with current evidence and historical precedent, would disrupt your financial security enough to force you to abandon your discipline after the fact). Provided that you’re well diversified in assets that aren’t actually highly correlated, and you’ve carefully considered your investment horizon and risk tolerance, we fully encourage adhering to patient and historically informed disciplines – even if we might disagree about when the present market cycle may be completed.
The foregoing comments represent the general investment analysis and economic views of the Advisor, and are provided solely for the purpose of information, instruction and discourse. Please see periodic remarks on the Fund Notes and Commentary page for discussion relating specifically to the Hussman Funds and the investment positions of the Funds.
|
04-08-15 |
STUDY |
|
| COMMODITY CORNER - AGRI-COMPLEX |
|
PORTFOLIO |
|
| SECURITY-SURVEILANCE COMPLEX |
|
PORTFOLIO |
|
|
|
|
|
| THESIS - Mondays Posts on Financial Repression & Posts on Thursday as Key Updates Occur |
| 2015 - FIDUCIARY FAILURE |
2015 |
THESIS 2015 |
 |
| 2014 - GLOBALIZATION TRAP |
2014 |
|
|
2013 - STATISM |
2013-1H
2013-2H |
|
|
2012 - FINANCIAL REPRESSION |
2012
2013
2014 |
|
|
FINANCIAL REPRESSION - More Unofficial Capital Controls: PFIC Rules
More Unofficial Capital Controls: PFIC Rules International Man's Nick Giambruno
It ranks at the very top of potential tax nightmares, especially if you invest internationally.
This nightmare could become a reality if you happen to invest in what the IRS deems a Passive Foreign Investment Company (PFIC), which are taxed at exorbitant rates and have highly complex reporting rules. Most foreign mutual funds are PFICs, as are certain foreign stocks.
It’s not illegal to invest in a PFIC, but practically speaking, the costs of doing it are so incredibly onerous that it’s prohibitively expensive in the vast majority of cases.
PFIC rules amount to unofficial restrictions on investing in certain foreign assets and are yet another indicator of the disturbing trend of creeping capital controls in the US.
Capital controls are used by many countries and come in all sorts of shapes, sizes, and labels. The purpose, however, is always the same: to restrict and control the free flow of money into and out of a country so that the politicians have more wealth at their disposal to plunder.
What Is a PFIC Investment?
As always, it’s important to first define our terms.
As far as the IRS is concerned, passive income includes income from interest, dividends, annuities, and certain rents and royalties.
If a foreign corporation or investment vehicle meets either of the two conditions below, it will be deemed to be a PFIC.
1) If passive income accounts for 75% or more of gross income, or
2) 50% or more of its assets are assets that produce passive income.
If you own a foreign mutual fund—even a cash management fund—it probably qualifies as a PFIC. But it’s not just foreign mutual funds; it can be any foreign stock that meets either of the above conditions as well.
Bottom line: even the simplest international investments can create significant tax problems.
(Clarification: an offshore LLC that makes an election to be classified as a disregarded entity or a partnership is not a PFIC.)
What Are the PFIC Rules?
To say the consequences of owning a share in a PFIC are severe would be an understatement.
First, the complexity of the PFIC rules are way out of league for TurboTax or your average tax preparer. You’ll need the assistance of a specialist, and lots of it. The IRS estimates it takes up to a stunning 30 hours of tax preparation time to complete Form 8621, which needs to be filed for each PFIC every year. It’s an incomprehensible waste of human and financial capital that could otherwise go to productive use.
Regardless of whether or not it proves to be a good investment, it’s hard to imagine a situation where the benefit of holding a PFIC outweighs even the cost of reporting it.
But let’s say an investor is willing to pay the ridiculous cost of reporting and the PFIC does prove to be a good investment. In this case, unless the investor makes one of the elections explained below, he suffers the following punitive tax rates and special rules:
- For any year in which you receive a dividend or sell any PFIC shares, you face a complex calculation that involves prorating the PFIC’s return over your entire holding period and applying an interest charge. In contrast to the bizarrely complicated PFIC rules, capital gains tax for other investments are relatively simple to calculate and are only due when the gain is realized through a sale.
- Most capital gains are taxed at a top federal rate of 20%, plus the Obamacare surcharge of 3.8%, for a total of 23.8%, which is favorable compared to the top ordinary federal income tax rate of 39.6%. Capital gains in PFICs, however, are effectively taxed at the highest ordinary income rate plus the interest charge mentioned above. The tax and interest due can eat up 70% or more of your gain.
- A capital loss on a PFIC can’t be used to offset capital gains on other investments.
Until recently, PFIC rules were weakly enforced.
But that’s all changed now, thanks to the Foreign Account Tax Compliance Act (FATCA), which forces every single financial institution on the planet to submit information on their American clients to the IRS. This puts more information at the US government’s fingertips than ever before, including information about PFICs.
Fortunately, there are a couple of ways out, though they aren't ideal.
First, if the PFIC meets certain accounting and reporting requirements, the US investor can elect to treat the PFIC as a Qualified Electing Fund (QEF), which eliminates the punitive tax rates. In practice, you can’t count on a PFIC to provide the information you would need. And even if it does, you would be taxed on your share of its income and gains year by year, even if you didn’t receive any dividends.
Second, generally speaking, there is an exemption from PFIC reporting if PFIC holdings do not exceed $25,000 ($50,000 for married couples filing jointly).
Third, if you hold a PFIC through an IRA or other certain retirement accounts, you may be exempt from Form 8621 filing requirements.
With the complexity and unfavorable tax rates that come with them, it is clearly better to avoid owning PFICs over the exempt amount in non-retirement accounts when looking to invest offshore.
(This is not to be construed as tax, investment, or legal advice. As always, discuss your situation with a qualified advisor.)
Conclusion
Taking a step back and looking at the big picture, it’s clear the PFIC rules are part of the long-term trend of the US government using burdensome regulations to effectively shrink the number of options available for those seeking to diversify internationally. These roadblocks are a clue as to how desperate and bankrupt it really is.
You shouldn’t be deterred, as that is exactly what the politicians want to happen. They prefer your savings remain within their immediate reach so that it’s easier to fleece. Instead of being deterred, you should be emboldened to act to protect yourself before the window of opportunity fully shuts. You do not want to be like a sheep that has been penned in for a shearing. If you consult with a tax professional and comply with all of your obligations, you should have nothing to worry about.
Fortunately, there are still many practical international diversification strategies available to you, including some that you can do from your own living room. You’ll find the latest information on the best of these proven strategies—including how to avoid common pitfalls, like running afoul of the PFIC rules, and trusted professionals to assist with your tax filings—in our Going Global publication.
|
04-06-15 |
THEMES |
FINANCIAL REPRESSION

|
2011 - BEGGAR-THY-NEIGHBOR -- CURRENCY WARS |
2011
2012
2013
2014 |
|
|
2010 - EXTEND & PRETEND |
|
|
|
| THEMES - Normally a Thursday Themes Post & a Friday Flows Post |
I - POLITICAL |
|
|
|
| CENTRAL PLANNING - SHIFTING ECONOMIC POWER - STATISM |
G |
THEME |
|
| - - CORPORATOCRACY - CRONY CAPITALSIM |
|
THEME |
|
- - CORRUPTION & MALFEASANCE - MORAL DECAY - DESPERATION, SHORTAGES. |
|
THEME |
|
| - - SECURITY-SURVEILLANCE COMPLEX - STATISM |
M |
THEME |
|
| - - CATALYSTS - FEAR (POLITICALLY) & GREED (FINANCIALLY) |
G |
THEME |
|
II-ECONOMIC |
|
|
|
| GLOBAL RISK |
|
|
|
| - GLOBAL FINANCIAL IMBALANCE - FRAGILITY, COMPLEXITY & INSTABILITY |
G |
THEME |
|
| - - SOCIAL UNREST - INEQUALITY & A BROKEN SOCIAL CONTRACT |
US |
THEME |
|
| - - ECHO BOOM - PERIPHERAL PROBLEM |
M |
THEME |
|
| - -GLOBAL GROWTH & JOBS CRISIS |
|
|
|
| - - - PRODUCTIVITY PARADOX - NATURE OF WORK |
|
THEME |
MACRO w/ CHS |
| - - - STANDARD OF LIVING - EMPLOYMENT CRISIS, SUB-PRIME ECONOMY |
US |
THEME |
MACRO w/ CHS |
III-FINANCIAL |
|
|
|
| FLOWS -FRIDAY FLOWS |
MATA
RISK ON-OFF |
THEME |
|
FLOWS - Liqudity, Credit & Debt
Drowning In Liquidity But None In The Bond Market: The Spark Of The Next Financial Crisis? 03-22-15 Zero Hedge
Of all the themes we’ve been pounding the table on of late, the idea that a lack of liquidity in certain markets will eventually lead to an “accident” or “adverse event” (to use the Center for Financial Stability’s words) is perhaps the most pressing because with the Mario Draghis and Haruhiko Kurodas of the world intent on monetizing every bit of government paper they can get their hands on, “outlier” events such as the Treasury flash crash that occurred last October are likely to become far less outlier-ish as central banks discover that depriving the market of anything that even approximates high quality collateral can have a rather nasty destabilizing effect in a pinch. Two weeks back, we summarized the situation as follows:
As central banks work to monetize all net (and sometimes gross) government bond issuance in their respective jurisdictions,
QE is destabilizing markets by sapping liquidity which in turn inhibits price discovery and creates volatility.
This is on display in Japan, where 2 out of 3 dealers think the JGB market is impaired thanks to BoJ asset purchases and where many officials are beginning to get more vocal about the possibility that a lack of liquidity could have “dire consequences.” Similarly,
market financing via shadow banking conduits has declined by nearly half since 2008 in the US,
and
with dealers unwilling to hold inventory of corporate paper thanks to tougher capital requirements,
the stage is set for what the Center for Financial Stability recently called “an accident.” Here’s what the SEC's Daniel Gallagher had to say recently about liquidity in the US corporate bond market (via Bloomberg):
"Lack of liquidity in corporate bond market is 'systemic risk' not addressed by regulators, SEC Commissioner Daniel Gallagher says in public remarks. Gallagher cites 80% decline in corporate bond inventories among dealers and impact of higher interest rates on future trading needs; 'that has accompanied a record level of issuance year after year since 2008 of $1 trillion-plus of corporate debt.'"
Building on this theme, we went on to highlight a UBS note which analyzed Fed rate hiking cycles for clues as to what the market should expect in terms of corporate spreads if and when a “diminutive” Janet Yellen decides to go ahead with a “liftoff.” What UBS found was rather disconcerting:
Historical parallels and correlations of spreads to shifts in monetary policy expectations can find environments where Fed tightening equates to spread widening. But aside from the direct linkages of rates to spreads, a more fundamental concept is at play. The economic cycle and asset price cycle have diverged, with asset prices looking more like 1999 than either 1994 or 2004...
...the late 1990s and late 1960s demonstrate that a higher Fed Funds can lead to wider spreads in the context of a strong economy, high asset prices, and a lengthened economic cycle.
The key takeaway is that recent short-term shifts in monetary policy alter risk premia more than expectations of credit fundamentals, leading to positive correlation spikes. The current divergence between market implied pricing of Fed Funds vs. Federal Reserve forecasts is then a clear risk for credit investors. A Fed that is more aggressive with respect to the pace of tightening will re-price credit spreads wider.
All of this led us to wonder if in fact credit market carnage lies ahead:
We are left to wonder what happens in the event UBS is correct and a Fed rate hike triggers widening corporate credit spreads in a corporate bond market devoid of liquidity. Could it indeed be the case that the Fed’s highly anticipated “lift-off” will serve as the catalyst for credit market carnage?
It now appears some market participants indeed agree with our assessment. As The Telegraph reports,
Investors across corporate bond markets are finding it harder to buy and sell company debt. And some investors are beginning to fear that the lack of liquidity will be the spark that ignites the next crisis in financial markets.
Liquidity is generally taken to mean the ease with which an investor can quickly buy or sell a security without moving its price. As regulation of banks tightens, the liquidity, particularly of European and US credit markets, has evaporated, prompting a host of regulators and central banks to sound warnings about the difficult trading environment.
A rate hike by the US Federal Reserve, which would be the first since 2006, could trigger turmoil. Given the bond market is much larger than the equity market, and investors have piled into fixed income in recent years, fears are growing that when credit investors attempt to sell bonds en masse, the illiquidity in the market has the potential to cause a crisis of a similar magnitude to the credit crunch.
We concur and we would also like to take this opportunity to point out that this is a shining example of how a number of the “New Paranormal” themes we’ve been discussing of late all fit together. A worldwide effort to resurrect a global financial system dying of leverage-related injuries and a global economy teetering on deflation ended up centering on the wholesale purchase of bonds, which in turn drove down borrowing costs and simultaneously sapped liquidity. Corporates, lured by rock-bottom rates, began borrowing in record amounts even as new regulations aimed at promoting stability ended up discouraging banks from serving their traditional role as middlemen, causing liquidity in the secondary market to evaporate just as companies began issuing a record amount of debt. Meanwhile, HY rates began to look more like IG rates thanks to central bank largesse, which had the unfortunate effect of allowing insolvent companies to remain solvent by borrowing more money, contributing to overcapacity and ultimately, disinflation. Coming full circle, the combination of monetary policy and regulation that was intended to rescue the market from deflation and make the financial system safe from collapse has ironically ended up creating … wait for it … deflation and instability. Here’s more from The Telegraph:
Similarly, the violent and unprecedented “flash crash” in 10-year Treasury yields last October was blamed on faltering liquidity. The sudden drop in yields was all the more extraordinary given Treasuries are considered to be the most liquid market in the world.
But it is the corporate bond market where worries about trading conditions are most acute. The ultra-loose monetary policies pursued by the Fed, the Bank of England and the European Central Bank has resulted in a torrent of bond issuance in recent years from companies seeking to capitalise on rock bottom interest rates.
“Now is the perfect time to borrow if you’re a company,” says Gary Jenkins, a credit strategist at LNG Capital.
European and British companies, excluding banks, sold a combined $435.3bn (£291bn) of investment-grade debt last year, and $458.5bn in 2013, according to Dealogic. The level of issuance is much greater than before the financial crisis. In 2005, for example, $155.7bn was raised from corporate bond sales and $139.8bn the year before that.
Companies issuing riskier, high-yield debt have been similarly prolific. Last year, European businesses sold $131.6bn of so-called junk bonds, up from $104.4bn in 2013, the Dealogic data show. In 2005, they issued $20.4bn.
At the same time that issuance in the primary market has grown, trading of company bonds by investors in the secondary market has dried up, a liquidity shortage that ironically has been caused by regulators’ attempts to avert a repeat of the crisis that shook the financial system in 2008.
“Bank regulation is generally a good thing, but one of the unintended consequences has been the reduction in market liquidity,” says John Stopford, co-head of multi-asset investing at Investec Asset Management. “And that could come back to haunt us. People need to be aware of that risk and be prepared for it.”
This would be funny if it weren’t so tragically ridiculous because what it all boils down to is the fact that the world’s central banks have printed some $13 trillion over the course of five years and not only has it not had its intended effect, it’s actually made things immeasurably more precarious. |
04-10-15 |
FLOWS |
FLOWS

|
| CRACKUP BOOM - ASSET BUBBLE |
|
THEME |
|
| SHADOW BANKING - LIQUIDITY / CREDIT ENGINE |
M |
THEME |
|
| GENERAL INTEREST |
|
|
|
| STRATEGIC INVESTMENT INSIGHTS - Weekend Coverage |
RETAIL - CRE
|
|
SII |
|
US DOLLAR
|
|
SII |
|
YEN WEAKNESS
|
|
SII |
|
OIL WEAKNESS
|
|
SII |
|
| TO TOP |
| |
Read More - OUR RESEARCH - Articles Below

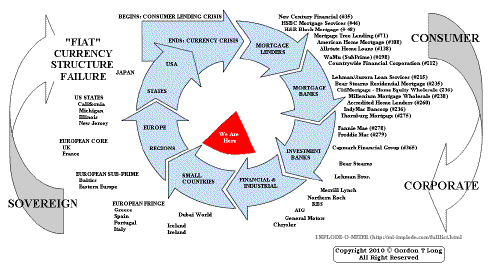
Tipping Points Life Cycle - Explained
Click on image to enlarge
 |
YOUR SOURCE FOR THE LATEST
GLOBAL MACRO ANALYTIC
THINKING & RESEARCH
|
�
|






 2015 THESIS: FIDUCIARY FAILURE
