|
JOHN RUBINO'SLATEST BOOK |
|||||||||||||||||||||||||||||||||||||||||||||||||||||||||||||||||||||||||||||||||||||||||||||||||||||||||||||||||||||||||||||||||||||||||||||||||||||||||||||||||||||||||||||||||||||||||||||||||||||||||||||||||
"MELT-UP MONITOR " Meltup Monitor: FLOWS - The Currency Cartel Carry Cycle - 09 Dec 2013 Meltup Monitor: FLOWS - Liquidity, Credit & Debt - 04 Dec 2013 Meltup Monitor: Euro Pressure Going Critical - 28- Nov 2013 Meltup Monitor: A Regression-to-the-Exponential Mean Required - 25 Nov 2013
|
"DOW 20,000 " Lance Roberts Charles Hugh Smith John Rubino Bert Dohman & Ty Andros
|
HELD OVER
Currency Wars
Euro Experiment
Sultans of Swap
Extend & Pretend
Preserve & Protect
Innovation
Showings Below
"Currency Wars "
|
"SULTANS OF SWAP" archives open ACT II ACT III ALSO Sultans of Swap: Fearing the Gearing! Sultans of Swap: BP Potentially More Devistating than Lehman! |
"EURO EXPERIMENT"
archives open EURO EXPERIMENT : ECB's LTRO Won't Stop Collateral Contagion!
EURO EXPERIMENT: |
"INNOVATION"
archives open |
"PRESERVE & PROTE CT"
archives open |

RECAP
Weekend May 31st, 2015
Follow Our Updates
on TWITTER
https://twitter.com/GordonTLong
AND FOR EVEN MORE TWITTER COVERAGE
![]()
| MAY | ||||||
| S | M | T | W | T | F | S |
| 1 | 2 | |||||
| 3 | 4 | 5 | 6 | 7 | 8 | 9 |
| 10 | 11 | 12 | 13 | 14 | 15 | 16 |
| 17 | 18 | 19 | 20 | 21 | 22 | 23 |
| 24 | 25 | 26 | 27 | 28 | 29 | 30 |
| 31 | ||||||
KEY TO TIPPING POINTS |
| 1- Bond Bubble |
| 2 - Risk Reversal |
| 3 - Geo-Political Event |
| 4 - China Hard Landing |
| 5 - Japan Debt Deflation Spiral |
| 6- EU Banking Crisis |
| 7- Sovereign Debt Crisis |
| 8 - Shrinking Revenue Growth Rate |
| 9 - Chronic Unemployment |
| 10 - US Stock Market Valuations |
| 11 - Global Governance Failure |
| 12 - Chronic Global Fiscal ImBalances |
| 13 - Growing Social Unrest |
| 14 - Residential Real Estate - Phase II |
| 15 - Commercial Real Estate |
| 16 - Credit Contraction II |
| 17- State & Local Government |
| 18 - Slowing Retail & Consumer Sales |
| 19 - US Reserve Currency |
| 20 - US Dollar Weakness |
| 21 - Financial Crisis Programs Expiration |
| 22 - US Banking Crisis II |
| 23 - China - Japan Regional Conflict |
| 24 - Corruption |
| 25 - Public Sentiment & Confidence |
| 26 - Food Price Pressures |
| 27 - Global Output Gap |
| 28 - Pension - Entitlement Crisis |
| 29 - Central & Eastern Europe |
| 30 - Terrorist Event |
| 31 - Pandemic / Epidemic |
| 32 - Rising Inflation Pressures & Interest Pressures |
| 33 - Resource Shortage |
| 34 - Cyber Attack or Complexity Failure |
| 35 - Corporate Bankruptcies |
| 36 - Iran Nuclear Threat |
| 37- Finance & Insurance Balance Sheet Write-Offs |
| 38- Government Backstop Insurance |
| 39 - Oil Price Pressures |
| 40 - Natural Physical Disaster |
Reading the right books?
No Time?
We have analyzed & included
these in our latest research papers Macro videos!
![]()
OUR MACRO ANALYTIC
CO-HOSTS
John Rubino's Just Released Book
Charles Hugh Smith's Latest Books
Our Macro Watch Partner
Richard Duncan Latest Books
MACRO ANALYTIC
GUESTS
F William Engdahl
OTHERS OF NOTE
Book Review- Five Thumbs Up
for Steve Greenhut's
Plunder!
TODAY'S TIPPING POINTS
|
Have your own site? Offer free content to your visitors with TRIGGER$ Public Edition!
Sell TRIGGER$ from your site and grow a monthly recurring income!
Contact [email protected] for more information - (free ad space for participating affiliates).
HOTTEST TIPPING POINTS |
Theme Groupings |
|||
We post throughout the day as we do our Investment Research for: LONGWave - UnderTheLens - Macro
|
||||
|
MOST CRITICAL TIPPING POINT ARTICLES TODAY
|
|
|||
| MOST CRITICAL TIPPING POINT ARTICLES THIS WEEK - May 24th, 2015 - May. 30th, 2015 | ||||
| Market | ||||
| TECHNICALS & MARKET |
|
|||
| STUDIES - MISPRICING SIGNALS | ||||
STUDY - Mispricing Signals Trannies Tumble As Death Cross Triggers 05-26-15 ZH Trannies are now down almost 8% year-to-date (and down 3.5% from the end of QE3).
Bernanke Says "No Large Mispricings In US Securities"; These 5 Charts Say Otherwise 05-24-15 ZH Retired central banker, blogger, bond guru and hedge fund consultant Ben Bernanke just uttered the following total rubbish...
In an effort to save whoever it is that will pay him $250,000 next for these wise words, we offer five charts. One of these things is not like the others... nope, no mispricing there at all... Almost imperceptible amount of mispricing here... So now "relative" mispriings at all.. How about "absolute" mispricings? Cyclically, even Yellen thinks stocks are expensive... and the median stock has never been more expensive... But apart from that - nope - no mispricing whatsoever.
|
05-27-15 | STUDIES TRANNIES |
||
| COMMODITY CORNER - AGRI-COMPLEX | PORTFOLIO | |||
| SECURITY-SURVEILANCE COMPLEX | PORTFOLIO | |||
| THESIS - Mondays Posts on Financial Repression & Posts on Thursday as Key Updates Occur | ||||
| 2015 - FIDUCIARY FAILURE | 2015 | THESIS 2015 |  |
|
| 2014 - GLOBALIZATION TRAP | 2014 |  |
||
|
2013 2014 |
||||
2011 2012 2013 2014 |
||||
| THEMES - Normally a Thursday Themes Post & a Friday Flows Post | ||||
I - POLITICAL |
||||
| CENTRAL PLANNING - SHIFTING ECONOMIC POWER - STATISM | THEME | |||
CORPORATOCRACY - CRONY CAPITALISM
Macro Watch If you have not yet joined, subscribe here:
http://www.gordontlong.com/RichardDuncan/Macrowatch.htm When prompted, use the special GordonTLong.com offer coupon code: "flows"
You will find more than 15 hours of Macro Watch videos available to watch immediately. A new video is added approximately every two weeks. |
05-28-15 | THEME |  |
|
- - CORRUPTION & MALFEASANCE - MORAL DECAY - DESPERATION, SHORTAGES. |
THEME |  |
||
| - - SECURITY-SURVEILLANCE COMPLEX - STATISM | M | THEME | ||
| - - CATALYSTS - FEAR (POLITICALLY) & GREED (FINANCIALLY) | G | THEME | ||
II-ECONOMIC |
||||
| GLOBAL RISK | ||||
| - GLOBAL FINANCIAL IMBALANCE - FRAGILITY, COMPLEXITY & INSTABILITY | G | THEME | ||
| - - SOCIAL UNREST - INEQUALITY & A BROKEN SOCIAL CONTRACT | US | THEME | ||
| - - ECHO BOOM - PERIPHERAL PROBLEM | M | THEME | ||
| - -GLOBAL GROWTH & JOBS CRISIS | ||||
| - - - PRODUCTIVITY PARADOX - NATURE OF WORK | THEME | MACRO w/ CHS |
||
| - - - STANDARD OF LIVING - EMPLOYMENT CRISIS, SUB-PRIME ECONOMY | US | THEME | MACRO w/ CHS |
|
III-FINANCIAL |
||||
| FLOWS -FRIDAY FLOWS | MATA RISK ON-OFF |
THEME | ||
FLOWS - Liquidity, Credit & Debt Why There Is No Treasury Liquidity In One Chart 05-09-15 Zero Hedge It was back in 2012 that Zero Hedge first warned about a topic that now has not only the buyside, but also prominent pundits, regulators and - ironically - even the Federal Reserve scrambling: the collapse of Treasury liquidity, manifested in the multiple-sigma, i.e. "flash crash (or smash)" moves in the What we said, and what it has taken the mainstream some 3 years to figure out, is that the primary culprit for the collapse in sovereign bond market liquidity are the central banks themselves, first the Fed, then the BOJ, and now, the ECB. Because as we noted in September 2012, "here is a snapshot of the Fed's nominal holdings by CUSIP spread by maturity. Some may be surprised that the Fed already owns 70%, or the maximum allowed without the Fed destroying all liquidity in a given CUSIP, in various issues, primarily in the 7-10 year window." Before: ... and After (as of 2012): Unfortunately, while the Fed's holdings expressed in 10 Year duration terms have so far peaked at around 35% of total, a level which many expected wouldn't be dire enough to lead to the evaporation of bond market depth also known as liquidity, what happened since then is that coupled with the surge of HFTs in bond market trading which contrary to popular opinion not only doesn't provide, but soaks up liquidity, as can be seen on the Nanex chart below... duration threshold which had previously been greenlighted by the TBAC, ended up being far too high and as a result events such as the October 15 flash smash, and the May 2015 Bund flash crash, have become a normal and regular feature of the
So in case any readers have missed our constant coverage over the past 6 years, predicting accurately not only the breaking of markets due to the advent of HFTs, but the soaking up of all market liquidity by the Fed which in its increasingly more desperate attempts to reflate assets to record levels (remember when years ago it was blashpemy to suggest that the Federal Reserve is pushing the market higher - good times) has broken the markets even further and in fact made selling virtually impossible, thus trapping all those who have put their funds into the so called market, here is the chart showing how much bond market "depth" there is, or rather isn't, as a result of 6 years of Fed central planning. The data comes courtesy of Stone McCarthy:
And here is a visual representation showing how much of the entire bond market expressed in 10 Year equivalents is now held by the Federal Reserve: a chart regular Zero Hedge users have seen consistently over the past 3 years. The chart above also explains why absent a massive debt-funded government spending campaign, the Fed will be unable to launch QE4, for the simple reason that QE, which is nothing more than the Fed's deficit-funding coupled with a boosting of asset prices via the outside money reserve channel, would promptly soak up all the remaining bond market depth, and even as the S&P hit all time highs, it would lead the government bond market to terminal instability. Which is why, paradoxically, for the status quo to persist, either the government will have to lower taxes which would require far greater debt issuance by the Treasury, and thus provide far more dry powder for the Fed to monetize, or the US will finally have to launch that deficit ballooning war it has been itching so hard to start since 2013. That, or the Fed may finally realize that by reflating asset prices it does nothing to boost the actual economy as the S&P has and always will refuse to trickle down to the middle class, and the Fed will finally engage in what has been the endgame from day one: paradropping bricks of cash all over the continental US in the last ditch desperate effort to reflate a debt-load which has now pushed not only the US but the world into secular stagnation.
|
05-29-15 | THEMES | FLOWS |
|
| CRACKUP BOOM - ASSET BUBBLE | THEME | |||
| SHADOW BANKING - LIQUIDITY / CREDIT ENGINE | M | THEME | ||
| GENERAL INTEREST |
|
|||
| STRATEGIC INVESTMENT INSIGHTS - Weekend Coverage | ||||
|
SII | |||
RETAIL - McDonalds
What do you do when month after month you have nothing but bad data to report, such as in this case McDonalds with its weekly comparable store sales shown on the ugly charts below?
Simple: you have two choice - you either seasonally adjust the data (or in the case of US GDP, double-seasonally adjust it), or if that is not possible since unlike US GDP, your numbers are at least somewhat indicative of underlying reality, you stop reporting them altogether. That's what McDonalds just did.
From Bloomberg:
And to think the new boss - who we hope did not promise the board anything about "transparency and accountability" - could have avoided all of this if, as we suggested, he had worn at least 37 piece of flair. |
05-3015 | SII US IND CONS |
||
RETAIL - Gaming Wynn Calls "Big" Recovery "Complete Dream" As Gaming Revenues Collapse 05-05-15 Zero Hedge Last month, courtesy of Andrew Zatlin’s Vice Index, we flagged the disturbing Q1 rise in traveling hookers. We call the trend disturbing not because we have a prima facie inclination to look with disdain upon all things escort-related but because, as Zatlin notes, when escorts are forced to take their show on the road it means the phones have stopped ringing locally, and if you’re inclined to believe that trends in all-cash businesses are a good leading indicator for trends in consumer spending in general, depressed spending on gambling, alcohol, and other “fun” things does not bode well for economic growth going forward. As you can see from the graph below, The Vice Index hit its lowest level in more than a year in March: Given this — and given the fact that whatever discretionary income Americans do have is apparently being chanelled into TD Ameritrade accounts — it should perhaps come as no surprise that gaming revenue on the Las Vegas strip fell nearly 10% in March after sliding 4.4% in February. Meanwhile, the situation in Macau continues to deteriorate at a rather remarkable pace, as gaming revenue fell 39% last month, the eleventh consecutive monthly decline which looks good only in comparison to March’s 39.4% decline and February’s 49% drop. Of course in the deluded minds of China’s millions of newly-minted day traders, a 39% decline represents “stabilization” and so, as Bloomberg reports, casino shares rose in Hong Kong on the news:
Right. As long as things “aren’t deteriorating” and revenues are only falling by 40% that’s a “decent sign.” Unfortunately, some industry heavyweights don’t seem to share the view that the market is set to turn the corner any time soon. Take Steve Wynn for instance who, on the way to slashing WYNN’s dividend by nearly 70%, had the following to say about the company’s outlook for Vegas and Macau and about the so-called "recovery" in the US economy:
Besides being a stinging indictment of the pitiable state of the US economy, that’s a fairly unambiguous message from someone who knows a thing or two about this industry and even as the likes of Deutsche Bank called the Las Vegas commentary “overdone”, the bank had the following to say about the outlook for the gaming industry:
Despite the malaise and despite the fact that, as we noted earlier this year, Beijing’s corruption crackdown has likely motivated China's habitual (and filthy rich) gamblers to move permanently away from the dark-lit Macau gambling parlors to multiple-monitor lit trading desks, there will always, always be BTFDers — especially when you’re talking about Hong Kong-listed shares. With that in mind, we'll close with this quote provided to Reuters by Matthew Ossolinski, chairman of Ossolinski Holdings:
|
05-23-15 | SII US IND CONS |
||
RETAIL - WalMart Walmart Sales, Comps Miss; Operating Income Tumbles; Runs Out Of Scapegoats 05-19-15 Zero Hedge In what may be the most cryptic press release from Walmart yet, the company just issued an 8-K which consisted all of 5 bullet points, a few charts, and precious little else. Perhaps the reason for the pithy transmission is that WMT had nothing good to say: Revenue declined from $115 billion to $114.8 billion, missing expectations of a jump to $116.2 billion, EPS also missed at $1.03, vs $1.05 expected, operating income tumbled 8.3% from $6.2 billion to $5.7 billion, and finally comp store sales also missed at 1.0%, below the 1.5% expected. With these results, anyone would be short and to the point. After previously providing extensive explanations for why the massive Apple Sachs Industrial Member member missed, this quarter the firm almost didn't even bother to scapegoat. This is what it said:
As if it didn't even bother to put in the effort to find a reason for the 8.3% plunge in operating income. Finally, even the company's guidance was berely there. From Charles Holley, Executive Vice President and CFO, Wal-Mart Stores, Inc.
Wall Street currently expects a Q2 EPS print of $1.17. And with this latest bellwether miss, expect the S&P to close at a recorder high today. |
05-23-15 | SII US IND CONS |
||
RETAIL - Consumer Recession The Recovery Itself Unravels; Consumer Recession 05-13-15 Alhambra If March was supposed to herald at least the beginning of the anticipated yearly rebound, April put that idea to rest. In terms of retail sales, one of the most important and largest segments of “demand”, April’s figures were mostly the worst of the recovery and some of the worst in the entire series – “beating” out February in every category. Even including autos, total retail sales gained just 0.72% in April more than suggesting there really is a major economic problem brewing. Among the other segments, the figures are getting truly dire (all numbers are year-over-year not-adjusted): retail & food sales ex autos -0.35%; retail trade incl. autos –0.26%; just retail ex food ex autos -1.80%; general merchandise stores -1.52%. While these numbers are severe on their own, this is a contractionary environment that now stretches at least four months and in some cases five. Recessions are not spontaneous events but rather the accumulation of negative pressures and results. There can be no doubt that consumers in the US right at this moment are acting out of recessionary impulses. The accumulation of the past four months is indistinguishable from results of the past two recessions (apart from the collapse after Lehman): The negative Y/Y changes, which are actually quite rare, place April 2015 among the very worst economic months of the entire series dating back to 1992. In addition to registering these atrocious results, the trajectory continues on in the “wrong” direction. In other words, not only is the US economy accumulating contraction the outlook isn’t indicative of that changing anytime soon. Households are pulling back, staying back and doing so rather quickly. We have pushed way past last year’s “aberration” in the polar vortices and way past even the immediate aftermath of the 2012 slowdown (which hit in the also-snowy winter of 2013). You can make the argument that the full US economy is not in recession but it is now exceedingly difficult to sustain any position that doesn’t put the consumer already there. With capital goods spending equally unstable and sinking, as well as the “dollar” yet having companies cut back in all major costs, it is very troubling that these highly negative estimates have occurred without the much larger and heavier recessionary forces that are still likely as downstream events; those would include the as-yet oil sector retrenchment. Furthermore, there is still the massive inventory overhang that has been accumulated in the last year or so likely upon the word of economists that what has already occurred was impossible. That places even further emphasis on the downsides still coming up as that inventory will slow the entire supply chain liquidations first. In other words, if this is a consumer recession taking shape then the full economy is just now seeing the leading edge with the worst, potentially, yet to come. The world that Janet Yellen was talking about late last year is completely gone and there isn’t much left of even hope to salvage it; though I suspect they will keep trying to the last inappropriate data point. I wondered a few months back what it might look like if a recession were to form without ever having gained a recovery from the last one – consumers already in the bunker. The initial results of that are not encouraging as the economy has been serially overstated anyway and the real recession hammer has yet to strike. Maybe the bond market is correct and that another QE is coming, but at this point all that may do is as the last few did, namely put off the inevitable without any real economic upside; and that is the best case. While that may be great for stocks (though it may not be) I suspect the expiration date on QE and monetary magic may be rapidly approaching. It already has for “demand.” |
05-23-15 | SII US IND CONS |
||
|
SII | |||
|
SII | |||
|
SII | |||
| TO TOP | ||||
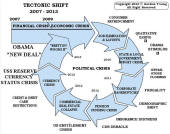
Read More - OUR RESEARCH - Articles Below
Tipping Points Life Cycle - Explained
Click on image to enlarge
TO TOP
�
TO TOP
