|
JOHN RUBINO'SLATEST BOOK |
||||||||||||||||||||||||||||||||||||||||||||||||||||||||||||||||||||||||||||||||||||||||||||||||||||||||||||||||||||||||||||||||||||||||||||||||||||||||||||||||||||||||||||||||||||||||||||||||||||||||||||||||||||||||||||||||||||||||||||||||||||||||||||||||
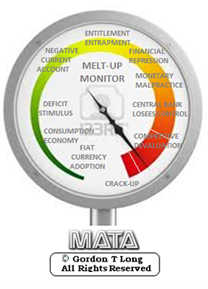
"MELT-UP MONITOR " Meltup Monitor: FLOWS - The Currency Cartel Carry Cycle - 09 Dec 2013 Meltup Monitor: FLOWS - Liquidity, Credit & Debt - 04 Dec 2013 Meltup Monitor: Euro Pressure Going Critical - 28- Nov 2013 Meltup Monitor: A Regression-to-the-Exponential Mean Required - 25 Nov 2013
|
"DOW 20,000 " Lance Roberts Charles Hugh Smith John Rubino Bert Dohman & Ty Andros
|
HELD OVER
Currency Wars
Euro Experiment
Sultans of Swap
Extend & Pretend
Preserve & Protect
Innovation
Showings Below
"Currency Wars "
|
"SULTANS OF SWAP" archives open ACT II ACT III ALSO Sultans of Swap: Fearing the Gearing! Sultans of Swap: BP Potentially More Devistating than Lehman! |
"EURO EXPERIMENT"
archives open EURO EXPERIMENT : ECB's LTRO Won't Stop Collateral Contagion!
EURO EXPERIMENT: |
"INNOVATION"
archives open |
"PRESERVE & PROTE CT"
archives open |

Weekend June 27th, 2015
Follow Our Updates
on TWITTER
https://twitter.com/GordonTLong
AND FOR EVEN MORE TWITTER COVERAGE
![]()
| JUNE | ||||||
| S | M | T | W | T | F | S |
| 1 | 2 | 3 | 4 | 5 | 6 | |
| 7 | 8 | 9 | 10 | 11 | 12 | 13 |
| 14 | 15 | 16 | 17 | 18 | 19 | 20 |
| 21 | 22 | 23 | 24 | 25 | 26 | 27 |
| 28 | 29 | 30 | ||||
KEY TO TIPPING POINTS |
| 1- Bond Bubble |
| 2 - Risk Reversal |
| 3 - Geo-Political Event |
| 4 - China Hard Landing |
| 5 - Japan Debt Deflation Spiral |
| 6- EU Banking Crisis |
| 7- Sovereign Debt Crisis |
| 8 - Shrinking Revenue Growth Rate |
| 9 - Chronic Unemployment |
| 10 - US Stock Market Valuations |
| 11 - Global Governance Failure |
| 12 - Chronic Global Fiscal ImBalances |
| 13 - Growing Social Unrest |
| 14 - Residential Real Estate - Phase II |
| 15 - Commercial Real Estate |
| 16 - Credit Contraction II |
| 17- State & Local Government |
| 18 - Slowing Retail & Consumer Sales |
| 19 - US Reserve Currency |
| 20 - US Dollar Weakness |
| 21 - Financial Crisis Programs Expiration |
| 22 - US Banking Crisis II |
| 23 - China - Japan Regional Conflict |
| 24 - Corruption |
| 25 - Public Sentiment & Confidence |
| 26 - Food Price Pressures |
| 27 - Global Output Gap |
| 28 - Pension - Entitlement Crisis |
| 29 - Central & Eastern Europe |
| 30 - Terrorist Event |
| 31 - Pandemic / Epidemic |
| 32 - Rising Inflation Pressures & Interest Pressures |
| 33 - Resource Shortage |
| 34 - Cyber Attack or Complexity Failure |
| 35 - Corporate Bankruptcies |
| 36 - Iran Nuclear Threat |
| 37- Finance & Insurance Balance Sheet Write-Offs |
| 38- Government Backstop Insurance |
| 39 - Oil Price Pressures |
| 40 - Natural Physical Disaster |
Reading the right books?
No Time?
We have analyzed & included
these in our latest research papers Macro videos!
![]()
OUR MACRO ANALYTIC
CO-HOSTS
John Rubino's Just Released Book
Charles Hugh Smith's Latest Books
Our Macro Watch Partner
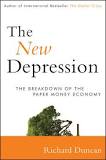
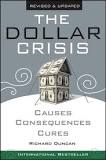
Richard Duncan Latest Books
MACRO ANALYTIC
GUESTS
F William Engdahl
OTHERS OF NOTE
Book Review- Five Thumbs Up
for Steve Greenhut's
Plunder!
TODAY'S TIPPING POINTS
|
Have your own site? Offer free content to your visitors with TRIGGER$ Public Edition!
Sell TRIGGER$ from your site and grow a monthly recurring income!
Contact [email protected] for more information - (free ad space for participating affiliates).
HOTTEST TIPPING POINTS |
Theme Groupings |
||
We post throughout the day as we do our Investment Research for: LONGWave - UnderTheLens - Macro
|
|||
|
MOST CRITICAL TIPPING POINT ARTICLES TODAY
|
|
||
|
|||
 |
|||
RETAIL - Gap To Fire Thousands Auto Loans In "Untested" Territory Blackstone Warns As Subprime ABS Sales Accelerate 06-24-15 ZH Earlier this month, we24-15 gave readers a snapshot of the US auto market on the way to explaining why it was that car sales hit a 10-year high in May. To recap:
We went on to note that despite the worrying statistics shown above, optimists (like Experian) will likely point to the fact that the average FICO score for borrowers financing new cars fell only slighty from 714 to 713 Y/Y while the same Y/Y scores for those financing used vehicles actually rose from 641 in Q1 2014 to 643 in Q1 2015. While that's all well and good, there's every indication that those figures are likely to deteriorate significantly going forward. Why? Because Wall Street's securitization machine is involved. in the consumer ABS space (which encompasses paper backed by student loans, credit cards, equipment, auto loans, and other, more esoteric types of consumer credit), auto loan-backed issuance accounts for half of the market and a quarter of auto ABS is backed by loans to subprime borrowers. Put simply, those subprime borrowers are getting subprimey-er. In other words, the same dynamic that prevailed in the US housing market prior to the collapse is at play in the auto loan market. Lenders are competing for borrowers as lucrative securitization fees beckon, and this competition is directly responsible for loose underwriting standards. Bloomberg has more on the interplay between auto ABS issuance and “stretched” auto loan terms:
Here's a visual overview of the auto loan-backed ABS market (note the resurrgence of subprime as a percentage of total issuance post-2009 and the rising net loss rates):
* * * The takeaway here is simple: under pressure to keep the US auto sales miracle alive and feed Wall Street's securitization machine (which is itself driven by demand from yield-starved investors) along the way, lenders are lowering their underwriting standards and extending loans to underqualified borrowers. Particularly alarming is the fact that even as average loan terms hit record highs, average monthly payments are not only not falling, but are in fact also sitting at all-time highs. This cannot and will not end well.
|
06-27-15 | SII US IND CONS |
|
| MOST CRITICAL TIPPING POINT ARTICLES THIS WEEK - June 21st, 2015 - June 27th, 2015 | |||
| BOND BUBBLE | 1 | ||
GLOBAL RISK - Bond Funds are Bracing for a Market Crash $140 Billion Bond Fund Goes To Cash As It "Braces For Bond-Market Collapse" 06-22-15 ZH Recently, it’s become readily apparent that some of the world’s top money managers are getting concerned about what might happen when a mass exodus from bond funds collides head on with a completely illiquid secondary market for corporate credit. Indeed, bond market illiquidity is the topic du jour and has almost become something of a cliche among pundits and mainstream financial media outlets years after we first raised the issue in these pages. But just because something has become fashionable to discuss doesn’t mean it’s not worth discussing and indeed, we’re at least pleased to see that the world is suddenly awake to the fact that a primary market supply bonanza catalyzed by rock-bottom borrowing costs and yield-starved investors could spell disaster when paired with shrinking dealer inventories. For illustrative purposes, here’s a look at turnover in corporate credit… Chart: Barclays ...and a snapshot of shrinking dealer inventories and ballooning bond funds… Chart: Citi ...and finally, here's UST market depth…
What all of these charts show is that whether you’re talking about corporate credit or “risk free” government debt, liquidity simply isn’t there and as was on full display last October, wild swings in illiquid markets will be exacerbated by the presence of parasitic HFTs. Meanwhile, Treasury market participants are shifting to futures and corporate bond fund managers are using ETFs to offset “diversifiable” outflows, phenomena which prove investors are actively avoiding credit markets by resorting to derivatives, a practice which only serves to make the underlying markets still more illiquid. Of course one way to mitigate risk is simply to move to cash (as we noted over the weekend, some managers are even moving to physical cash), a strategy TCW’s Jerry Cudzil is currently implementing in order to ensure he’s not one of the ones “looking silly” after the crash. Bloomberg has more:
Well, preferably neither, but point taken and we would have to agree that if ever there were a time to take one's money and run — before the realities of a dealer-less corporate credit market and/or an HTF-infested, VaR shock-prone government bond market conspire to prove, once and for all, that in today's world, the idea that bonds are any safer than other asset classes is completely and utterly false — this is it. |
06-23-15 | RISK STUDY- LIQUIDITY FLOWS
|
1- Bond Bubble |
| RISK REVERSAL - WOULD BE MARKED BY: Slowing Momentum, Weakening Earnings, Falling Estimates | 2 | ||
| GEO-POLITICAL EVENT | 3 | ||
| CHINA BUBBLE | 4 | ||
| JAPAN - DEBT DEFLATION | 5 | ||
EU BANKING CRISIS |
6 |
||
| TO TOP | |||
| MACRO News Items of Importance - This Week | |||
GLOBAL MACRO REPORTS & ANALYSIS |
|||
US ECONOMIC REPORTS & ANALYSIS |
|||
| CENTRAL BANKING MONETARY POLICIES, ACTIONS & ACTIVITIES | |||
| Market | |||
| TECHNICALS & MARKET |
|
||
HARD ASSETS - The Defintive Report on Gold Available IN GOLD WE TRUST Incrementum Li
In Gold We Trust 2015 - Extended Version (e) by Financial Repression
Today, the 2015 edition of the gold report “In Gold We Trust” was launched. It is the 9th edition (read the 2013 and 2014 edition). With a global reach of some 1 million readers, it is probably the most read gold report worldwide. The In Gold We Trust 2015 is written by Ronald Stoeferle. He is the managing partner of a global fund at Incrementum AG in Liechtenstein, focused on the principles of the Austrian school of Economics. 2015 EDITION: "IN GOLD WE TRUST" The gold price has stabilized in 2014, after its collapse in April and June of 2013. Investors' interest in the yellow metal is los. Hence, market sentiment vis-à-vis gold is standing at a multi-year low, maybe even a multi-decade low. History learns that extreme underperformance usually lasts for one year. If history is any guide, than there should be a recovery in the gold price in the foreseeable future. Even with the severe underperformance since 2013, gold is up approximately 9% per year since it started to trade freely in 1971. As seen on the next chart, depending on the currency in which it trades, the average yearly performance is excellent for investors with a long term horizon. In other words, gold does what is always has done throughout history: preserve value and purchasing power. Preservation of wealth is the primary reason why one should hold gold nowadays. Monetary policies of central banks are extremely unusual. The U.S. Fed could be talking about “normalization,” but with 7 years at zero percent interest rates we are nowhere near “normal” conditions. The most extreme monetary conditions, today, are being seen in Japan. It is really no coincidence that the gold price in Yen is near its all time highs. The gold price in Yen is simply reacting on the extreme expansion of the monetary base by the Japanese central bank. As the next chart shows, the balance sheet of the Bank Of Japan (BOJ) is approximately 65% of the country's GDP. In other words, the assets that the BOJ is holding nears 2/3 of the total economic output of the country. When compared to other regions, it is clear that is a monstrous amount. It seems that Japan is near its endgame. One of the “reasons” gold has gotten so little attention in the last two years is that investors have been focused on stock markets around the world. The U.S. stock market has seen a huge rally since October of 2012, European stocks catapulted higher when the European version of QE was announced earlier this year, Japan keeps on making multi-year highs in the wake of an ever expanding monetary policy. Meantime, however, stocks are not cheap anymore. On a historic basis, when expressed in a price/earnings ratio according to the Shiller method, the stock market in the U.S. sits at relatively high levels (although no extremes). Although it is not given that the stock market is about to go south, there always is a possibility that the top is set in which case gold should see positive returns. As the next chart shows, during periods of the worst performance of the S&P 500, stocks and commodities have lost significant value while gold remained steady. A correction in the stock market is certainly in the cards. Why? Because traditionally the gold/silver ratio is mostly negatively correlated with the S&P 500. In other words, as the gold/silver ratio goes down which means there is a disinflationary environment, stocks come down as well. Over the last 25 years, that correlation has held very well, but started to diverge strongly 3 years ago. Gold is underperforming in a disinflationary environment. That has been one of the key observations in the last In Gold We Trust reports. There was enough evidence in the datapoints so far, but the most up-to-date chart says it all (see below). While the real rates were standing at -4% in 2011, they have gone up steadily since then, and are again in positive territory this year. The gold price has moved in the opposite direction in that same time period. The In Gold We Trust Report 2015 focuses, among many other things, on the correlation between the gold price and inflation expectations. Gold is an inflation sensitive asset. The U.S. 10-Year real yields provide an indication of inflation expectations. As readers can see, a strong divergence is in place since 2013, arguing for a strong revaluation of the gold price as inflation expectations are in an uptrend since then. Suppose, however, that inflation expectations will change their trend … would that be bad for precious metals? The answer to that question is to be found in the last chart. During deflationary periods, like the ones starting in 1814 or 1864, the Great Depression of the 30ies or the financial crisis of 2008, gold did remarkably well. It is during those periods of “financial stress” that gold shows its real value, i.e. preserve wealth and provide protection against other assets. The themes in this years 2015 "In Gold Trust Report" are the real value of gold as a financial asset and the end of gold's underperformance. |
06-25-15 | MACRO GEO-ECO |
|
RISK - Post Q2 Quadruple Witch - Institutional Money Changing Direction OUR BIG PICTURE DRILLING DOWN STUDY SEQUENCE:
"DON'T FIGHT THE FED" MANTRA
It seems best to trust what the market is saying. So, forget the Fed. Don’t fight the market. Investors whose strategy is to follow the Fed – in the belief that stocks will advance as long as the Fed does not raise interest rates – are free to place all their eggs in Janet’s basket. On the other hand, for investors whose strategy is historically informed by factors that have reliably distinguished market advances from collapses over a century of history, our suggestion is to consider a stronger defense. Our greatest successes have been when our investment outlook was aligned with valuations and market internals, and our greatest disappointments have been when it was not. Both factors are unfavorable at present, and our outlook is aligned accordingly. CHANGING INSTITUTIONAL FLOWS
|
06-24-15 | STUDIES
|
|
| COMMODITY CORNER - AGRI-COMPLEX | PORTFOLIO | ||
| SECURITY-SURVEILANCE COMPLEX | PORTFOLIO | ||
| THESIS - Mondays Posts on Financial Repression & Posts on Thursday as Key Updates Occur | |||
| 2015 - FIDUCIARY FAILURE | 2015 | THESIS 2015 |  |
| 2014 - GLOBALIZATION TRAP | 2014 |  |
|
|
2013 2014 |
|||
FINANCIAL REPRESSION - Cashless Society Needed for Negative Rates Cashless Society Needed for Negative Rates-Gordon LongBy Greg Hunter On June 14, 2015 In Political Analysis 216 Comments
By Greg Hunter’sUSAWatchdog.com (Early Sunday Release) Macroeconomist Gordon Long says elite bankers want and need negative interest rates. How do they get them? Long says, “We need a cashless society in order to get negative interest rates. We have had negative real interest rates for some time. That’s the whole premise of paying down the government debt by effectively debasing it. But we have run up against a wall, and we have run up against that wall. Clearly, quantitative easing isn’t working.” Long says the bankers are not through distorting the system, and a cashless society is the next step. Long explains, “We are still early in the second or third innings of what’s to come. We are trapped in a globalization trap. With quantitative easing . . . we are bringing demand forward. Debt is nothing but future demand. So, we are really pushing at demand, but we can’t bring anymore forward. In fact, real disposable income is falling. People don’t have money to spend, and jobs are not there. The issue now is not demand. . . .The issue is oversupply. Cheap money doesn’t just allow you to buy something, it also allows producers to produce.” So, will a cashless society put off the next crash? Long says, “We have run out of runway, but never underestimate the ingenuity of a trapped politician and central bankers to come out with new policies and new ways to extend this. We are going to see some pretty violent volatility and corrections. We are going to be in there guaranteeing collateral because our issue is . . . there is a shortage of collateral. The Fed sucked all of the bonds out of the market. There is a shortage of them. So, we have a major liquidity problem. That’s the runway we are running out of, and flows are starting to slow dramatically. Now, that says it’s getting unstable, but that doesn’t mean the world is coming to an end. It does mean we are going to do something else, and one of those things is negative nominal rates and cashless society. That’s the reason why we are going to have a cashless society. You are going to see this (cashless society idea) accelerate in the next six months.” Long predicts, “The next crisis is going to be in sovereign debt, and it’s going to be in the bond market. I think it will stem out of the insurance and pension problem where they can’t fund it. Credit is going to collapse around muni bonds, who are using this money to pay pensions. Yes, we are out of runway. . . . We have north of $200 trillion in debt structures. Right now, it’s paying on average 4% or $8 trillion a year. The global GDP is only $72 trillion. The debt is now consuming our seed corn, so to speak. We are not only eating the seed corn, we are borrowing the money; and at some point, somebody is no longer going to lend you money. That’s kind of where we are right now.” So, is hyperinflation what is coming next? Long says, “It’s coming, but not next. Hyperinflation is a currency event. Hyperinflation is not about prices going up but your currency going down, which means things are more expensive to you. When hyperinflation happens, it is very quick and very short. It is a lack of confidence. What triggers a lack of confidence? All of a sudden, you have an alternative to the debasement in these developed countries. . . . I believe we are going to have more deflation. We are going to have both inflation and deflation, but we are going to have more deflation first because of this oversupply I talked about. Excess supply is going to start to collapse collateral values which are going to hurt assets (bonds held as collateral). I believe, very quickly, that governments will move to guarantee collateral. When that happens, then we get into the hyperinflation. So, there is a down, then a panic and then we go up. We could have a Minsky melt-up, but not Long adds that it will be “2008 all over again, but on steroids.” Join Greg Hunter as he goes One-on-One with financial expert Gordon T. Long. (There is much, much more in the video interview.)
After the Interview:
|
|||
2011 2012 2013 2014 |
|||
| THEMES - Normally a Thursday Themes Post & a Friday Flows Post | |||
I - POLITICAL |
|||
| CENTRAL PLANNING - SHIFTING ECONOMIC POWER - STATISM | THEME | ||
- - CORRUPTION & MALFEASANCE - MORAL DECAY - DESPERATION, SHORTAGES. |
THEME |  |
|
| - - SECURITY-SURVEILLANCE COMPLEX - STATISM | M | THEME | |
| - - CATALYSTS - FEAR (POLITICALLY) & GREED (FINANCIALLY) | G | THEME | |
II-ECONOMIC |
|||
| GLOBAL RISK | |||
| - GLOBAL FINANCIAL IMBALANCE - FRAGILITY, COMPLEXITY & INSTABILITY | G | THEME | |
| - - SOCIAL UNREST - INEQUALITY & A BROKEN SOCIAL CONTRACT | US | THEME | |
| - - ECHO BOOM - PERIPHERAL PROBLEM | M | THEME | |
| - -GLOBAL GROWTH & JOBS CRISIS | |||
| - - - PRODUCTIVITY PARADOX - NATURE OF WORK | THEME | MACRO w/ CHS |
|
| - - - STANDARD OF LIVING - EMPLOYMENT CRISIS, SUB-PRIME ECONOMY | US | THEME | MACRO w/ CHS |
III-FINANCIAL |
|||
| FLOWS -FRIDAY FLOWS | MATA RISK ON-OFF |
THEME | |
FLOWS - Liqudity, Credit and Debt These Three Events Will Shatter "Liquidity Illusion", Trigger Crisis, OECD Says 06/25/15 OECD via ZH The OECD has released its first Business and Finance Outlook which the organization describes as “an annual publication that presents unique data and analysis that looks at what might affect and change.. tomorrow’s world of business finance and investment.” Over some 250 pages, the first edition offers a sweeping look at the global financial landscape and outlines, in excruciating detail, many of the major themes we’ve built on in these pages including companies’ propensity to spend on buybacks and dividends at the expense of capex, the dangers of employing unrealistic pension fund investment return assumptions in a ZIRP world, and, of course, the liquidity paradox, wherein trillions in central bank cash injections mask underlying illiquidity — especially in bond markets. Here’s how Reuters summarizes the report:
And here is the OECD’s take on the “liquidity illusion”:
Once again we see that the proliferation of HY bond funds and other esoteric products (that have attracted unprecedented inflows in an environment where risk free assets yield at best an inflation adjusted zero and at worst have a negative carry) is cause for serious concern among very "serious" people who, years after the issue was first raised here, are now suddenly coming to the realization that when the market finally turns (due either to a poorly executed Fed liftoff or a geopolitical catastrophe), and previously diversifiableflows suddenly become a one-way rush to the exits, fund managers will be forced to sell the underlying assets, and in the absence of dealer liquidity (which has all but dried up in the post-crisis regulatory regime) a self-feeding firesale will ensue at which point central banks will either do as the IMF recently suggested and become market makers of last resort, or watch in horror from the sidelines as the bubble blown by allowing otherwise insolvent corporate issuers to stay afloat by tapping capital markets at artificially suppressed rates implodes in spectacular fashion. Grab some popcorn. �
|
06/26/15 | THEMES FLOWS |
FLOWS |
| CRACKUP BOOM - ASSET BUBBLE | THEME | ||
| SHADOW BANKING - LIQUIDITY / CREDIT ENGINE | M | THEME | |
| GENERAL INTEREST |
|
||
| STRATEGIC INVESTMENT INSIGHTS - Weekend Coverage | |||
|
SII | ||
|
SII | ||
|
SII | ||
|
SII | ||
| TO TOP | |||
Read More - OUR RESEARCH - Articles Below
Tipping Points Life Cycle - Explained
Click on image to enlarge
TO TOP
�
TO TOP
