|
JOHN RUBINO'SLATEST BOOK |
||||||||||||||||||||||||||||||||||||||||||||||||||||||||||||||||||||||||||||||||||||||||||||||||||||||||||||||||||||||||||||||||||||||||||||||||||||||||||||||||||||||||||||||||||||||||||||||||||||||||||||||||||||||||||||||||||||||||||||||||||||||||||||||||||||||||||||||||||||||
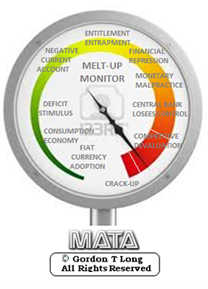
"MELT-UP MONITOR "
Meltup Monitor: FLOWS - The Currency Cartel Carry Cycle - 09 Dec 2013 Meltup Monitor: FLOWS - Liquidity, Credit & Debt - 04 Dec 2013 Meltup Monitor: Euro Pressure Going Critical - 28- Nov 2013 Meltup Monitor: A Regression-to-the-Exponential Mean Required - 25 Nov 2013
|

![]()
"DOW 20,000 "
Lance Roberts Charles Hugh Smith John Rubino Bert Dohman & Ty Andros
|

HELD OVER
Currency Wars
Euro Experiment
Sultans of Swap
Extend & Pretend
Preserve & Protect
Innovation
Showings Below
"Currency Wars "
|


"SULTANS OF SWAP" archives open ACT II ACT III
ALSO Sultans of Swap: Fearing the Gearing! Sultans of Swap: BP Potentially More Devistating than Lehman! |

"EURO EXPERIMENT"
archives open EURO EXPERIMENT : ECB's LTRO Won't Stop Collateral Contagion!
EURO EXPERIMENT: |

![]()
"INNOVATION"
archives open |

"PRESERVE & PROTE CT"
archives open |

Fri. Oct. 23rd, 2015
Follow Our Updates
onTWITTER
https://twitter.com/GordonTLong
AND FOR EVEN MORE TWITTER COVERAGE
ARCHIVES
| OCTOBER | ||||||
| S | M | T | W | T | F | S |
| 1 | 2 | 3 | ||||
| 4 | 5 | 6 | 7 | 8 | 9 | 10 |
| 11 | 12 | 13 | 14 | 15 | 16 | 17 |
| 18 | 19 | 20 | 21 | 22 | 23 | 24 |
| 25 | 26 | 27 | 28 | 29 | 30 | 31 |
KEY TO TIPPING POINTS |
| 1- Bond Bubble |
| 2 - Risk Reversal |
| 3 - Geo-Political Event |
| 4 - China Hard Landing |
| 5 - Japan Debt Deflation Spiral |
| 6- EU Banking Crisis |
| 7- Sovereign Debt Crisis |
| 8 - Shrinking Revenue Growth Rate |
| 9 - Chronic Unemployment |
| 10 - US Stock Market Valuations |
| 11 - Global Governance Failure |
| 12 - Chronic Global Fiscal ImBalances |
| 13 - Growing Social Unrest |
| 14 - Residential Real Estate - Phase II |
| 15 - Commercial Real Estate |
| 16 - Credit Contraction II |
| 17- State & Local Government |
| 18 - Slowing Retail & Consumer Sales |
| 19 - US Reserve Currency |
| 20 - US Dollar Weakness |
| 21 - Financial Crisis Programs Expiration |
| 22 - US Banking Crisis II |
| 23 - China - Japan Regional Conflict |
| 24 - Corruption |
| 25 - Public Sentiment & Confidence |
| 26 - Food Price Pressures |
| 27 - Global Output Gap |
| 28 - Pension - Entitlement Crisis |
| 29 - Central & Eastern Europe |
| 30 - Terrorist Event |
| 31 - Pandemic / Epidemic |
| 32 - Rising Inflation Pressures & Interest Pressures |
| 33 - Resource Shortage |
| 34 - Cyber Attack or Complexity Failure |
| 35 - Corporate Bankruptcies |
| 36 - Iran Nuclear Threat |
| 37- Finance & Insurance Balance Sheet Write-Offs |
| 38- Government Backstop Insurance |
| 39 - Oil Price Pressures |
| 40 - Natural Physical Disaster |
Reading the right books?
No Time?
We have analyzed & included
these in our latest research papers Macro videos!
OUR MACRO ANALYTIC
CO-HOSTS
John Rubino's Just Released Book
Charles Hugh Smith's Latest Books


Our Macro Watch Partner
Richard Duncan Latest Books
MACRO ANALYTIC
GUESTS
F William Engdahl


OTHERS OF NOTE
Book Review- Five Thumbs Up
for Steve Greenhut's Plunder!


![]()
TODAY'S TIPPING POINTS
|
Have your own site? Offer free content to your visitors with TRIGGER$ Public Edition!
Sell TRIGGER$ from your site and grow a monthly recurring income!
Contact [email protected] for more information - (free ad space for participating affiliates).
HOTTEST TIPPING POINTS |
Theme Groupings |
||
We post throughout the day as we do our Investment Research for: LONGWave - UnderTheLens - Macro
|
|||
|
MOST CRITICAL TIPPING POINT ARTICLES TODAY
|
|
||
|
|||
FLOWS - Liquidity, Credit & Debt |
10-23-15 | THEMES | FLOWS |
Submitted by Tyler Durden on 10/09/2015
It A "Liquidity Mirage": New York Fed Finally Grasps How Broken The Market Is Due To HFTsIn the aftermath of the October 15th, 2014 Treasury flash crash that was much fake "confusion" among the punditry about what caused the dramatic 20-sigma move in the 10 Year treasury. For us, however, there was no confusion, it was all due to a vicious case of HFT algo quote stuffing - a key component of algos trying to establish whether there are credible size orders to be frontrun - gone horribly wrong.
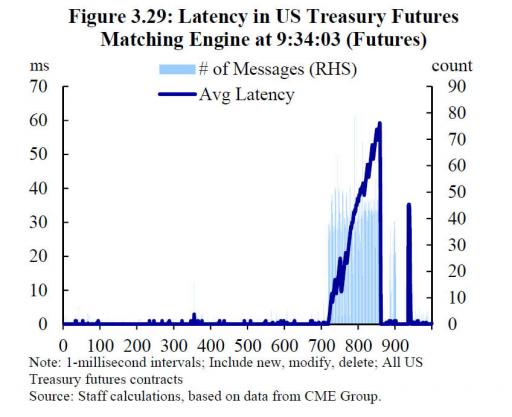
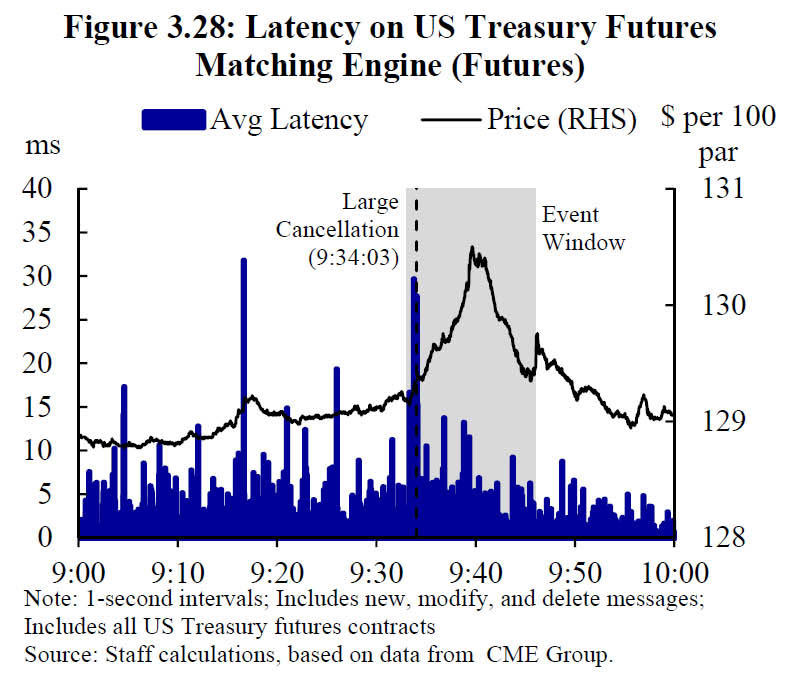
Several months later, in July, the Joint-Staff Report released by the Treasury, Fed, SEC and CFTC confirmed as much, and even if they didn't explicitly single out HFTs as the culprit for the flash crash (that would mean having to redo the topography of the market, in the process gutting and redoing the entire market structure after tacitly admitting the market is broken), they did very clearly note that it was "self-trading", or quote stuffing, that was responsible for the unprecedented move. Here are the only two charts that mattered from that report:
As we thoroughly documented back in July, this is what the staff report said: "Given the finite capacity of any matching engine to simultaneously process messages and execute matches between buyers and sellers, extremely high message rates appeared to cause trading platform latency to temporarily jump higher", or as we explained it " a massive burst of quote stuffing (seen with absolute clarity on Figure 3.29 above) in the form of a surge in messages, resulted in a burst of accumulated order latency, which in turn was the catalyst to send the price soaring from 129 to over 130 in the span of 5 minutes, and then sliding back down again once the quote stuffing effect was eliminated." Which brings us to our conclusion then:
Today we are one stop closer to that inevitable moment when the enabled systemic parasite, high frequency trading,which exists solely as a result of the market overhaul allowed in the aftermath of Reg NMS, is rooted out. In a report authored by NY Fed economists Dobrislav Dobrev and Ernst Schaumburg, we get one step closer to the regulators admitting what we have said since day one: HFT does not provide liquidity (although it does provide a whole lot of liquidity-rebate generating volume), it provides a "liquidity mirage." In the note the authors roundly crush the biggest, and frequently only, benefit of HFTs as stipulated ad nauseam by its advocates, namely an increase in "market efficiency and pricing developments." The authors note:
Goodbye to "fat fingers" being blamed for flash crashes, and welcome to the Heisenberg uncertainty market:you can have your 1 cent bid/ask spreads... but you can't have any real market depth at the same time. And the moment you try to buy or sell a big chunk in Treasurys (or any other asset class), that tight bid/ask spread explodes as HFTs yanks opposing offers (or bids), and all the telegraphed market depth evaporates in an instant, leading to events like October 15, 2014. As Bloomberg summarizes the note, which adds nothing new to what we have said over the past 6 years, "after examining trading across the most active platforms, including futures through CME Group Inc. and cash Treasuries on ICAP Plc’s BrokerTec and Nasdaq OMX Group Inc.’s eSpeed, the researchers found evidence that high-frequency traders create an illusion of liquidity in the Treasuries market."
Once again: what HFTs do in a normal state is not trading; it's frontrunning and trying to evaluate just how many of the other concurrent "orders" in the market are just as fake; needless to say, the one with the fastest server and most expensive colo box wins, even if they never actually provide liquidity.
The moment a real order does enter the marketplace, the quasi equilibrium represented by the order book disappears in an insant leading to the liquidity mirage the NY Fed has exposed. How did the two authors reach their conclusion, one which has been known to our readers for years?
Worse, the researchers "did not find any evidence that the liquidity mirage was more pronounced on Oct. 15 compared with our control days." In other words, courtesy of HFTs, multiple-sigma events like October 15are always just around the corner, and always threaten to unleash market chaos the moment some unexpected "shock variable" disturbs the artificial equilibrium created by countless HFT algos to give the impression of an deep, orderly market. In the aftermath of this report, one can be sure that the days of current market structure are numbered, and that the scene is now set to throw the book at the HFTs. The only thing that is missing is the appropriate catalyst. And what is better than an orchestrated, or ad hoc, market crash, one which exonerates the real culprit for the stock market bubble - the Federal Reserve - and unleashes populist anger by millions of investors who lose their net worth in an HFT instant, aimed squarely at the HFTs, and the 20-year-old math PhDs behind them? |
|||
| MOST CRITICAL TIPPING POINT ARTICLES THIS WEEK - Oct 18th, 2015 - Oct 24th, 2015 | |||
| BOND BUBBLE | 1 | ||
| RISK REVERSAL - WOULD BE MARKED BY: Slowing Momentum, Weakening Earnings, Falling Estimates | 2 | ||
| GEO-POLITICAL EVENT | 3 | ||
| CHINA BUBBLE | 4 | ||
| JAPAN - DEBT DEFLATION | 5 | ||
EU BANKING CRISIS |
6 |
||
CREDIT CONTRACTION II |
10-21-15 | 16 - Credit Contraction II |
|
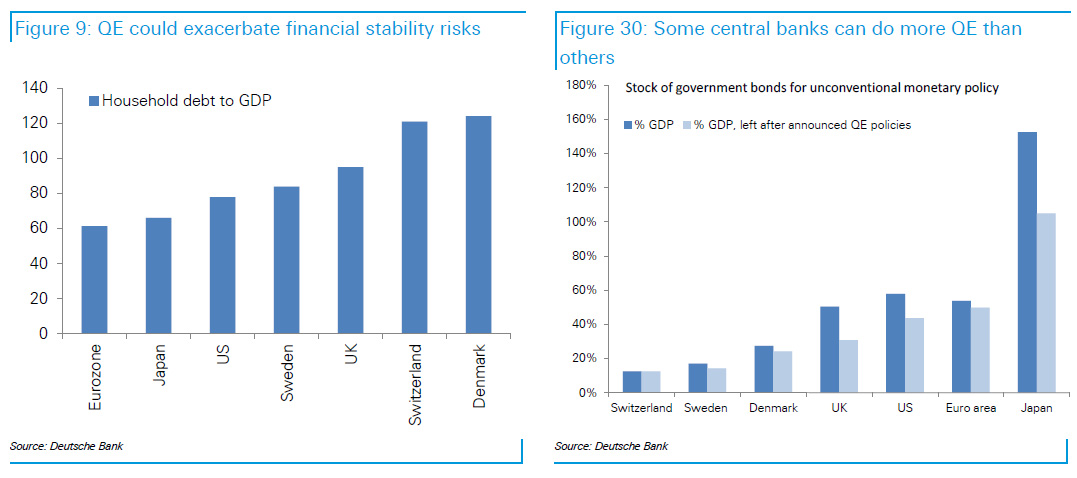
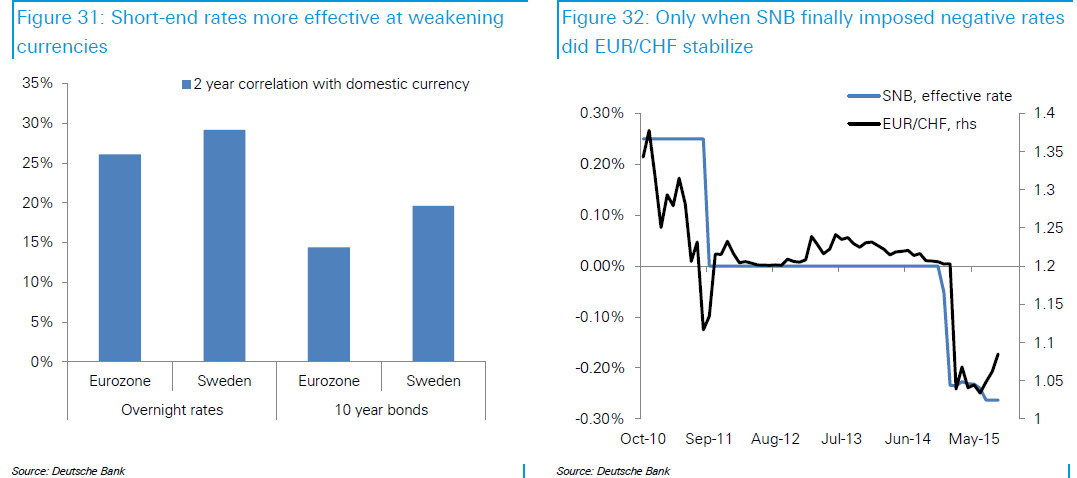
QE vs Negative Rates: A Cost-Benefit Analysis Of The Monetary Twilight ZoneExcerpted from Negative Rates versus QE, a cost benefit analysis If there is more room for policymakers to cut rates further into negative territory, what are the pros and cons versus other monetary policies? 1. Financial stability risks: Where an economy is highly leveraged or financial conditions loose, there may be an advantage to pursuing negative rates over asset purchases, at least in the short term. Asset purchases are designed to push down term premia and hence borrowing costs for the real economy. As we have seen, negative rates could actually help to reduce leverage by encouraging banks to raise borrowing costs. On the other hand, if central banks were to commit to keep rates negative for long periods, expectations of negative rates could become embedded and result in lower long term yields resulting in similar financial stability concerns. 2. Assets available for unconventional QE: Further cuts to deposit rates may be more attractive where an economy does not have enough assets to sustain a large-scale asset purchase program. In the case of Sweden, for example, the Riksbank asset purchase program will have bought 20% of outstanding Swedish government bonds by the end of the year. Switzerland’s outstanding stock of government debt is even smaller. This is particularly problematic where buying other assets would have unwanted side-effects, such as the Riksbank buying covered bonds and exacerbating housing market risks. In the Eurozone, despite the concerns voiced by some ECB members over liquidity in Eurozone government bond markets, the ECB has much more room on a relative basis to extend its asset purchase program. At the very least the ECB can extend the current purchase programme by 12 months to Sep-17 without expanding the range of eligible assets or changing other parameters of the programme10. A related but different concern would be where central bank balance sheets have become sufficiently large for them to become concerned about capital losses. This is only a theoretical constraint, as a central bank could in practice operate with negative capital. In the case of Switzerland, however, concern over losses arising from a large balance sheet played an important role in the decision to abandon the open ended FX intervention. 3. FX or credit conditions channel. Negative rates have tended to be a highly effective tool for weakening currencies. Short-end rates are more correlated to currency movements than long-end rates, likely because FX investors tend to fund positions using overnight or short-end rates rather than further down the curve (chart 31).
Negative rates have also proved to be more effective that outright currency intervention. The contrasting experiences of Switzerland and Denmark serve to underline this point. SNB’s approach of targeting the size rather than price of reserves failed to alleviate pressure on the EUR/CHF floor. It was only until the SNB finally cut rates into deeply negative territory that pressure on the Swiss franc has relented, and the currency has begun to depreciate. By contrast, the Nationalbank was able to effectively defend the peg between the Danish krone and euro by aggressively cutting rates at the same time as currency intervention.
Negative rates appear to be much less effective in relaxing credit conditions in the overall economy. As we have noted, the experience of the four economies under negative rates suggests that borrowing costs may actually rise, not fall, for households once negative rates are implemented. Moreover, insofar as markets do not expect negative rates to be permanent, pass-through into assets with longer maturities may be limited. Finally, as Praet has argued, the impact of asset purchases in reducing term premium and via the portfolio rebalancing channel is likely to be maximized when the central bank has reached a lower bound11. In the absence of a floor on front-end rates and the potential for further rate cuts the scope for potential capital gains on fixed rate assets reduces the incentive for investors to move further out along the maturity and credit spectrum. 4. Fragmentation: In the Eurozone case, deeply negative rates in combination with an active expansion of the ECB balance sheet may be additionally problematic. The excess reserves created via asset purchases are likely to flow back to banks in the core countries. This would imply that the burden of negative rates will be excessively borne by banks in the core countries. Making the deposit rates more negative would not necessarily incentivize banks in core countries to lend to banks in periphery as the opportunity cost for these banks will be the difference between market rates and the deposit facility rate rather than the absolute level of negative rates. This spread is already minimal and likely to get even smaller as excess liquidity increases. * * * In retrospect, when we said that NIRP is the functional equivalent of the the "Monetary Twilight Zone", we were right: not only is there no getting out, but once you are in absolutely nothing makes sense any more. Good luck to anyone who still believes that "fundamentals" matter when making financial decisions. 
|
|||
CREDIT CONTRACTION II |
10-20-15 | 16 - Credit Contraction II |
|
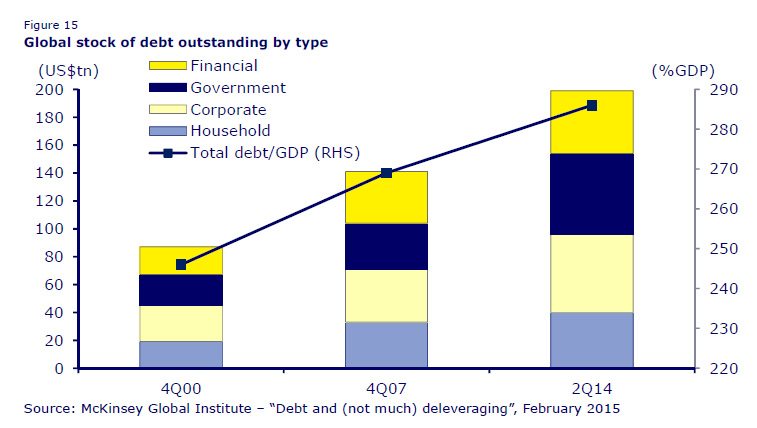
Source: Citi The core reason that velocity has continued to decline. The core reason is the excessive amount of debt in the system, an amount that has continued to grow since the financial crisis in 2008 as highlighted in a McKinsey report which attracted a lot of publicity when published earlier this year (see McKinsey Global Institute report “Debt and (not much) deleveraging”, February 2015). For the record, McKinsey estimated that aggregate global debt has grown by US$57tn from US$142tn in 2007 to US$199tn at the end of 2Q14, raising the ratio of global debt to GDP by 17 percentage points to 286% (see Figure 15).
The only way to get velocity to pick up in a benign way is to write off the debt by a meaningful amount. That would have helped in the 2008 global financial crisis if more losses had been imposed on creditors. There then would have been a V-shaped rebound in velocity similar to what happened in the Asian Crisis....
|
|||
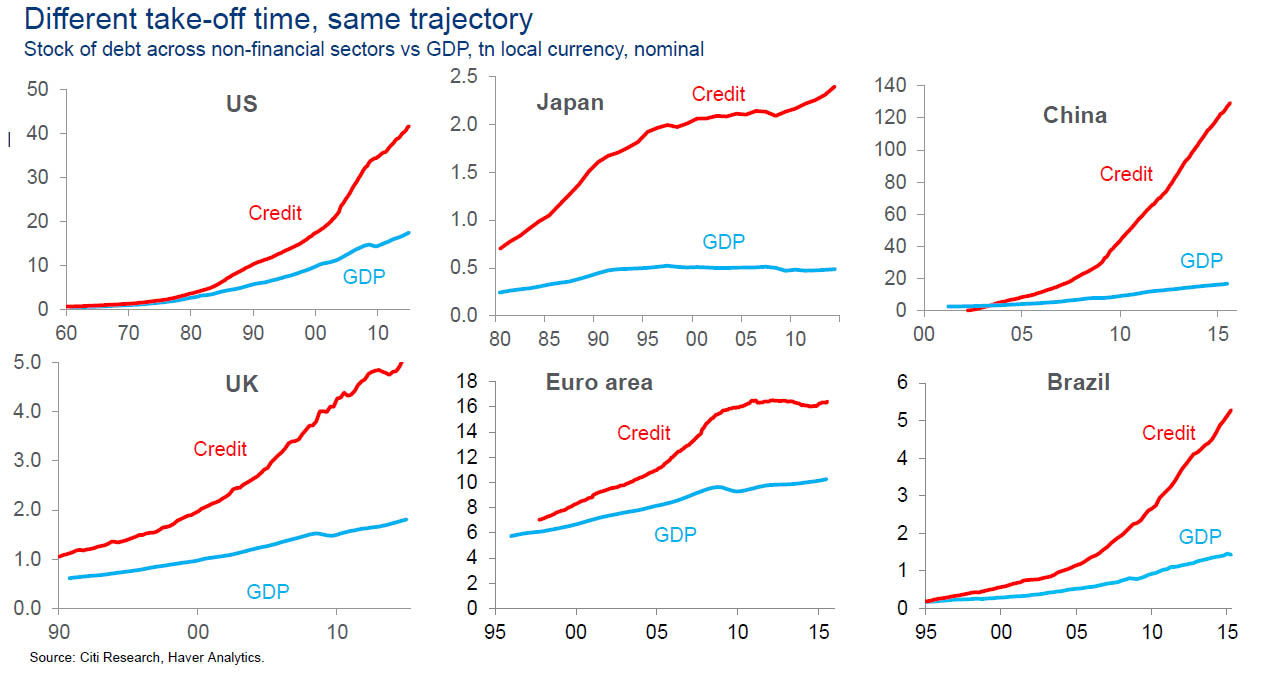
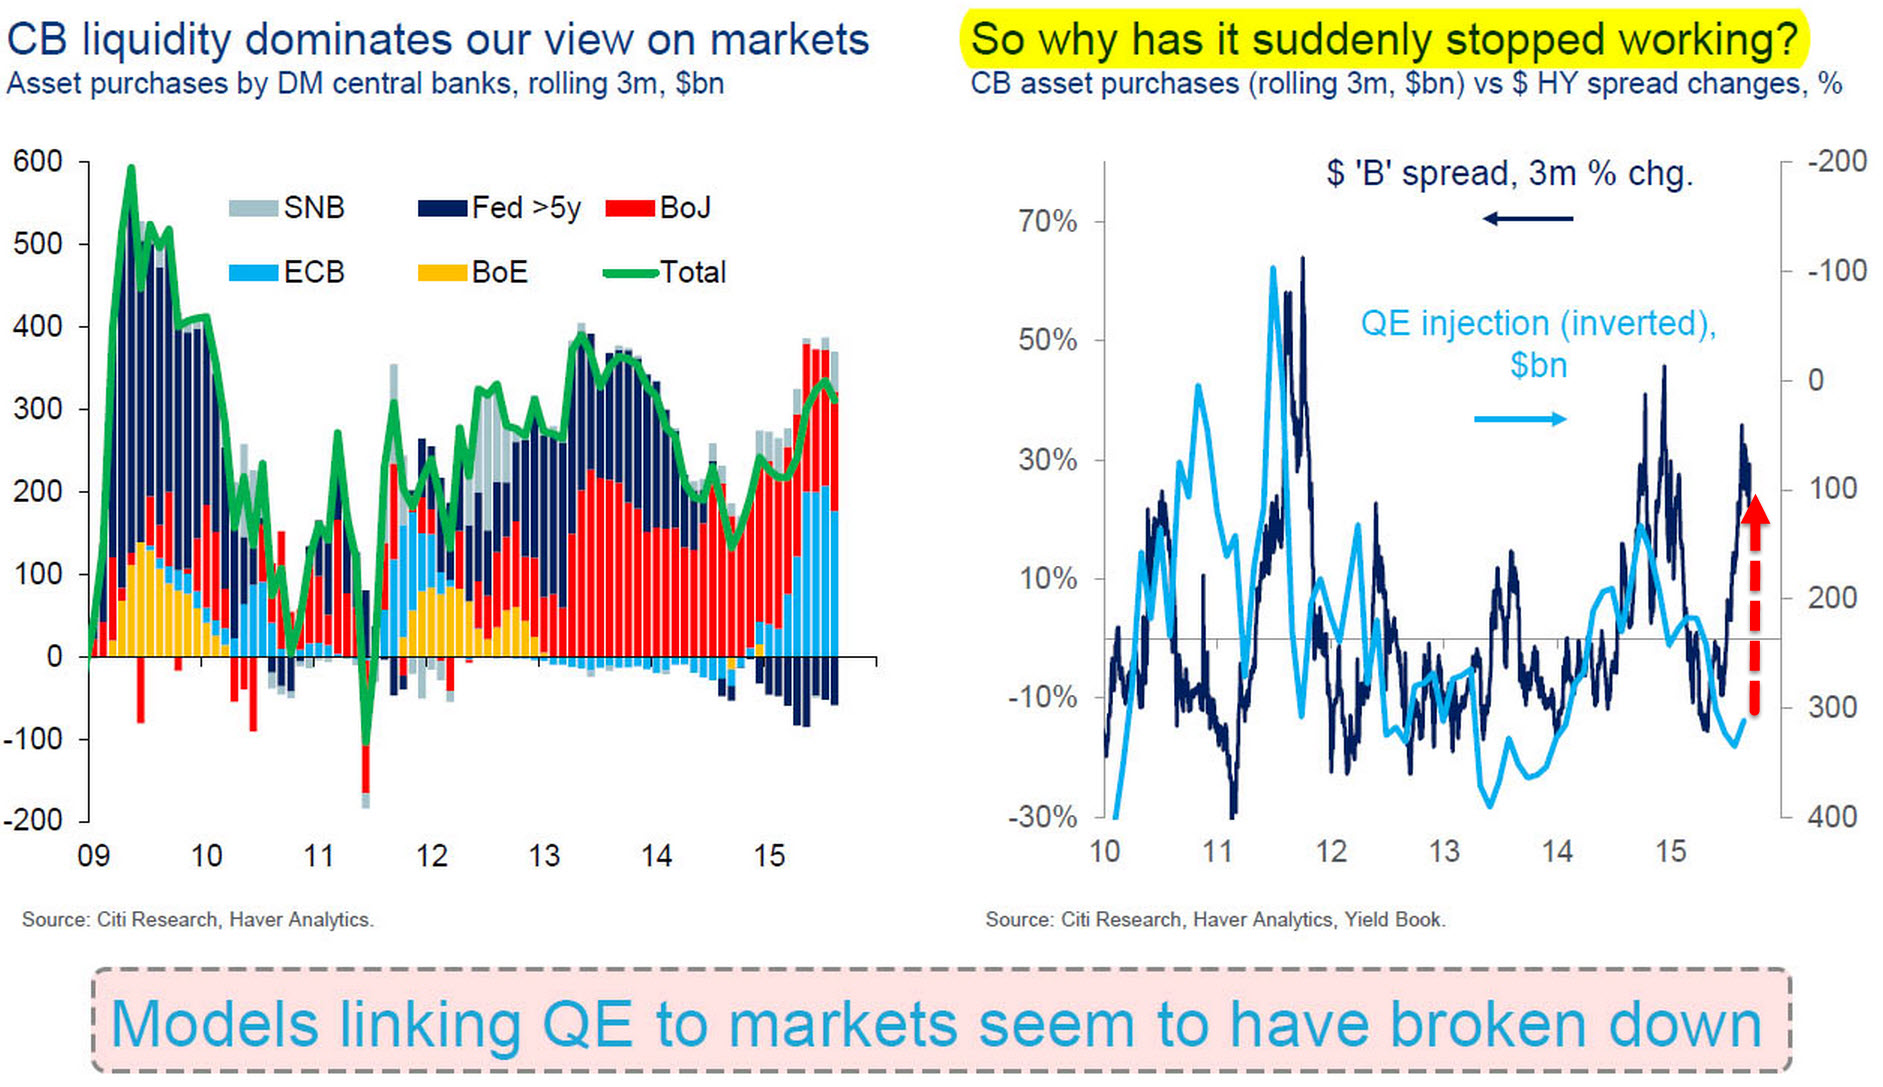
The World Hits Its Credit Limit, And The Debt Market Is Starting To Realize ThatOne month ago, when looking at the dramatic change in the market landscape when the first cracks in the central planning facade became evident and it appeared that central banks are in the process of rapidly losing credibility, and the faith of an entire generation of traders whose only trading strategy is to "BTFD", we presented a critical report by Citigroup's Matt King, who asked "has the world reached its credit limit" summarized the two biggest financial issues facing the world at this stage. The first is that even as central banks have continued pumping record amount of liquidity in the market, the market's response has been increasingly shaky (in no small part due to the surge in the dollar and the resulting Emerging Market debt crisis), and in the case of Junk bonds, a downright disaster. As King summarized it "models linking QE to markets seem to have broken down."
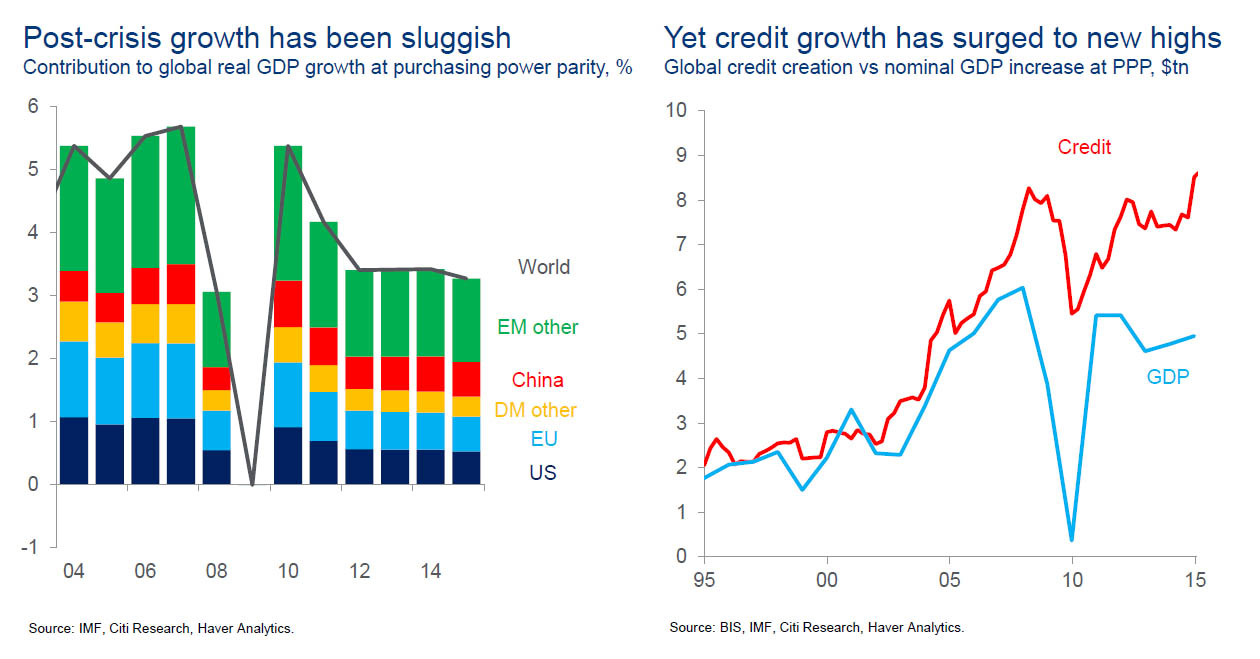
Needless to say this was bad news for everyone hoping that just a little more QE is all that is needed to return to all time S&P500 highs. And while this concern has faded somewhat in the past few weeks as the most violent short squeeze in history has lifted the market almost back to record highs even as Q3 earnings season is turning out just as bad, if not worse, as most had predicted, nothing has fundamentally changed and the fears over EM reserve drawdown will shortly re-emerge, once the punditry reads between the latest Chinese money creation and capital outflow lines. The second, and far greater problem, facing the world is precisely what the Fed and its central bank peers have been fighting all along: too much global debt accumulating an ever faster pace, while global growth is stagnant and in fact declining.
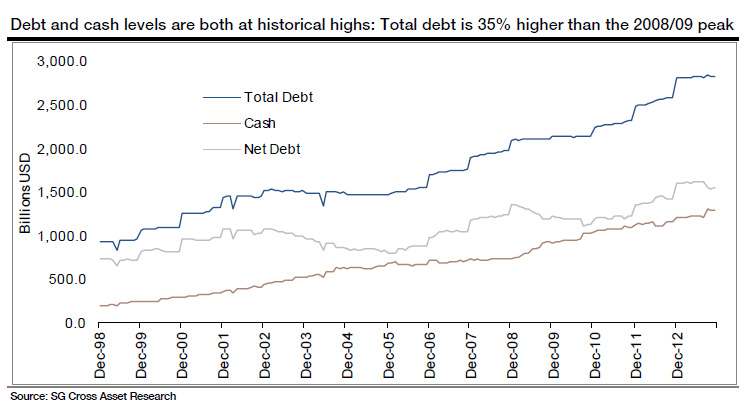
King's take: "there has been plenty of credit, just not much growth." Our take: we have - long ago - crossed the Rubicon where incremental debt results in incremental growth, and are currently in an unprecedented place where economic textbooks no longer work, and where incremental debt leads to a drop in global growth. Much more than ZIRP, NIRP, QE, or Helicopter money, this is the true singularity,because absent wholesale debt destruction - either through default or hyperinflation - the world is doomed to, first, a recession and then a depression the likes of which have never been seen. By buying assets and by keeping the VIX suppressed (for a phenomenal read on this topic we recommend Artemis Capital's "Volatility and the Allegory of the Prisoner’s Dilemma"), central banks are only delaying the inevitable. The bottom line is clear: at the macro level, the world is now tapped out, and there are virtually no pockets for credit creation left at the consolidated level, between household, corporate, financial and government debt. What about at the micro level, because while the world has clearly hit its debt-saturation point, corporations - at least the highly rated ones - seem to have no problems with accessing debt markets and raising capital, even if the biggest use of proceeds is stock buybacks, thereby creating a vicious, Munchausenesque close loop scheme, in which the rising stock prices courtesy of more debt, is giving debt investors the impression that the company is far healthier than it actually is precisely because it has more, not less, debt! The reality, as we first showed in January of 2014, is that for all the talk of "fortress" balance sheets, and record cash buffers, the debt build up among US corporations has more than surpassed the increase in cash. In fact, as of early 2014, total debt was 35% higher than its prior peak, as was net debt.
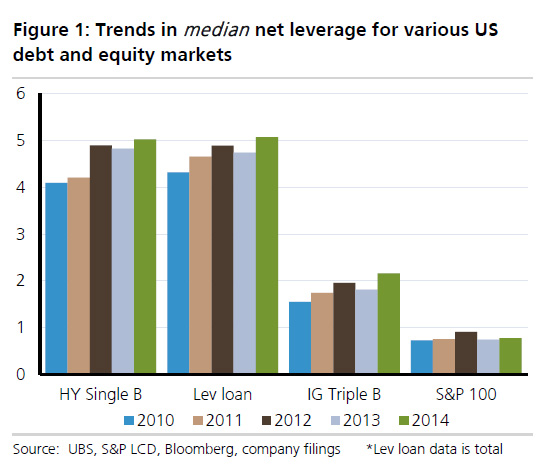
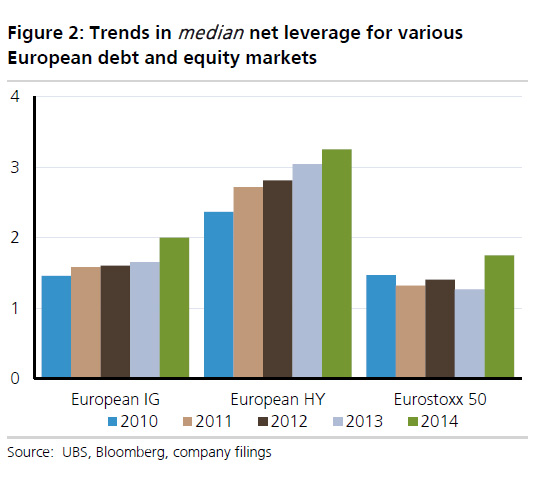
Therefore, to us, the answer whether debt markets are once again approaching (or have crossed into) full capacity was clear; just look at what happened to IBM when, as we predicted, it bought back so much stock its investment grade rating was put in jeopardy and the company has seen its stock languish ever since unable to lever up any more just to repurchase its own stock. Others, of the "more serious people" variety, have finally caught up, and as UBS' Matt Mish asks in a note late last week, "Releveraging: are debt markets approaching full capacity?" His take:
It should be clear to most what this means, but since "most" haven't seen a rate hike in their Wall Street careers, here is UBS' summary "This is textbook later stages of the credit cycle." * * * Having seen the light, Mish asks why what is now so obvious to him, is so confusing to everyone else:
For those who missed our preview of all of this from April 2012 "How The Fed's Visible Hand Is Forcing Corporate Cash Mismanagement", here is UBS' far simpler summary which even 17-year-old hedge fund managers should get:
And that is the real countdown, because while the Fed may or may not have any credibility left, the only thing that matters is what is left of the once proud "bond vigilantes", virtually all of whom have been euthanized by the Fed's steamrolling of every last fundamental tenet of the market held dear by the bond trades and analysts of the world. According to UBS this, too, is now coming to an end, and even in IG the relentless issuance of one record debt deal after another, will soon hit a brick wall. That, coupled with the peak debt at the macro level described on top, will be the catalyst for the next phase in the evolution of centrally-planned capital "markets", whatever it may be. |
|||
| TO TOP | |||
| MACRO News Items of Importance - This Week | |||
GLOBAL MACRO REPORTS & ANALYSIS |
|||
US ECONOMIC REPORTS & ANALYSIS |
|||
| CENTRAL BANKING MONETARY POLICIES, ACTIONS & ACTIVITIES | |||
| Market | |||
| TECHNICALS & MARKET |
|
||
TECHNICALS & MARKET How The Entire Short Volatility ETF Complex Could Be Wiped Out OvernightSubmitted by Tyler Durden on 10/20/2015 - 17:40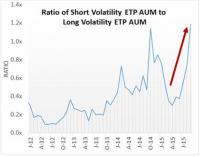
The recent bi-polar behavior in spot-VIX empirically supports the theory that a structural weakness now exists in this market by crowding of short volatility players. Short volatility sellers ridicule the fact that the prospectus for the iPath Long Volatility ST Index (VXX) clearly states that the ETF has an expected long-term return of zero.They should ask themselves, is it better to know with certainty you are going to go bankrupt slowly, or be completely ignorant of the fact you will go bankrupt suddenly. Credit Markets Ain't Buying It, Warn VIX Should Be At 25Submitted by Tyler Durden on 10/20/2015 - 15:05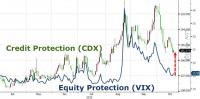
On the basis of the fundamental economic backdrop, Goldman Sachs sees VIX fair-value at least 19, with low-teens more consistent with ISM in the upper 50s (not the current sub-50 levels). However, credit (and FX) protection markets imply significantly more risk ahead with CDX HY stalled at 2month lows (while VIX hits 3 month lows). Given historical relationships, credit markets suggest a VIX of 25 is more consistent with reality(especially as Skew tail risk rolls down to normal risk). |
10-21-15 |
STUDIES | |
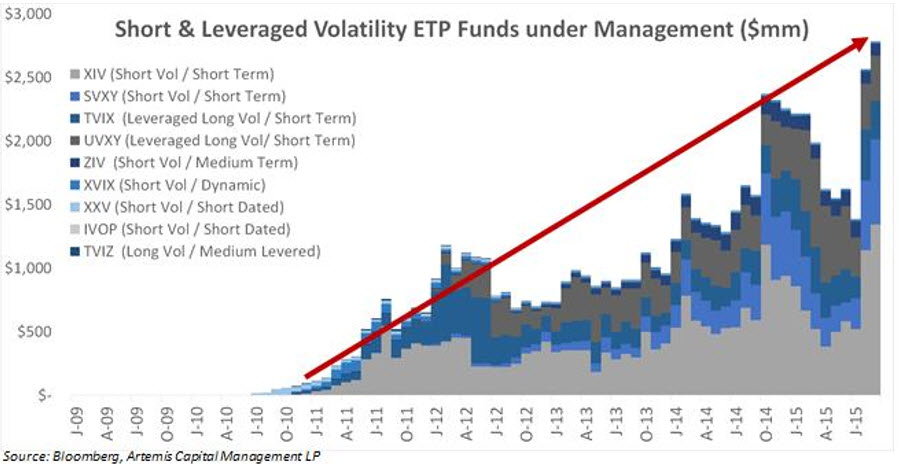
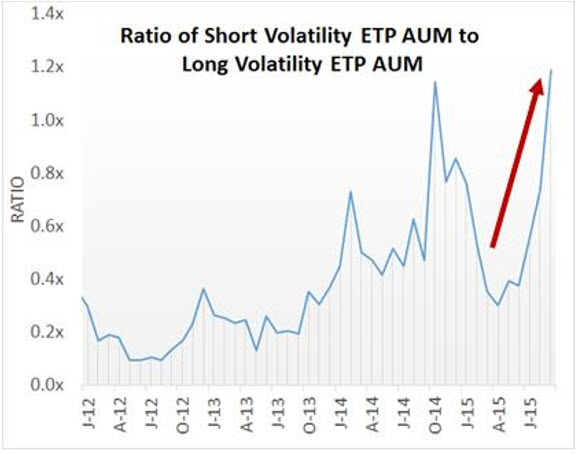
Submitted by Tyler Durden on 10/20/2015 How The Entire Short Volatility ETF Complex Could Be Wiped Out OvernightExcerpted from Artemis Capital Management letter to investors, Global central banking has artificially incentivized bets on mean reversion resulting in tremendous demand to short volatility. The growth of short volatility exchange traded products (“ETPs”) since 2012 is nothing short of extraordinary and at the end of August, total short volatility assets exceeded long for only the second time in history. The rise of this short complex is intrinsically linked to the recent schizophrenic behavior of the VIX and adds significant shadow convexity to markets.
Velocity Shares Daily Inverse VIX (“XIV”) is the largest of these short VIX ETPs and has a cult-like following among day traders. Although the product has gained +111% since 2012, when decomposed on a risk-adjusted basis, it basically resembles a 3x levered position in the S&P 500 index with more risk. As the short and leveraged volatility complex becomes more dominant it is contributing to dangerous self-reinforcing feedback loops with unknowable consequences.
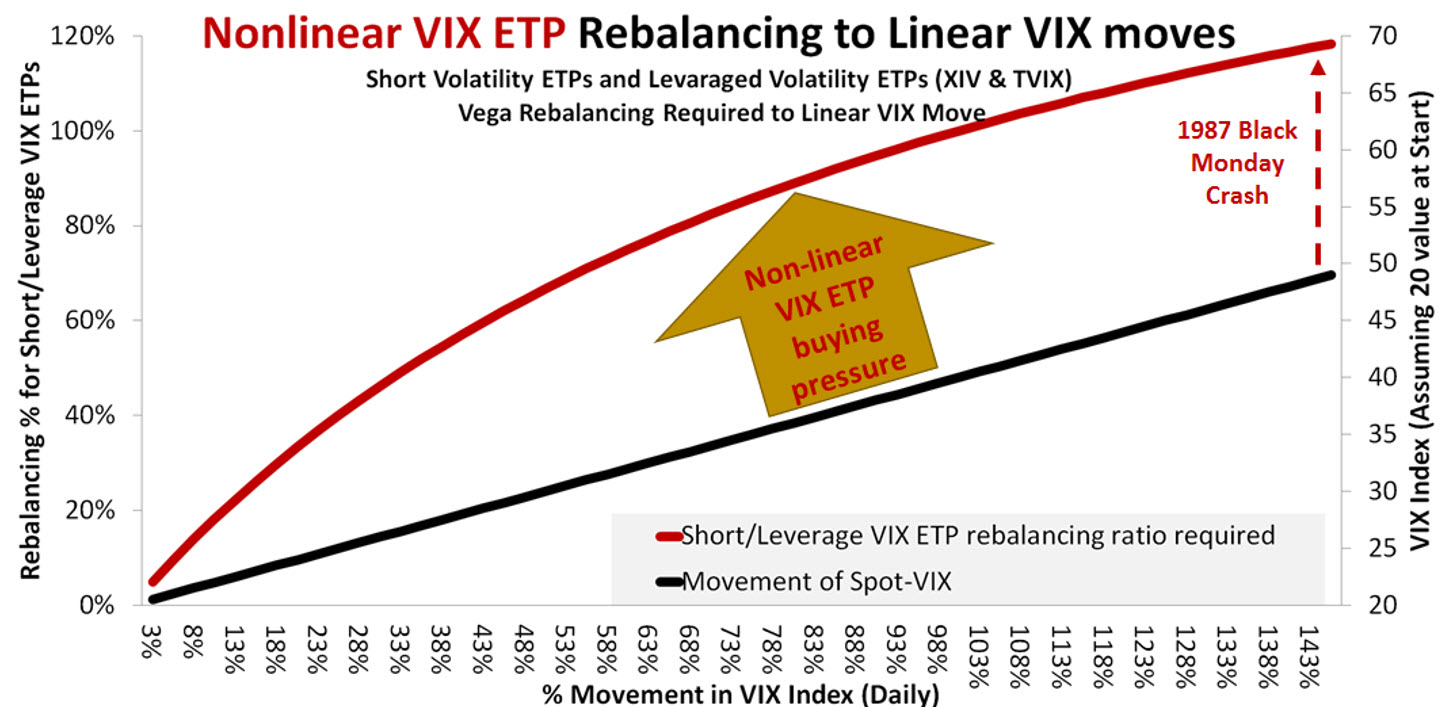
Many retail investors simply do not understand that short and leveraged volatility ETPs rebalance non-linearly (see below). To the casual observer it may appear that short and long assets counterbalance one another but this is not the case. For example if the first two VIX futures move 20% higher the short volatility ETP providers must buy an estimated 33% more volatility (vs. 25% for long) to balance that exposure. The first rule of derivatives hedging is that you never hedge a non-linear risk with a linear tool. The mismatch means a large move in spot-volatility in either direction requires excessive buying or selling pressure whenever short volatility assets are dominant. Therein lies the problem. Falling volatility begets falling volatility and rising volatility begets rising volatility.
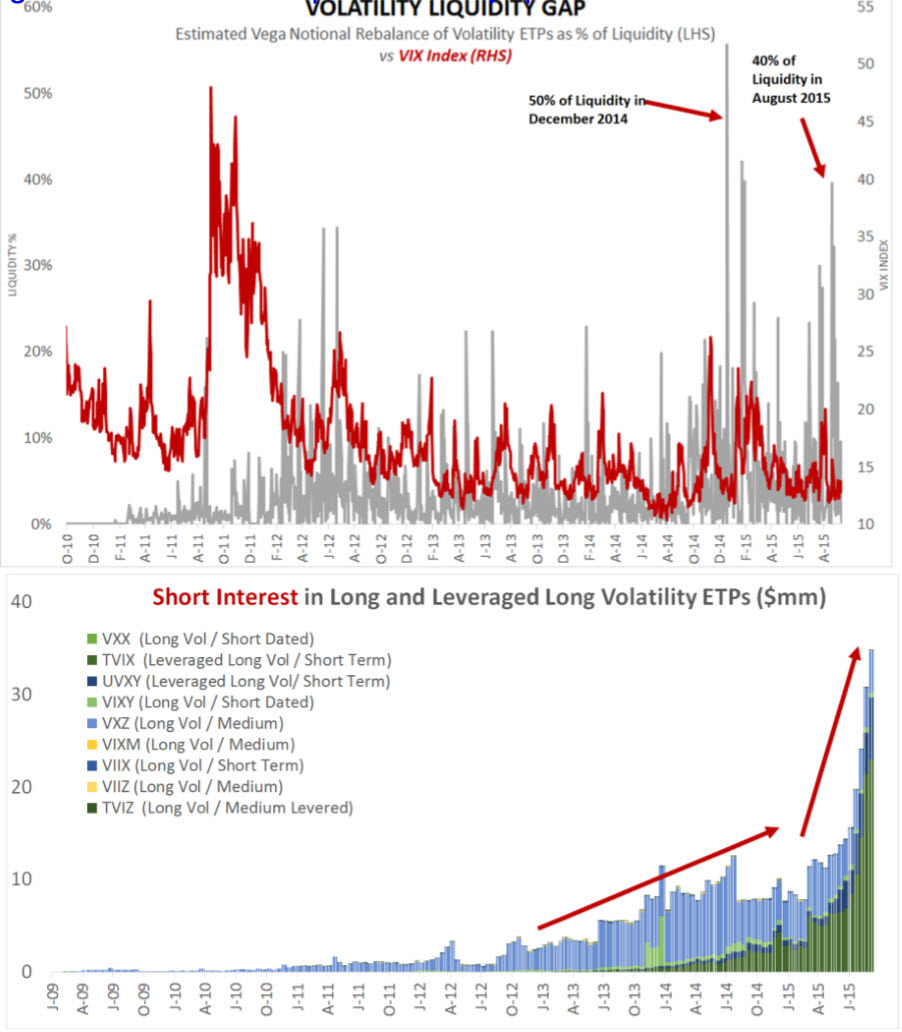
The great unknown is that this massive short volatility animal that appears tame given a regular diet of central bank liquidity may turn wild when that liquidity is removed. The wrong ‘risk-off’ event may expose a hidden liquidity gap in the short VIX complex that could unleash a monster. Artemis has attempted to quantify this theoretical liquidity gap by gauging the percentage of VIX open interest and volume required by exchange-traded products for rebalancing.
During recent market stress points such as October 2014 and August 2015 the short and leveraged volatility ETP complex required upward of 40-50% of the total liquidity of VIX futures as measured by average trading volume and open interest. Consider that the largest one day VIX move in history was the +64% jump that occurred on February 27, 2007 when the VIX went from 11.15 to 18.31. This was not even a period of high financial stress! If a similar volatility spike occurred today, given the current size of the short VIX complex, the ETPs by themselves would require an estimated 95% of the liquidity for rebalancing! This would drive the price of the VIX futures up further exacerbating the nonlinearity. The VIX futures market may struggle to absorb the demand for long volatility. Dealers seeking to plug the liquidity gap would purchase S&P 500 options and forward variance swaps. The excess buying pressure exerted from the short-volatility complex would then push spot-VIX higher contributing to panic selling in the underlying S&P 500 index and a vicious and self-reinforcing cycle of fear followed by horror. The recent bi-polar behavior in spot-VIX empirically supports the theory that a structural weakness now exists in this market by crowding of short volatility players. The shot across the bow for the short volatility complex came during the August 24th correction when SPX futures opened limit down and the CBOE struggled for 30 minutes to calculate the VIX. By the time the VIX level was finally calculated it opened 25 points higher at 53.29, before falling to 28 intra-day, then rebounding to 40.74 by the close, with the S&P 500 index down -3.9%. At the time of the crash, the assets in long VIX ETPs outnumbered shorts on a two to one basis however, the complex still required an estimated 25% to 46% of market liquidity between August 21 and 24th. Markets delivered historic volatility-of-volatility despite relatively mild historical declines in the S&P 500 index. It is important to understand that markets have experienced much more dramatic oneday losses across history than what occurred in August 2015. For example on August 8th 2011, the market suffered a oneday decline of -6.7%. September to December 2008 experienced ten declines of more than -5%, and on Black Monday 1987, the market fell an incredible -20.5% in one day. During the Black Monday 1987 crash implied volatility in the S&P 100 index more than tripled going from 36.37 to 150.19. If the VIX experienced any of these historic moves at current levels of short convexity the entire $2bn+ short volatility ETP complex would likely be wiped out overnight. Short volatility sellers ridicule the fact that the prospectus for the iPath Long Volatility ST Index (VXX) clearly states that the ETF has an expected long-term return of zero. They should ask themselves, is it better to know with certainty you are going to go bankrupt slowly, or be completely ignorant of the fact you will go bankrupt suddenly. |
|||
Submitted by Tyler Durden on 10/20/2015 Credit Markets Ain't Buying It, Warn VIX Should Be At 25On the basis of the fundamental economic backdrop, Goldman Sachs sees VIX fair-value at least 19, with low-teens more consistent with ISM in the upper 50s (not the current sub-50 levels). However, credit (and FX) protection markets imply significantly more risk ahead with CDX HY stalled at 2month lows (while VIX hits 3 month lows). Given historical relationships, credit markets suggest a VIX of 25 is more consistent with reality(especially as Skew tail risk rolls down to normal risk). Credit Risk has not normalized... And while FX and Oil volatility has fallen, it has not fallen as much as equity volatility... Leaving VIX a clear outlier. As we noted previously, The U.S. economic landscape & cross asset metrics both suggest a VIX in the high-teens.
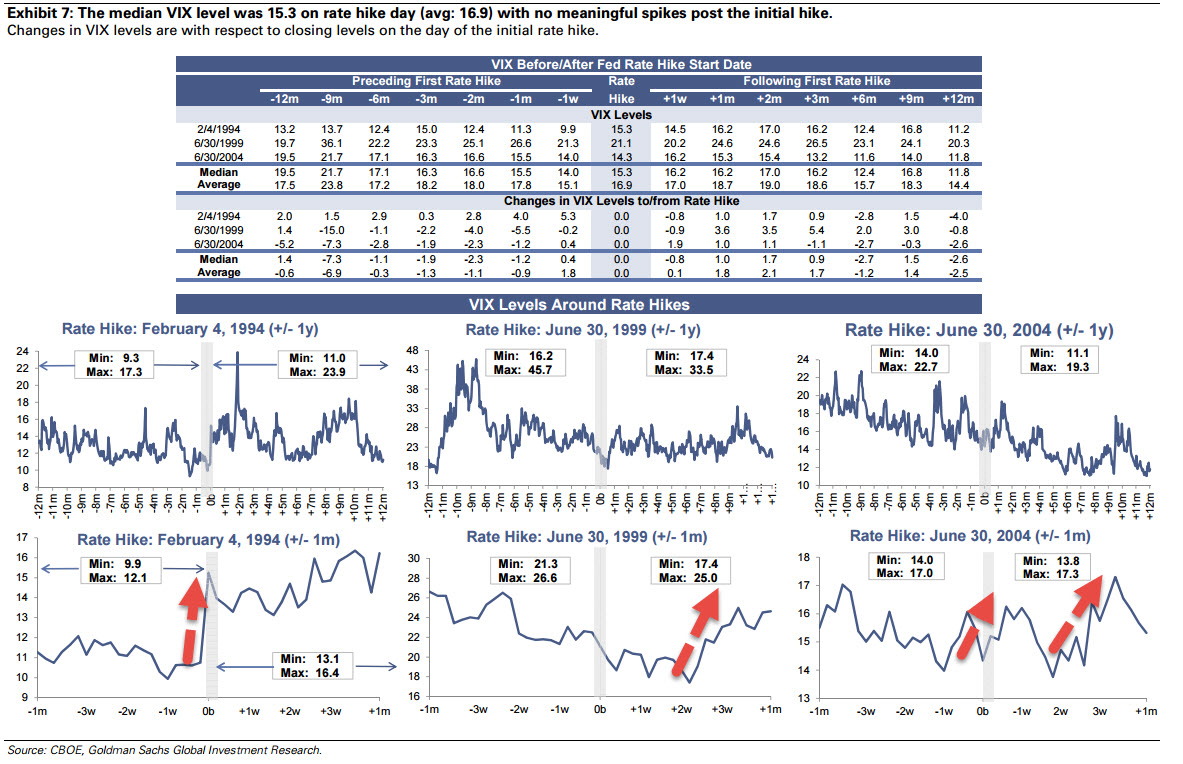
And the impact of rate hikes on volatility has historically been modestly higher
Charts: Bloomberg and Goldman Sachs |
|||
Artemis Q32015 Volatility and Prisoners Dilemma by lcmgroupe � |
|||
| COMMODITY CORNER - AGRI-COMPLEX | PORTFOLIO | ||
| SECURITY-SURVEILANCE COMPLEX | PORTFOLIO | ||
| THESIS - Mondays Posts on Financial Repression & Posts on Thursday as Key Updates Occur | |||
| 2015 - FIDUCIARY FAILURE | 2015 | THESIS 2015 |  |
| 2014 - GLOBALIZATION TRAP | 2014 |  |
|
 |
|||
|
2013 2014 |
 |
||
FINANCIAL REPRESSION
LELAND MILLER Talks QUALITY OF CHINA'S ECONOMIC REPORTING FRA Co-Founder Gordon T. Long interviews Leland miller, the president of the china beige book international and discusses financial repression in the context of the Chinese economy. He describes himself as a Lifelong china watcher who decided to do something about the complete lack of data in china. “One of the things that the china beige book plans to do is to give people a real picture of not just the growth dynamics, but also the labor market, the credit dynamics, the macro implications of Chinese growth, indications of future Chinese demand, implications of commodity markets around the world, we try to give the people a much better picture on what’s actually happening instead of just relying on official data and press release”. FINANCIAL REPRESSION Leland describes the Chinese reform as a reversal of financial repression and this repression in the context of the Chinese economy is the oppression of consumers and households by state organizations through its economic systems. “It means reversing this long time economic model, where the state will profit through the economic system at the expense of the consumers and household, and one of the things that the new leadership is intent on doing in order to create consumption is to empower consumers, so they spend more and stop empowering state organizations which are fuelling the overcapacity and the massive debt bubble”. What should investor know about china? He explains the biggest misconception concerning the Chinese economy is believing the GDP tells you much about how china is doing. “It is a broad, blunt indicator that doesn’t measure productive growth or credit dynamics”. On some of the challenges of getting reliable data in china, Leland explains that he and his team had to ask Chinese firms and consumers on ground what is happening in the country, and set up a number of polling units across sectors in order to get reliable and accurate information. Economic trends in china “For years we have been talking about the Chinese slowdown; it’s inevitable, despite the fact that the economy has been slowing”. He goes on to explain that although the market sentiment has gone from optimism to “Armageddon” in recent months, the actual data is at odds with these sentiments. As a result of china’s economic slowdown, there is great vulnerability among emerging markets. Now, the reason for this is that for years these markets have relied on china’s demand without factoring the likelihood of a decline or certainty of a decline in china’s demand. On China’s view of America, Leland has this to say “The Chinese look at America as a model that they are interested in taking pieces from; they like the dynamism of the economy and the global status. On one hand, they see us as a model to learn a lot of things from but also as a serious threat that is looking to constrain their inevitable and ultimate rise”. Abstract written by chukwuma uwaga [email protected]
|
10-19-15 | ||
2011 2012 2013 2014 |
 |
||
| THEMES - Normally a Thursday Themes Post & a Friday Flows Post | |||
I - POLITICAL |
|||
| CENTRAL PLANNING - SHIFTING ECONOMIC POWER - STATISM | THEME | ||
- - CORRUPTION & MALFEASANCE - MORAL DECAY - DESPERATION, SHORTAGES. |
THEME |  |
|
| - - SECURITY-SURVEILLANCE COMPLEX - STATISM | M | THEME | |
| - - CATALYSTS - FEAR (POLITICALLY) & GREED (FINANCIALLY) | G | THEME | |
II-ECONOMIC |
|||
| GLOBAL RISK | |||
| - GLOBAL FINANCIAL IMBALANCE - FRAGILITY, COMPLEXITY & INSTABILITY | G | THEME | |
| - - SOCIAL UNREST - INEQUALITY & A BROKEN SOCIAL CONTRACT | US | THEME | |
| - - ECHO BOOM - PERIPHERAL PROBLEM | M | THEME | |
| - -GLOBAL GROWTH & JOBS CRISIS | |||
| - - - PRODUCTIVITY PARADOX - NATURE OF WORK | THEME | MACRO w/ CHS |
|
| - - - STANDARD OF LIVING - EMPLOYMENT CRISIS, SUB-PRIME ECONOMY | US | THEME | MACRO w/ CHS |
| STANDARD OF LIVING - SUB-PRIME ECONOMY | US | THEME | MACRO w/ CHS |
III-FINANCIAL |
|||
| FLOWS -FRIDAY FLOWS | MATA RISK ON-OFF |
THEME |  |
| CRACKUP BOOM - ASSET BUBBLE | THEME | ||
| SHADOW BANKING - LIQUIDITY / CREDIT ENGINE | M | THEME | |
| GENERAL INTEREST |
|
||
| STRATEGIC INVESTMENT INSIGHTS - Weekend Coverage | |||
|
SII | ||
|
SII | ||
|
SII | ||
|
SII | ||
| TO TOP | |||


Read More - OUR RESEARCH - Articles Below

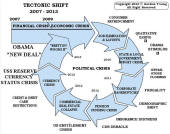
Tipping Points Life Cycle - Explained
Click on image to enlarge
TO TOP
 |
YOUR SOURCE FOR THE LATEST THINKING & RESEARCH
|
�
TO TOP