|
JOHN RUBINO'SLATEST BOOK |
||||||||||||||||||||||||||||||||||||||||||||||||||||||||||||||||||||||||||||||||||||||||||||||||||||||||||||||||||||||||||||||||||||||||||||||||||||||||||||||||||||||||||||||||||||||||||||||||||||||||||||||||||||||||||||||||||||||||||||||||||||||||||||||||||
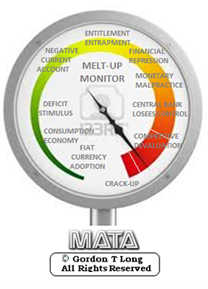
"MELT-UP MONITOR "
Meltup Monitor: FLOWS - The Currency Cartel Carry Cycle - 09 Dec 2013 Meltup Monitor: FLOWS - Liquidity, Credit & Debt - 04 Dec 2013 Meltup Monitor: Euro Pressure Going Critical - 28- Nov 2013 Meltup Monitor: A Regression-to-the-Exponential Mean Required - 25 Nov 2013
|

![]()
"DOW 20,000 "
Lance Roberts Charles Hugh Smith John Rubino Bert Dohman & Ty Andros
|
HELD OVER
Currency Wars
Euro Experiment
Sultans of Swap
Extend & Pretend
Preserve & Protect
Innovation
Showings Below
"Currency Wars "
|
"SULTANS OF SWAP" archives open ACT II ACT III
ALSO Sultans of Swap: Fearing the Gearing! Sultans of Swap: BP Potentially More Devistating than Lehman! |
"EURO EXPERIMENT"
archives open EURO EXPERIMENT : ECB's LTRO Won't Stop Collateral Contagion!
EURO EXPERIMENT: |
![]()
"INNOVATION"
archives open |

"PRESERVE & PROTE CT"
archives open |

RECAP
Weekend Oct. 4th, 2015
Follow Our Updates
onTWITTER
https://twitter.com/GordonTLong
AND FOR EVEN MORE TWITTER COVERAGE
ANNUAL THESIS PAPERS
FREE (With Password)
THESIS 2010-Extended & Pretend
THESIS 2011-Currency Wars
THESIS 2012-Financial Repression
THESIS 2013-Statism
THESIS 2014-Globalization Trap
THESIS 2015-Fiduciary Failure
NEWS DEVELOPMENT UPDATES:
FINANCIAL REPRESSION
FIDUCIARY FAILURE
WHAT WE ARE RESEARCHING
2015 THEMES
SUB-PRIME ECONOMY
PENSION POVERITY
WAR ON CASH
ECHO BOOM
PRODUCTIVITY PARADOX
FLOWS - LIQUIDITY, CREDIT & DEBT
GLOBAL GOVERNANCE
- COMING NWO
WHAT WE ARE WATCHING
(A) Active, (C) Closed
MATA
Q3 '15- Chinese Market Crash
(A)
Q3 '15-
GMTP
Q3 '15- Greek Negotiations
(A)
Q3 '15- Puerto Rico Bond Default
MMC
OUR STRATEGIC INVESTMENT INSIGHTS (SII)
NEGATIVE-US RETAIL
NEGATIVE-ENERGY SECTOR
NEGATIVE-YEN
NEGATIVE-EURYEN
NEGATIVE-MONOLINES
POSITIVE-US DOLLAR
ARCHIVES
| SEPTEMBER | ||||||
| S | M | T | W | T | F | S |
| 1 | 2 | 3 | 4 | 5 | ||
| 6 | 7 | 8 | 9 | 10 | 11 | 12 |
| 13 | 14 | 15 | 16 | 17 | 18 | 19 |
| 20 | 21 | 22 | 23 | 24 | 25 | 26 |
| 27 | 28 | 29 | 30 | 1 | 2 | 3 |
KEY TO TIPPING POINTS |
| 1- Bond Bubble |
| 2 - Risk Reversal |
| 3 - Geo-Political Event |
| 4 - China Hard Landing |
| 5 - Japan Debt Deflation Spiral |
| 6- EU Banking Crisis |
| 7- Sovereign Debt Crisis |
| 8 - Shrinking Revenue Growth Rate |
| 9 - Chronic Unemployment |
| 10 - US Stock Market Valuations |
| 11 - Global Governance Failure |
| 12 - Chronic Global Fiscal ImBalances |
| 13 - Growing Social Unrest |
| 14 - Residential Real Estate - Phase II |
| 15 - Commercial Real Estate |
| 16 - Credit Contraction II |
| 17- State & Local Government |
| 18 - Slowing Retail & Consumer Sales |
| 19 - US Reserve Currency |
| 20 - US Dollar Weakness |
| 21 - Financial Crisis Programs Expiration |
| 22 - US Banking Crisis II |
| 23 - China - Japan Regional Conflict |
| 24 - Corruption |
| 25 - Public Sentiment & Confidence |
| 26 - Food Price Pressures |
| 27 - Global Output Gap |
| 28 - Pension - Entitlement Crisis |
| 29 - Central & Eastern Europe |
| 30 - Terrorist Event |
| 31 - Pandemic / Epidemic |
| 32 - Rising Inflation Pressures & Interest Pressures |
| 33 - Resource Shortage |
| 34 - Cyber Attack or Complexity Failure |
| 35 - Corporate Bankruptcies |
| 36 - Iran Nuclear Threat |
| 37- Finance & Insurance Balance Sheet Write-Offs |
| 38- Government Backstop Insurance |
| 39 - Oil Price Pressures |
| 40 - Natural Physical Disaster |
Reading the right books?
No Time?
We have analyzed & included
these in our latest research papers Macro videos!
OUR MACRO ANALYTIC
CO-HOSTS
John Rubino's Just Released Book
Charles Hugh Smith's Latest Books


Our Macro Watch Partner
Richard Duncan Latest Books
MACRO ANALYTIC
GUESTS
F William Engdahl


OTHERS OF NOTE
Book Review- Five Thumbs Up
for Steve Greenhut's Plunder!


![]()
TODAY'S TIPPING POINTS
|
Have your own site? Offer free content to your visitors with TRIGGER$ Public Edition!
Sell TRIGGER$ from your site and grow a monthly recurring income!
Contact [email protected] for more information - (free ad space for participating affiliates).
HOTTEST TIPPING POINTS |
Theme Groupings |
||
We post throughout the day as we do our Investment Research for: LONGWave - UnderTheLens - Macro
|
|||
|
MOST CRITICAL TIPPING POINT ARTICLES TODAY
|
|
||
| MOST CRITICAL TIPPING POINT ARTICLES THIS WEEK -Sept 27th, 2015 - Oct 3rd, 2015 | |||
| BOND BUBBLE | 1 | ||
| RISK REVERSAL - WOULD BE MARKED BY: Slowing Momentum, Weakening Earnings, Falling Estimates | 2 | ||
| GEO-POLITICAL EVENT | 3 | ||
| CHINA BUBBLE | 4 | ||
| JAPAN - DEBT DEFLATION | 5 | ||
EU BANKING CRISIS |
6 |
||
SOVEREIGN DEBT CRISIS |
7- Sovereign Debt Crisis |
||
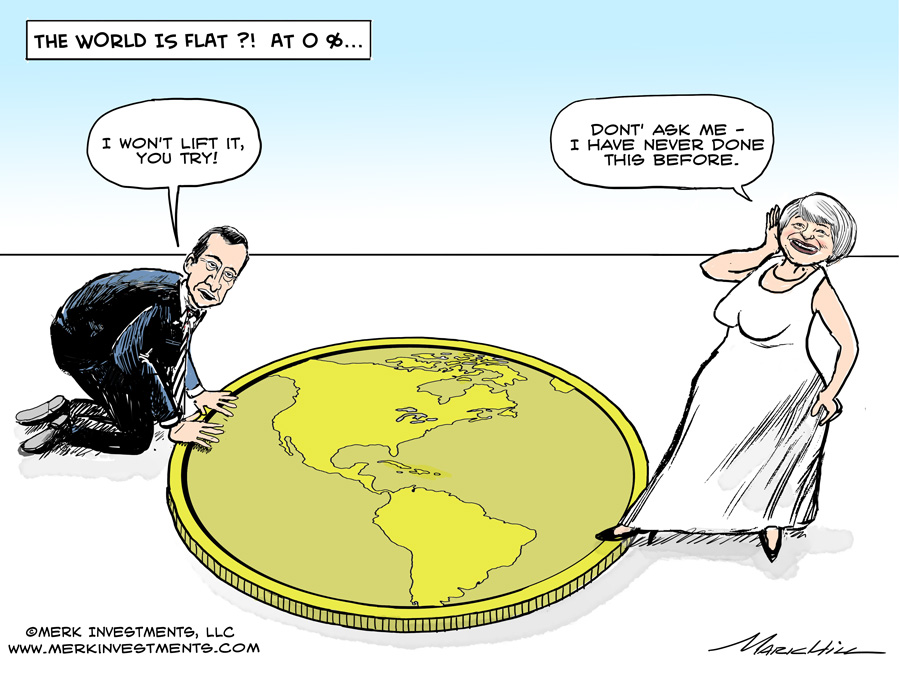
All Bad at 0%? 09-29-15 Axel Merk, Merk Investments We call on central banks to abolish their zero interest rate policy (ZIRP) framework before more harm is done. In our assessment, ZIRP is bad for all stakeholders and may even lead to war.
ZIRP: Bad for Business? ZIRP: Bad for Investors? We believe that until early August this year, investors generally "bought the dips" out of concern of missing out on rallies. Now, they may be "selling the rallies" as they scramble to preserve their paper gains. This process is driven by the Fed's desire to pursue an "exit." For more details on this, please see our recent Merk Insight "Lowdown on Rate Hikes." But it's not just bad because asset prices might crumble again after their meteoric rise; it's bad because, in our analysis, ZIRP has driven fundamental analysts to the sideline. For anecdotal evidence, look no further than the decision by Barron's Magazine to kick Fred Hickey (who may well be one of the best analysts of our era) out of the Barron's Roundtable. Instead, money looks to be flocking towards investment strategies based on momentum investing, a strategy that works until it doesn't. Again, ZIRP gives capitalism a bad name because we feel it disrupts efficient capital allocation. ZIRP: Bad for Main Street? Low interest rates may not even be good for home buyers: it may sound attractive to have low financing cost, but the public appears to slowly wake up to the fact that when rates are low, prices are higher: be that the prices of college tuition or homes. It's all great to have high home prices when you are a home owner, but it's not so great when you are trying to buy your first home. ZIRP: Bad for Price Stability? ZIRP: Bad for Politics? "monetary policy focuses on the amount of credit available in the economy; in contrast, fiscal policy - through tax and regulatory policy - focuses on how this credit gets allocated" If the Fed now allocates money to a specific sector of the economy, say, the mortgage market by buying Mortgage Backed Securities (MBS), they meddle in politics. Calls to "audit the Fed" are likely a direct result of the Fed having overstepped their authority, increasingly blurring the lines between the Fed and Congress. More importantly, the U.S., just like Europe and Japan, face important challenges that in our opinion can neither be outsourced, nor solved by central banks in general or ZIRP in particular. "Central banks can provide liquidity, but not solvency." In essence, it means central banks can buy time. But what happens when central banks buy a lot of time and underlying problems are not fixed? In our assessment, it means that the public gets antsy, gets upset. When problems persist for many years the public demands new solutions. But because monetary policy is too abstract of an issue for most, they look for solutions elsewhere, providing fertile ground for populist politicians. Here are just a few prominent political figures that have thrived due to public frustration with the status quo:
And what do just about all politicians - not just the ones mentioned above - have in common? They rarely ever blame themselves; instead, they seem to blame the wealthy, minorities or foreigners for any problems. We believe the key problem many countries have is debt. I allege that if countries had their fiscal house in order, they would rarely see the rise of populist politicians. While there are exceptions to this simplified view, Ukraine may not be one of them: would Ukraine be in the situation it is in today if the country were able to balance its books? Central banks are clearly not appointing populist politicians, but we allege ZIRP provides a key ingredient that allows such politicians to rise and thrive. ZIRP has allowed governments to carry what we believe are excessive debt burdens though ZIRPs cousin quantitative easing ("QE"). QE is essentially government debt monetization in our view. Take the Fed's U.S. treasury buying QE program. Those Treasuries (or new Treasuries that the Fed rolls into) might be held indefinitely by the Fed (despite claims of balance sheet normalization) - meaning that US Government will never pay the principle, and the U.S. Government effectively pays zero interest on that debt because the profits of the Fed flow back to the US Treasury. ZIRP allows governments to engage on spending sprees, such as a boost of military spending Prime Minister Abe might pursue. The Great Depression ultimately ended in World War II. I'm not suggesting that the policies of any one politician currently in office or running for office will lead to World War III. However, I am rather concerned that the longer we continue on the current path, the more political instability will be fostered that could ultimately lead to a major international conflict. How to get out of this mess The Fed needs to have the guts to tell Congress that it is not their role to fix their problems. It requires guts because they must be willing to accept a recession in making their point. |
|||
| CHRONIC UNEMPLOYMENT |
|
9 - Chronic Unemployment | |
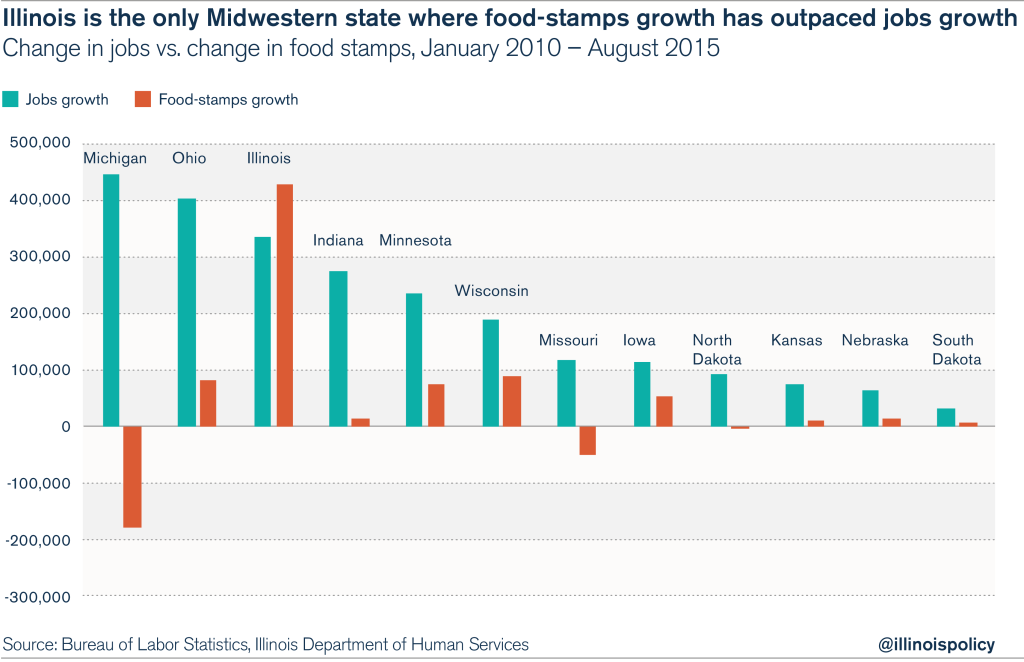
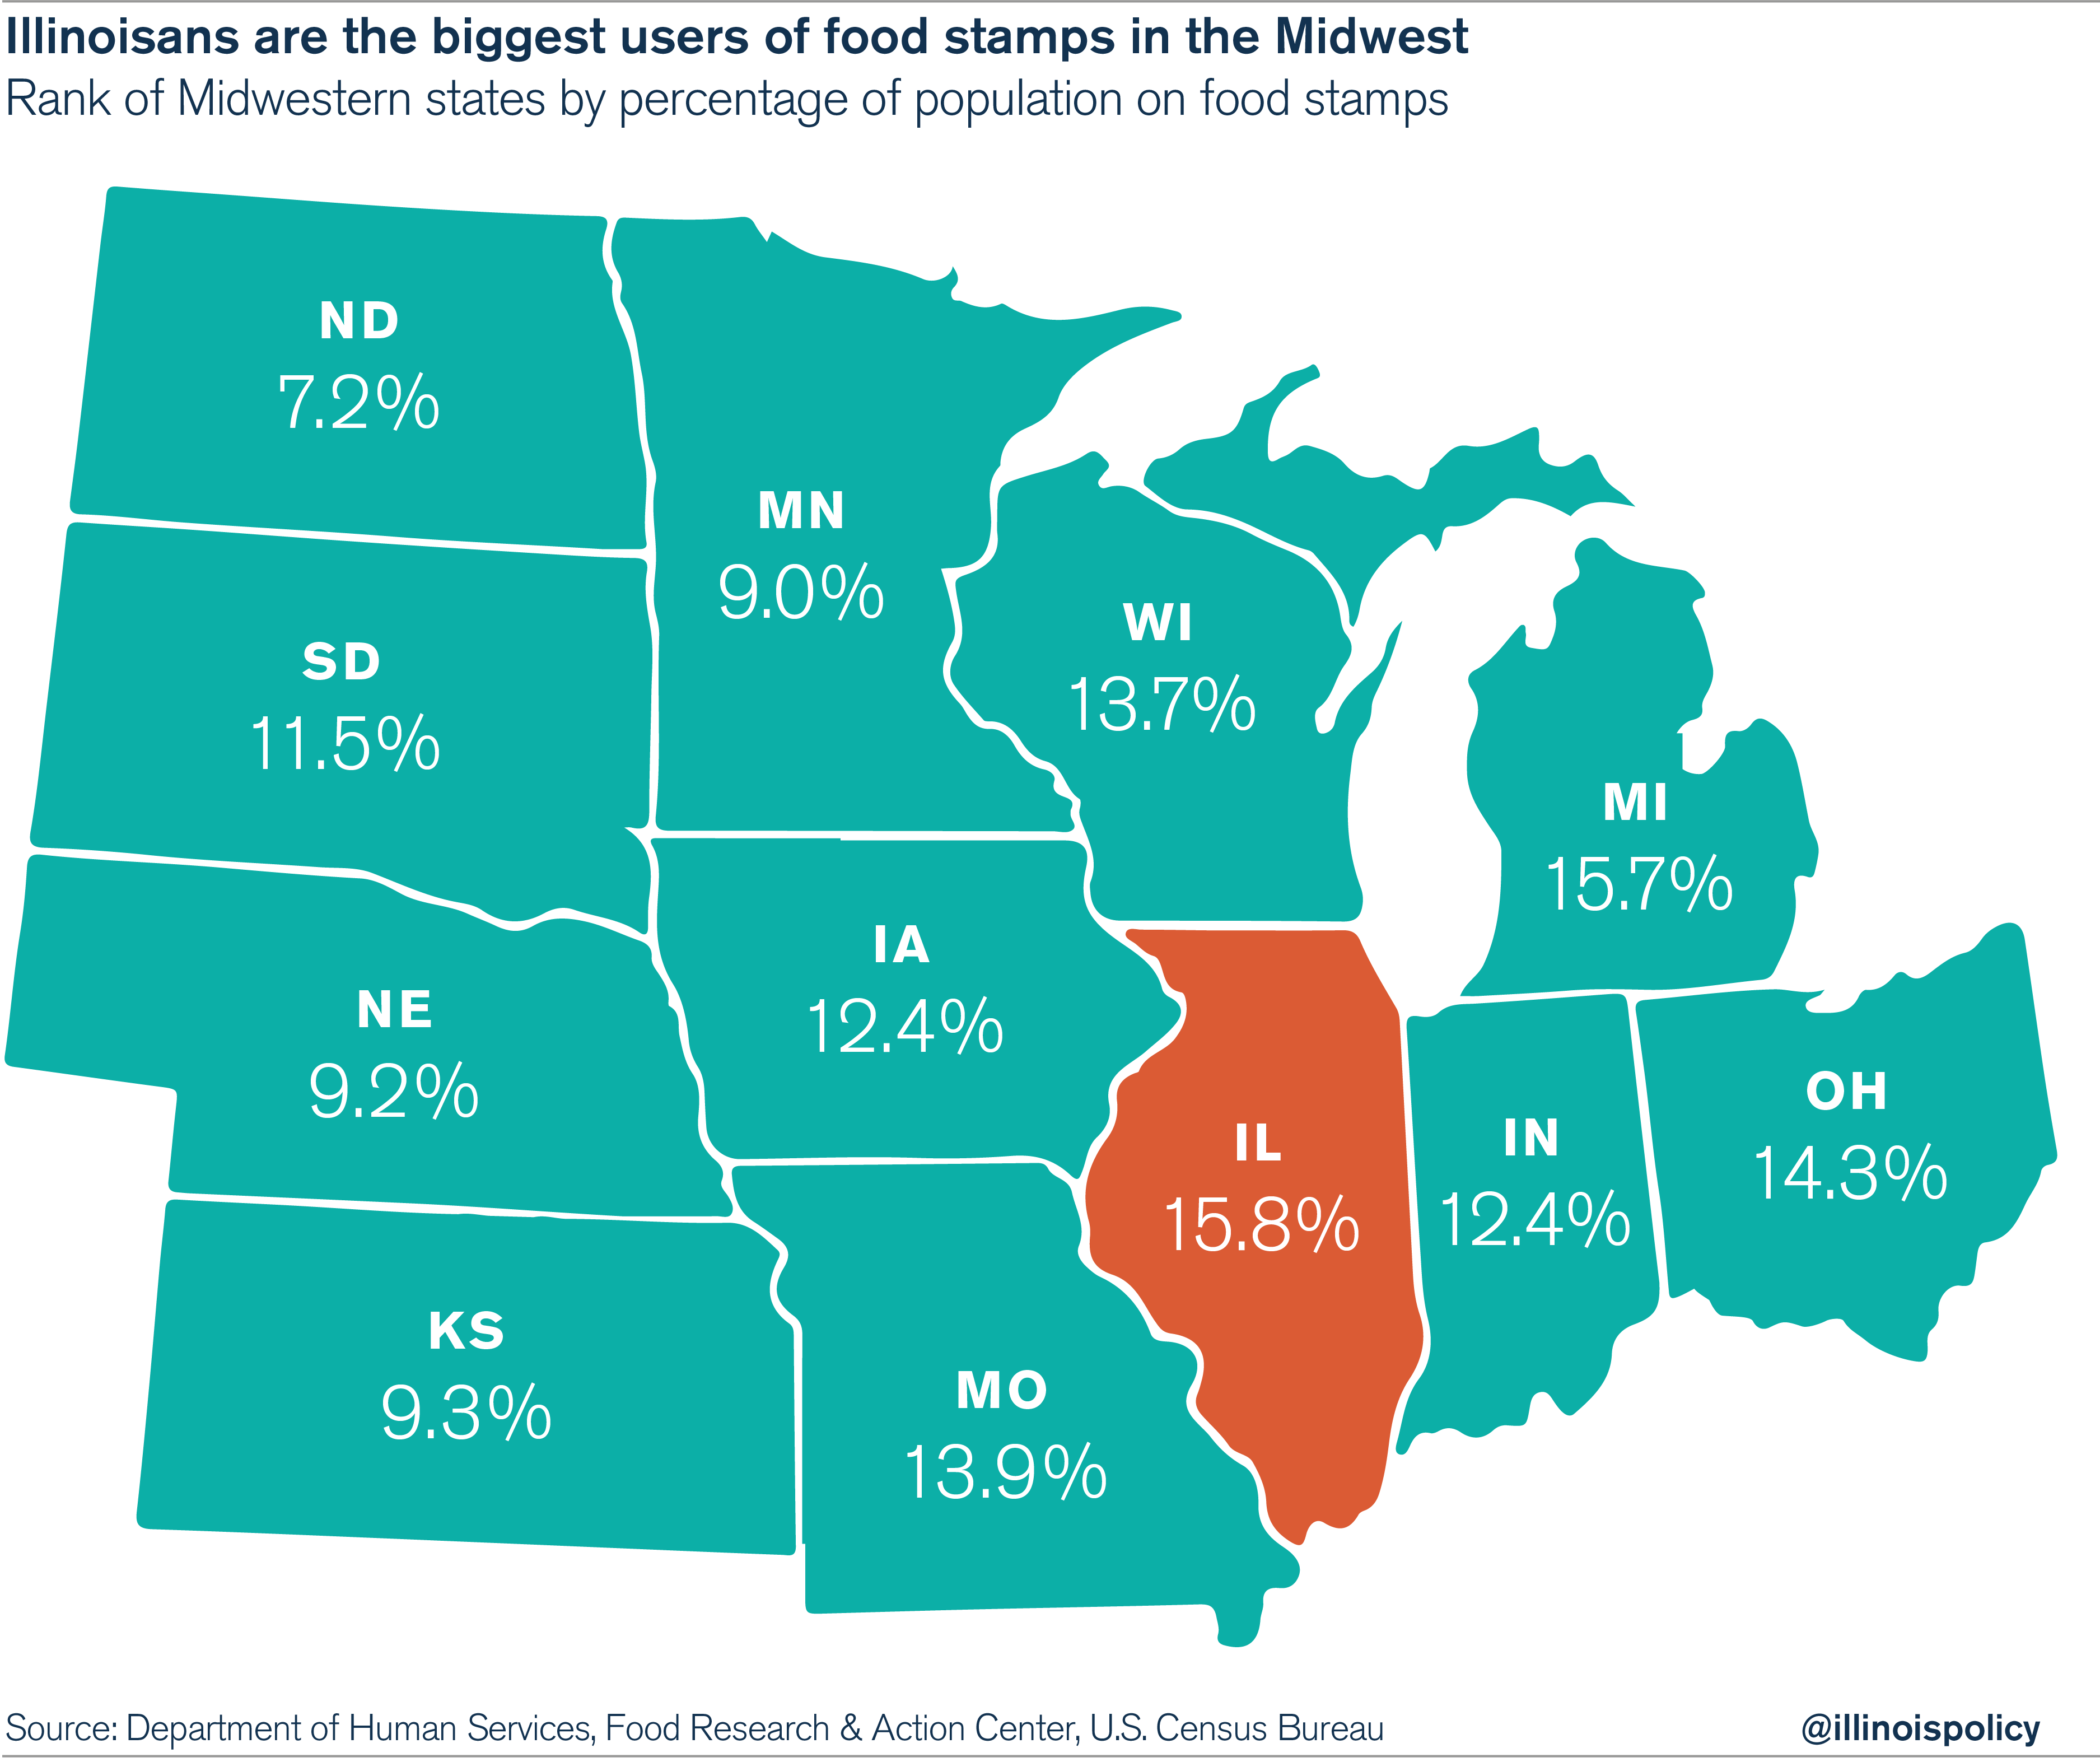
Obamanomics: Food Stamp Growth Outpaces Jobs In Illinois During "Recovery"Submitted by Michael Lucci via The Illinois Policy Institute, Illinois is the only state in the Midwest to have added more people to food-stamp rolls than to employment rolls during the recovery from the Great Recession. Job losses from the Great Recession occurred from January 2008 to January 2010, and since then, states have had five-and-a-half years of recovery. During the recovery from the Great Recession, the Land of Lincoln, alone in the Midwest, had more people enter the food-stamps program than start jobs. Food-stamps growth in Illinois has outpaced jobs creation by a 5-4 margin.
In every other Midwestern state, jobs growth has dramatically outpaced food-stamps growth during the recovery. In fact, in every other state in the region, jobs growth dwarfs food-stamps growth. But during the recovery, Illinois put more people on food stamps than every other Midwestern state combined.
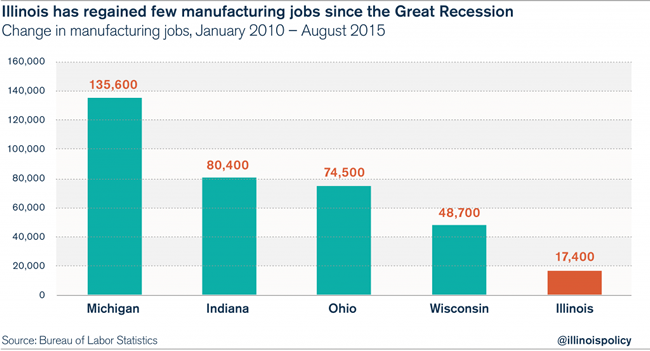
Manufacturing has borne the brunt of Illinois’ policy failures. From the state’s broken workers’ compensation system, to the highest property taxes in the region, to the lack of a Right-to-Work law while surrounding states enact Right to Work, Illinois has the worst policy environment in the Midwest for manufacturers. The result for Illinois factory workers? The Land of Lincoln has put 25 people on food stamps for every manufacturing job created during the recession recovery. And the recovery that Illinois’ manufacturers have experienced has been especially anemic. After losing 117,000 manufacturing jobs during the recession, Illinois has only regained 17,400 of those factory jobs since January 2010. Meanwhile, the other Great Lakes states have pulled far ahead of Illinois during the recovery. Michigan has added 135,600 manufacturing jobs, Indiana has added 80,400, Ohio has added 74,500 and Wisconsin has added 48,700.
Illinois’ lack of jobs growth, especially in blue-collar industries, has driven more and more Illinoisans to dependency on government, while residents of the other Great Lakes states join the ranks of the employed and leave the food-stamps program. Michigan surpassed Illinois in 2014 for manufacturing jobs created, while Illinois has surpassed Michigan for the percentage of residents on food stamps. Illinoisans depend on food stamps more than do the residents of any other state in the region. * * * Obamanomics may just be as bad as Abenomics...
|
|||
| TO TOP | |||
| MACRO News Items of Importance - This Week | |||
GLOBAL MACRO REPORTS & ANALYSIS |
|||
US ECONOMIC REPORTS & ANALYSIS |
|||
| CENTRAL BANKING MONETARY POLICIES, ACTIONS & ACTIVITIES | |||
| Market | |||
| TECHNICALS & MARKET |
|
||
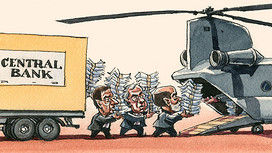
IS THE FED PREPARING FOR QE4 OR EVEN WORSE: "HELICOPTER MONEY"?
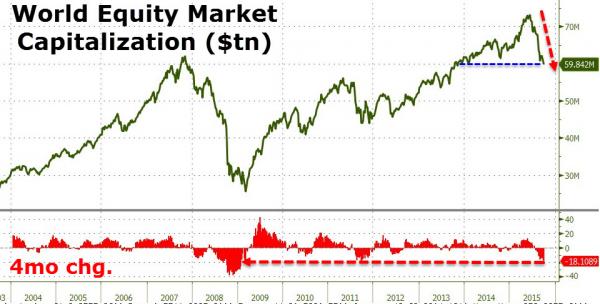
(See our Macro Video Explaining Helicopter Money) IS "HELICOPTER MONEY" COMING? Since the start of June, global equity markets have lost over $13 trillion.
(The last time global market dropped this much - Bernanke unleashed QE2) World market capitalization has fallen back below $60 trillion for the first time since February 2014 as it appears the world's central planners' print-or-die policy to create wealth (and in some magical thinking - economic growth) has failed - and failed dramatically.
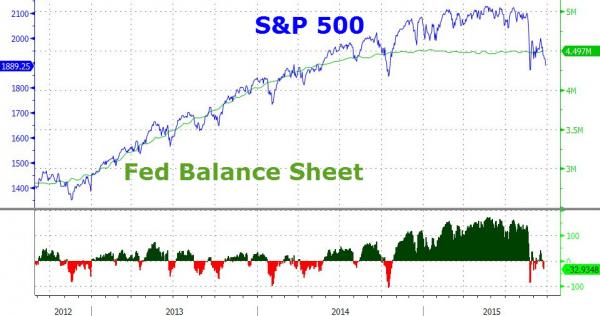
To rub more salt in the wounds of monetray policy mumbo-jumbo, despite endless rate cuts and balance sheet expansion around the world, the last 4 months have seen an 18% collapse - the largest since Lehman. CLEARLY THE FED MUST INCREASE ITS BALANCE SHEET
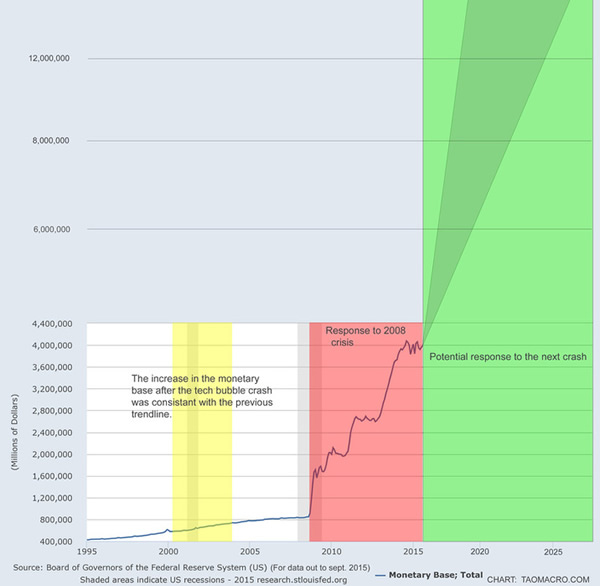
HISTORY SUGGESTS THIS SHOULD TO BE EXPECTED
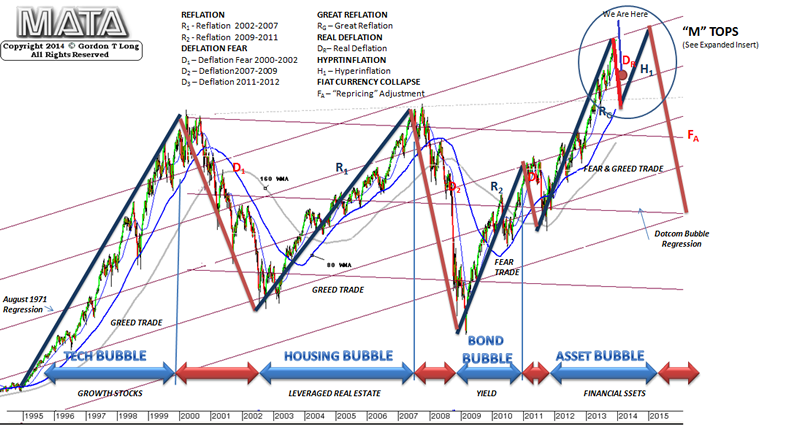
NON OF THIS WORK OF COURSE! BUT IT MAY RESULT IN AN 8 MONTH RALLY AND MARGINALLY NEW HIGHS (OUR "M" TOP)
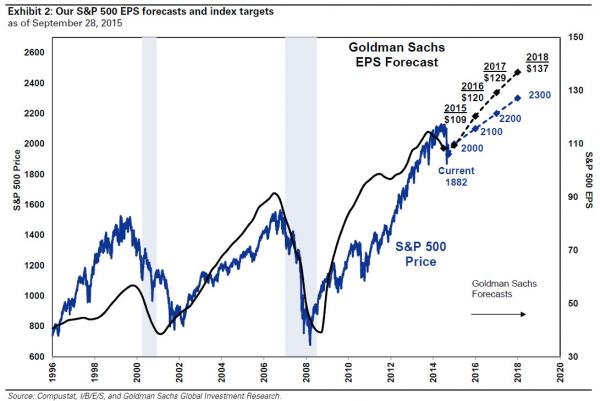
GOLDMAN SUPPORTS OUR 'M" TOP
POTENTIAL FED TRIGGER LEVELS SUPPORT
BULL MARKET TREND CHANNEL SUPPORT
SOME SEE THE FED "PUT" TO BE MUCH LOWER I find the views of Nomura's Bob Janjuah to very insightful and predictive. He sees the Fed "PUT" to be much lower than we do.
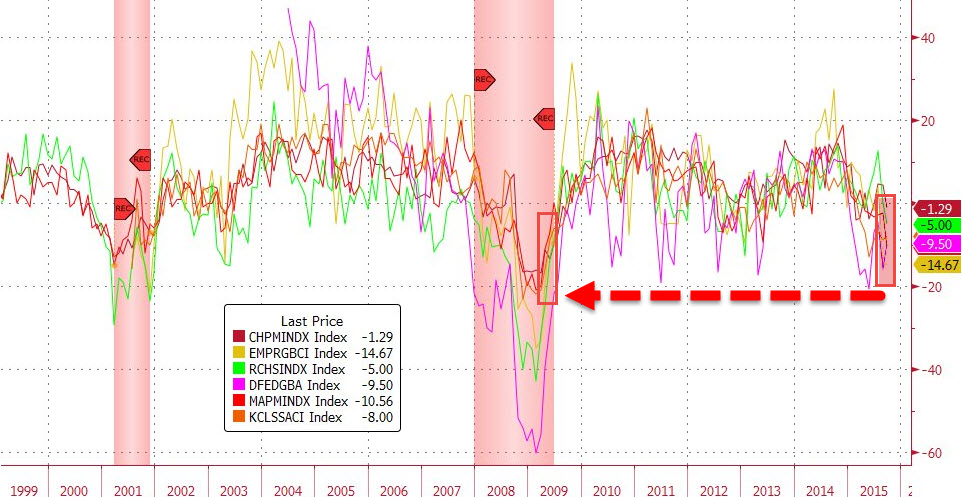
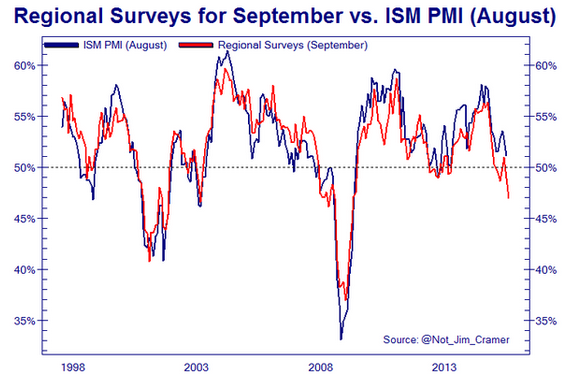
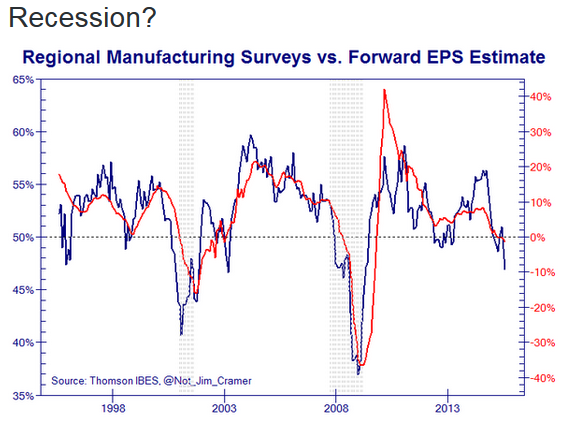
My research shows for the first time since 2009, all six major Fed regional activity surveys are in contraction territory.
Charts: Bloomberg
WHAT THE MAINSTREAM MEDIA IS NOT SHOWING - But the fed is well aware of!
EXPECT THE FED TO HIDE BEHIND THE COMING MARKET REALIZATION SCARE!
|
|||
| COMMODITY CORNER - AGRI-COMPLEX | PORTFOLIO | ||
| SECURITY-SURVEILANCE COMPLEX | PORTFOLIO | ||
| THESIS - Mondays Posts on Financial Repression & Posts on Thursday as Key Updates Occur | |||
| 2015 - FIDUCIARY FAILURE | 2015 | THESIS 2015 |  |
| 2014 - GLOBALIZATION TRAP | 2014 |  |
|
 |
|||
|
2013 2014 |
 |
||
FINANCIAL REPRESSION DON RISSMILLER THE BIGGEST FED MEETING SINCE 2008 IN TERMS OF EXPECTATIONS FRA Co-Founder Gordon T. Long talks Financial Repression and current economic developments with Don Rissmiller, a founding partner and chief economist of Strategas Research Partners. Mr. Rissmiller has overseen Strategas macroeconomic research since 2006, as well as thematic research, and high frequency econometric forecasting. “When we think about financial repression, we think about interest rates being below normal levels or below inflation. You would do that if you're in an environment with a lot of debt. The solution if you have too much debt is to try to make the burden of that debt to decrease.” Rissmiller highlights the 3 avenues in which the government receives funds through taxes. Taxing income, taxing transactions, and taxing wealth; however financial repression relates by, “Keeping interest rates below inflation is a fancy way of taxing liquid wealth, taxing cash.” THE RESULT OF LOW INTERST RATES “You're trying to stimulate the economy by implementing lower interest rates.” The financial repression process begins at the monetary policy level as a response to some shock In the economy. The goal is to get risk taking up in the economy, and that’s complicated with monetary policy because it is not the best policy when it comes to risk taking, “It may be the best you can do, it may be an appropriate policy response in a time of stress, but it still has consequences that may not all be desirable.” When you think about where we are going, what you can do is use whatever works. “You have to force other investors to take more risk. You might bid up asset prices, and of course assets are not equally distributed so that has consequences for income inequality.” THE SEPTEMBER 17th FOMC MEETING “It was the biggest fed meeting since 2008 in terms of expectations” The Fed took the approach that they would like to wait a little more and see some more data. This is not uncommon, if we look back to 2013 to see an example of this, the Fed started talking about the quantitative easing taper in the middle of 2013, and by Sept 2013 the expectation was they were ready to go, but they held back for 3 more months because of the tightening of financial conditions. “This is a reasonable way to look at what will happen in September of 2015, a tightening of financial conditions plus data that wasn’t equate to have confidence in your forecasts leading the Fed to delay.” FORECASTING THE US ECONOMY Considering the global slowdown in world trade and commodity prices, Rissmiller shares some foresight into the potential future of the American economy. “We are seeing weakness in manufacturing that means another sector will have to pick up the slack. The sectors I will focus on are housing, consumer, and the government.” “In housing we are seeing some improved signs on household formation. As unemployment is looking more normal we have had more household buying." “Consumer spending has been growing, we think this can continue because the decrease in energy prices tends to effect consumer spending with a lag and so we are going to continue to see positives to lower energy prices.” " The government sector has been a drag, there is still one more budget fight coming in the next few weeks and that’s going to be a challenge, but if we get through that we are into the part of the election cycle where government drag turns into a small boost, we are already seeing some rehiring at the state and local level and that is significant as well.”
|
09-28-15 | THESIS | |
2011 2012 2013 2014 |
 |
||
| THEMES - Normally a Thursday Themes Post & a Friday Flows Post | |||
I - POLITICAL |
|||
| CENTRAL PLANNING - SHIFTING ECONOMIC POWER - STATISM | THEME | ||
- - CORRUPTION & MALFEASANCE - MORAL DECAY - DESPERATION, SHORTAGES. |
THEME |  |
|
| - - SECURITY-SURVEILLANCE COMPLEX - STATISM | M | THEME | |
| - - CATALYSTS - FEAR (POLITICALLY) & GREED (FINANCIALLY) | G | THEME | |
II-ECONOMIC |
|||
| GLOBAL RISK | |||
| - GLOBAL FINANCIAL IMBALANCE - FRAGILITY, COMPLEXITY & INSTABILITY | G | THEME | |
| - - SOCIAL UNREST - INEQUALITY & A BROKEN SOCIAL CONTRACT | US | THEME | |
| - - ECHO BOOM - PERIPHERAL PROBLEM | M | THEME | |
| - -GLOBAL GROWTH & JOBS CRISIS | |||
| - - - PRODUCTIVITY PARADOX - NATURE OF WORK | THEME | MACRO w/ CHS |
|
| - - - STANDARD OF LIVING - EMPLOYMENT CRISIS, SUB-PRIME ECONOMY | US | THEME | MACRO w/ CHS |
III-FINANCIAL |
|||
| FLOWS -FRIDAY FLOWS | MATA RISK ON-OFF |
THEME |  |
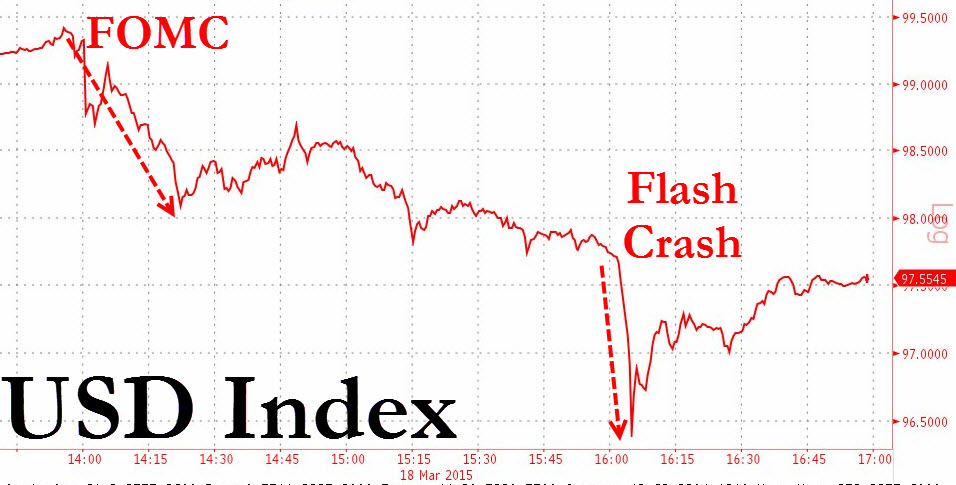
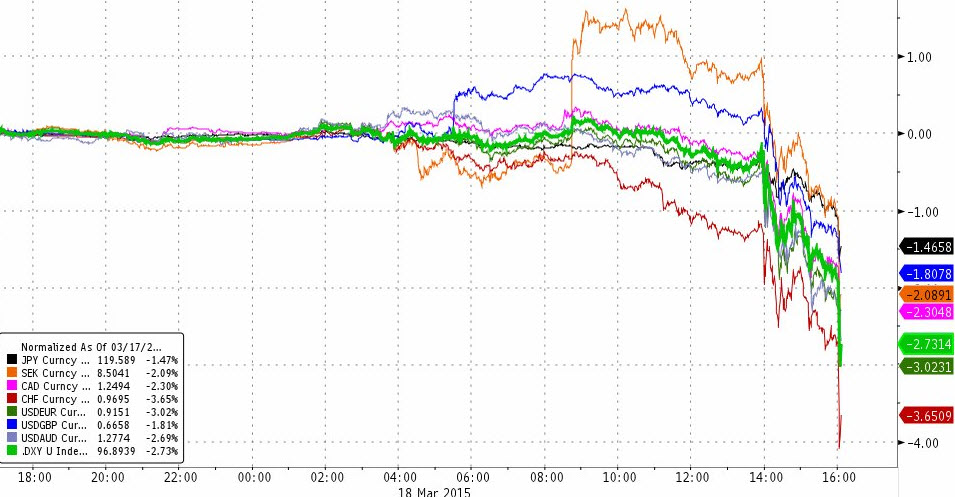
FX Liquidity Is Tumbling To Dangerous LevelsBack in the summer of 2013, the Treasury Borrowing Advisory Group made a very explicit plea to the Treasury (and the Fed): please help us, liquidity in bond markets is plunging; the plea was so loud the Fed - whose monetization of Treasurys remains the primary culprit for the collapse in fixed income liquidity - promptly announced it would first taper, and then completely halt QE (at least until such time as Congress provided a generous surge in monetizable debt). It took the peanut gallery a few years to pronounce that "everyone is worried about bond market liquidity", even though this had been clear for years to anyone who actually traded bonds in these broken markets. A far more concerning development over the same period has been not so much the evaporation of equity, or debt, liquidity but that of the one "market" which central banks have no qualms about intervening on a daily basis: currencies. A recent example of just how thin liquidity had become in FX took place on March 18 during the infamous USD flash crash, when just after the market close, the USD index went, well, "crazy"
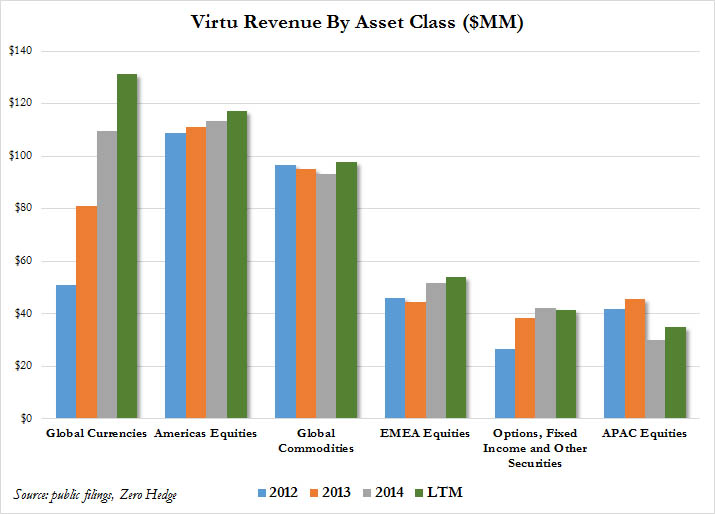
Furthermore, as we also discussed in the past year, one of the primary reason why FX liquidity has imploded is that after soaking up commodity, bond and equity markets in the past several years, HFT firms such as Virtu decided to make FX their latest trading arena.
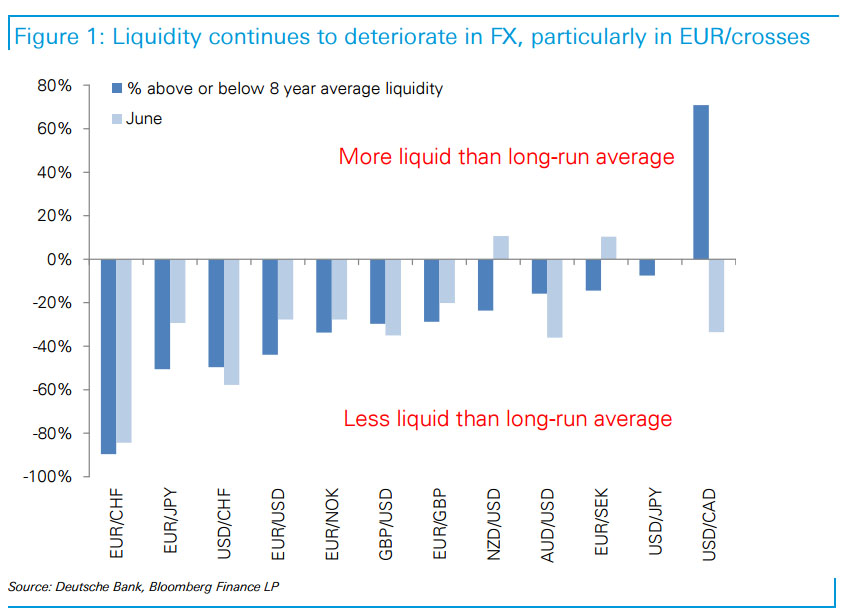
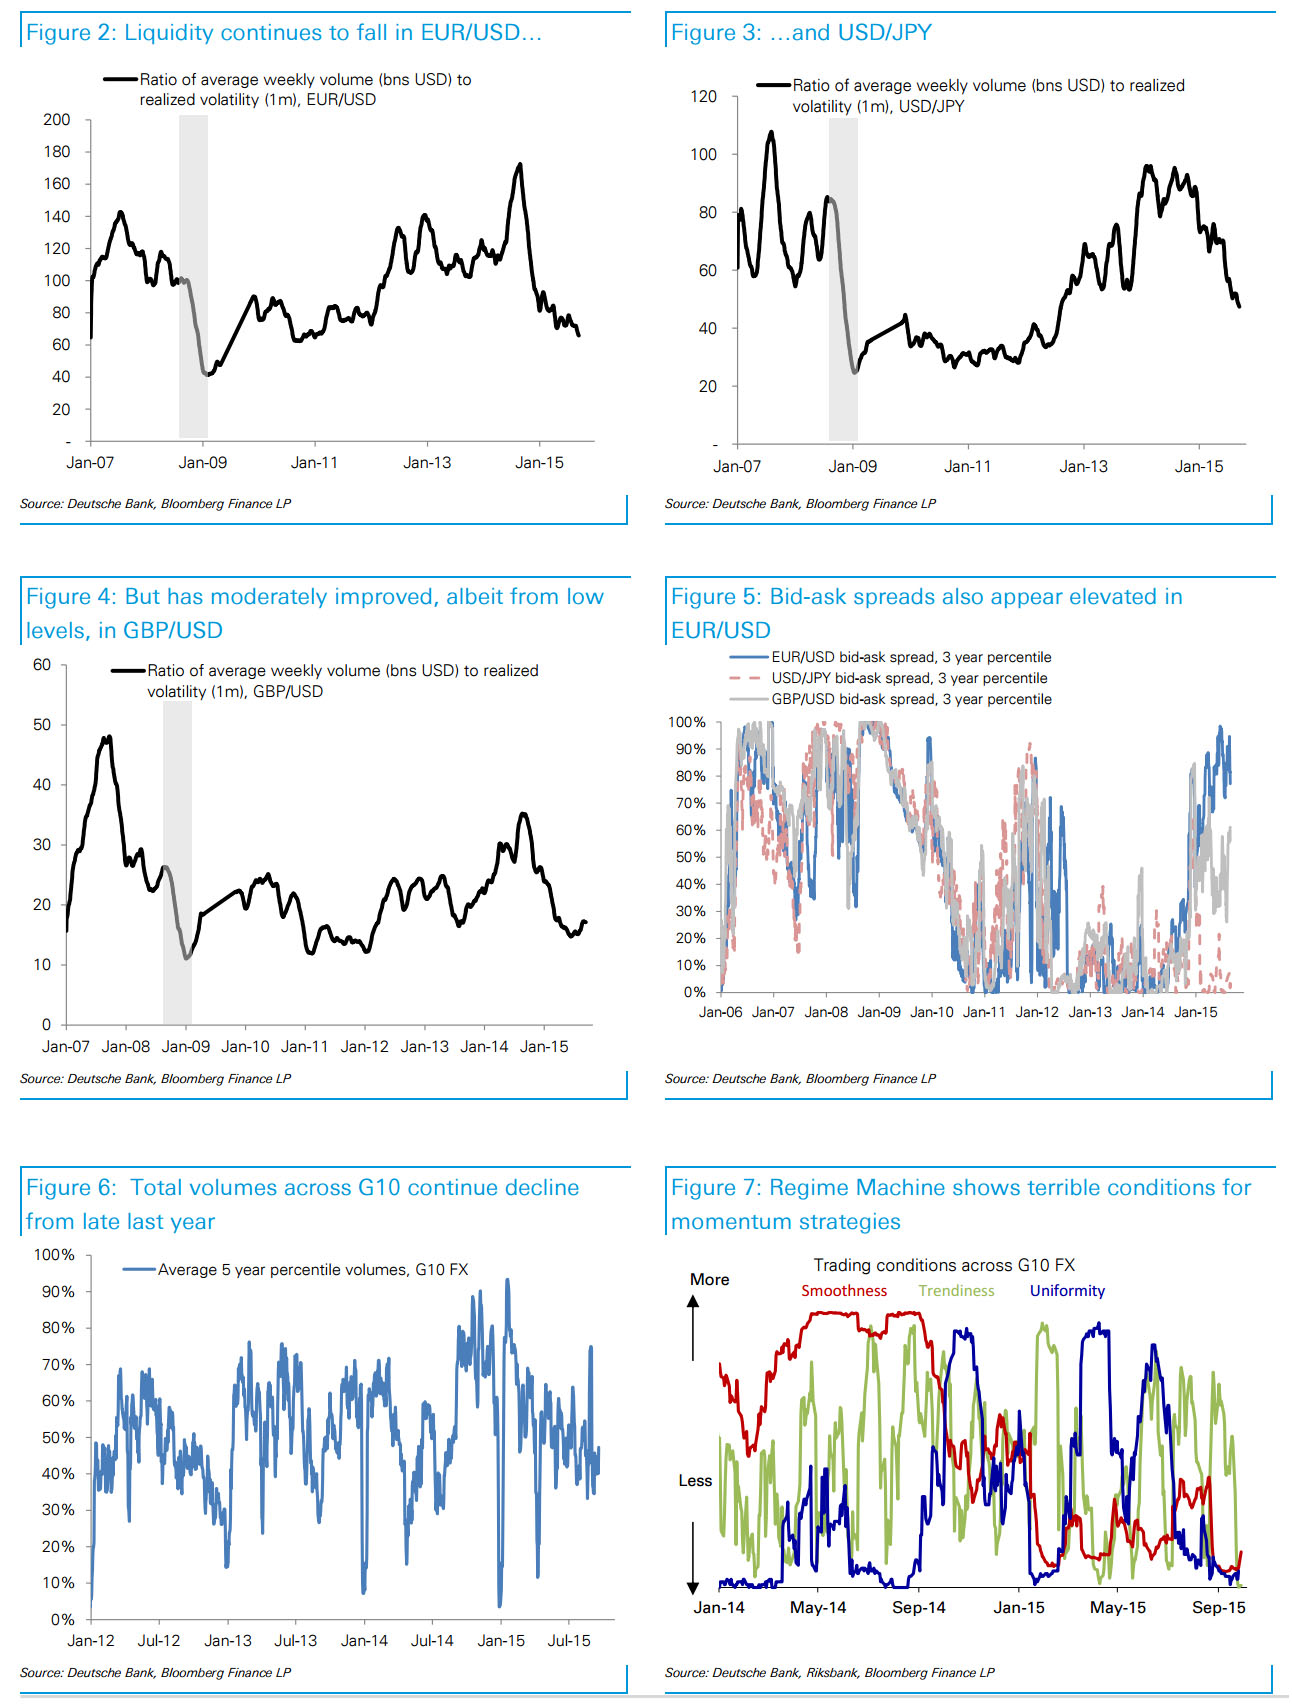
And while the practical impact of collapsing liquidity in this last remaining asset class was also quite clear to market participants, especially those who relish the daily USDJPY stop hunts, there had been little theoretical work done on analyzing just how bad said liquidity vacuum had become. Until today, when courtesy of DB's FX strategist Oliver Harvey, we have the answer: using a "framework for measuring liquidity in FX based on the ratio between average weekly volumes and realized vol" Harvey the obvious: FX liquidity is going, going, gone. To wit:
The bottom line: "liquidity in EUR/USD is closing in on the lowest levels save after the Lehman bankruptcy, with only late-2010 worse."
Other crosses reveals the same trend: "Liquidity has also fallen in USD/JPY but only towards its longrun average, while liquidity in GBP/USD has moderately improved but from low levels. While quoted bid-ask spreads are a different, and probably inferior, measure, interestingly they tell out the same story (see chart 5), with 3 year rolling percentiles very elevated in EUR/USD but low in USD/JPY. Turning to volumes, these continue a steady decline from late last year across G10 FX, a spike at this month’s Fed meeting notwithstanding (chart 6)." So just in case anyone needed a reason to feel bad for big bank FX traders, especially after all the currency rigging revalations, here it is:
And here, for the visual learners, is DB's complete chart pack showing that there really is no way out: the moments a massive inversion in sentiment arrives, the FX market will simply go bid-or-offerless as all the HFT-driven fake liquidity in the market disappears with the switch of a button.
|
|||
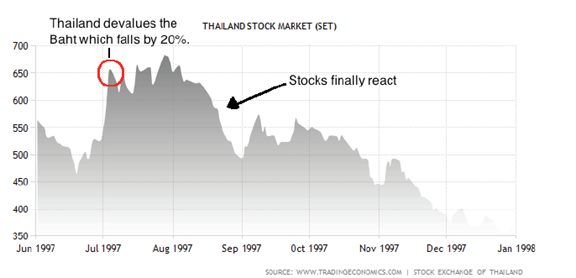
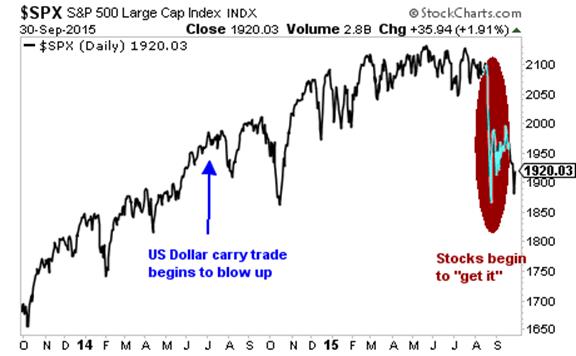
10-01-15 Phoeneix Capital - Graham Summers Stocks Are FINALLY Beginning to Understand the Currency CrisisOne of the biggest issues investors need to assess today is the US Dollar carry trade. If you’re unfamiliar with the concept of a carry trade, it occurs when you borrow in one currency, usually at a very low interest rate, and then invest the money in another security, whether it be a bond, stock or what have you, that is denominated in another currency. More often than not, you invest directly in the other currency itself, pocketing the difference in interest rates. So if the US Dollar pays 0.25% and the Yuan offers 5% for example, you borrow Dollars and invest in Yuan and pocket the 4.75% difference. Now, investors in currencies are permitted to use greater leverage than their counterparts in stocks or bonds. Whereas a stock investor might be permitted to leverage up at 20 to 1, (meaning he or she can borrow $20 for every $1 in capital in his or her account), currency investors can leverage in excess of 100 to 1 or even 300 to 1… Now a carry trade only works when the currency you are borrowing in remains weak. As soon as it begins to strengthen, you profits not only evaporate but you can end up deep in the red (remember you’ve borrowed $100 for every $1 you have in capital). Globally the US Dollar carry trade is north of $9 trillion: larger than the economies of Japan and Germany combined. And it began to blow up in July of 2014. Now, a critical theme that investors need to understand is that stocks are ALWAYS the LAST asset class to adjust to major changes in the financial system. The currency markets ALWAYS react first. It is only after the changes become enormous that stocks finally “get it.” Consider the Asia Crisis of 1997. Thailand devalued the Baht on July 2, 1997. However it was not until August that the Thai stock market began to react. And it took the rest of the year for Thai stocks to really “get it.”
The reasons for this are that:
The bottom line is that when currencies begin to blow up it takes time for the rest of the financial world to catch on. This is particularly true for stocks. With that in mind, consider that the global US Dollar carry trade began to blow up back in July 2014. While most commentators focused on the impact this had on Oil, the REAL damage was done in the emerging market currency space. Below is a chart showing the US Dollar/ Chilean Peso (black), US Dollar/ Brazilian Real (blue), US Dollar/ Mexican Peso (red), US Dollar/ South African Rand (red), and US Dollar/ Singapore Dollar (pink) currency pairs. As you can see, between the middle of 2014 and today, ALL of these pairs have seen price swings ranging in size from 16% to 26%. These are ENORMOUS movements for currencies. Imagine losing 25% of your purchasing power in the span of a single year. This ONLY happens when the financial system is under incredible duress. Indeed, across the board, Emerging Market currencies are collapsing against the US Dollar, falling to the lowest levels since 2001! Many investors were not aware of this level of distress because they focus on stocks. However, the US stock market finally began to “get it” in August 2015.
This is not over by any means. As I mentioned before, the US Dollar carry trade is over $9 trillion in size. This is larger than the economies of Germany and Japancombined. The worst is yet to come and smart investors are preparing now, BEFORE it hits. |
|||
| CRACKUP BOOM - ASSET BUBBLE | THEME | ||
| SHADOW BANKING - LIQUIDITY / CREDIT ENGINE | M | THEME | |
| GENERAL INTEREST |
|
||
| STRATEGIC INVESTMENT INSIGHTS - Weekend Coverage | |||
|
SII | ||
|
SII | ||
|
SII | ||
|
SII | ||
Hedge funds trimmed bullish oil bets for the first time in six weeks, losing faith in a swift recovery as Russia boosted output to the highest since the Soviet Union collapsed. Speculators reduced their net-long position in West Texas Intermediate crude by 9.1 percent in the week ended Sept. 29, according to data from the Commodity Futures Trading Commission. Longs dropped from a 12-week high while shorts increased. U.S. crude output is down 514,000 barrels a day from a four-decade high reached in June, Energy Information Administration data show. The number of rigs targeting oil in the U.S. dropped to a five year low, Baker Hughes Inc. said Oct. 2. WTI traded in the tightest range since June last month as China’s slowing economy and the highest Russian output in two decades signaled the global glut will linger. "The U.S. producers are the only ones doing their part to reduce the global glut," John Kilduff, a partner at Again Capital LLC, a New York-based hedge fund, said by phone. "Other countries, such as Russia, are pumping at full tilt. The cutbacks by shale producers here aren’t going to have much impact, especially given the slowing global economy." WTI decreased 1.3 percent in the report week to $45.23 a barrel on the New York Mercantile Exchange. It settled at $45.54 Friday. Ample SupplyU.S. crude stockpiles, already about 100 million barrels above the five-year average, may swell further. Stockpiles have climbed during October in eight of the last 10 years as refiners slow operations to perform seasonal maintenance. Russian oil output rose to a post-Soviet record last month as producers took advantage of the weak ruble to push ahead with drilling. The nation’s production of crude and condensate climbed to 10.74 million barrels a day, 1 percent more than a year earlier and topping a record set in June, according to data from the Energy Ministry’s CDU-TEK unit. Production of crude and condensate reaches 10.74m b/d
China has failed to reverse an economic slowdown with five interest-rate reductions since November. The country’s growth will slow to 6.8 percent this year, below the government’s goal of 7 percent, according to the median of economist estimates compiled by Bloomberg. China is the biggest crude-consuming nation after the U.S. Investors pulled $393 million in September from United States Oil Fund, the largest U.S. exchange-traded product that tracks crude futures, the biggest withdrawal since April. "There’s been nothing to bring the retail investor in to put money in commodity funds," Rob Haworth, a senior investment strategist in Seattle at U.S. Bank Wealth Management, which oversees $128 billion of assets, said by phone. "The managed money has been positive about the market but things look grim. We’re at a tough time for oil on a seasonal basis as well." Other MarketsIn other markets, net bullish bets on Nymex gasoline increased 3.8 percent to 17,239. Futures declined 3.8 percent in the period covered by the CFTC report to $1.3632 a gallon. Net bearish wagers on U.S. ultra low sulfur diesel rose by 11 percent to 31,263. Diesel futures slipped 2.2 percent to $1.4976 a gallon. To investor Jim Rogers, oil holding near $45 a barrel in the face of bearish news is a sign that prices are poised to recover. “When there’s bad news and something doesn’t decline, it usually means it’s at a bottom and will be turning,” Rogers, who correctly predicted a commodities rally in 1999, said in an interview in Singapore on Thursday. |
|||
| TO TOP | |||


Read More - OUR RESEARCH - Articles Below

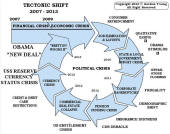
Tipping Points Life Cycle - Explained
Click on image to enlarge
TO TOP
 |
YOUR SOURCE FOR THE LATEST THINKING & RESEARCH
|
�
TO TOP