|
JOHN RUBINO'SLATEST BOOK |
||||||||||||||||||||||||||||||||||||||||||||||||||||||||||||||||||||||||||||||||||||||||||||||||||||||||||||||||||||||||||||||||||||||||||||||||||||||||||||||||||||||||||||||||||||||||||||||||||||||||||||||||||||||||||||||||||||||||||||||||||||||||||||
"MELT-UP MONITOR " Meltup Monitor: FLOWS - The Currency Cartel Carry Cycle - 09 Dec 2013 Meltup Monitor: FLOWS - Liquidity, Credit & Debt - 04 Dec 2013 Meltup Monitor: Euro Pressure Going Critical - 28- Nov 2013 Meltup Monitor: A Regression-to-the-Exponential Mean Required - 25 Nov 2013
|
"DOW 20,000 " Lance Roberts Charles Hugh Smith John Rubino Bert Dohman & Ty Andros
|
HELD OVER
Currency Wars
Euro Experiment
Sultans of Swap
Extend & Pretend
Preserve & Protect
Innovation
Showings Below
"Currency Wars "
|
"SULTANS OF SWAP" archives open ACT II ACT III ALSO Sultans of Swap: Fearing the Gearing! Sultans of Swap: BP Potentially More Devistating than Lehman! |
"EURO EXPERIMENT"
archives open EURO EXPERIMENT : ECB's LTRO Won't Stop Collateral Contagion!
EURO EXPERIMENT: |
"INNOVATION"
archives open |
"PRESERVE & PROTE CT"
archives open |

Thurs. Sept 3rd, 2015
Follow Our Updates
onTWITTER
https://twitter.com/GordonTLong
AND FOR EVEN MORE TWITTER COVERAGE
ANNUAL THESIS PAPERS
FREE (With Password)
THESIS 2010-Extended & Pretend
THESIS 2011-Currency Wars
THESIS 2012-Financial Repression
THESIS 2013-Statism
THESIS 2014-Globalization Trap
THESIS 2015-Fiduciary Failure
NEWS DEVELOPMENT UPDATES:
FINANCIAL REPRESSION
FIDUCIARY FAILURE
WHAT WE ARE RESEARCHING
2015 THEMES
SUB-PRIME ECONOMY
PENSION POVERITY
WAR ON CASH
ECHO BOOM
PRODUCTIVITY PARADOX
FLOWS - LIQUIDITY, CREDIT & DEBT
GLOBAL GOVERNANCE
- COMING NWO
WHAT WE ARE WATCHING
(A) Active, (C) Closed
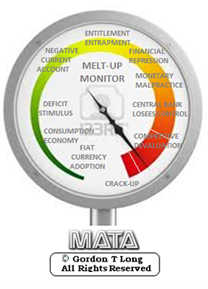
MATA
Q3 '15- Chinese Market Crash
(A)
Q3 '15-
GMTP
Q3 '15- Greek Negotiations
(A)
Q3 '15- Puerto Rico Bond Default
MMC
OUR STRATEGIC INVESTMENT INSIGHTS (SII)
NEGATIVE-US RETAIL
NEGATIVE-ENERGY SECTOR
NEGATIVE-YEN
NEGATIVE-EURYEN
NEGATIVE-MONOLINES
POSITIVE-US DOLLAR
ARCHIVES
| AUGUST | ||||||
| S | M | T | W | T | F | S |
| 1 | ||||||
| 2 | 3 | 4 | 5 | 6 | 7 | 8 |
| 9 | 10 | 11 | 12 | 13 | 14 | 15 |
| 16 | 17 | 18 | 19 | 20 | 21 | 22 |
| 23 | 24 | 25 | 26 | 27 | 28 | 29 |
| 30 | 31 | 1 | 2 | 3 | ||
KEY TO TIPPING POINTS |
| 1- Bond Bubble |
| 2 - Risk Reversal |
| 3 - Geo-Political Event |
| 4 - China Hard Landing |
| 5 - Japan Debt Deflation Spiral |
| 6- EU Banking Crisis |
| 7- Sovereign Debt Crisis |
| 8 - Shrinking Revenue Growth Rate |
| 9 - Chronic Unemployment |
| 10 - US Stock Market Valuations |
| 11 - Global Governance Failure |
| 12 - Chronic Global Fiscal ImBalances |
| 13 - Growing Social Unrest |
| 14 - Residential Real Estate - Phase II |
| 15 - Commercial Real Estate |
| 16 - Credit Contraction II |
| 17- State & Local Government |
| 18 - Slowing Retail & Consumer Sales |
| 19 - US Reserve Currency |
| 20 - US Dollar Weakness |
| 21 - Financial Crisis Programs Expiration |
| 22 - US Banking Crisis II |
| 23 - China - Japan Regional Conflict |
| 24 - Corruption |
| 25 - Public Sentiment & Confidence |
| 26 - Food Price Pressures |
| 27 - Global Output Gap |
| 28 - Pension - Entitlement Crisis |
| 29 - Central & Eastern Europe |
| 30 - Terrorist Event |
| 31 - Pandemic / Epidemic |
| 32 - Rising Inflation Pressures & Interest Pressures |
| 33 - Resource Shortage |
| 34 - Cyber Attack or Complexity Failure |
| 35 - Corporate Bankruptcies |
| 36 - Iran Nuclear Threat |
| 37- Finance & Insurance Balance Sheet Write-Offs |
| 38- Government Backstop Insurance |
| 39 - Oil Price Pressures |
| 40 - Natural Physical Disaster |
Reading the right books?
No Time?We have analyzed & included
these in our latest research papers Macro videos!
OUR MACRO ANALYTIC
CO-HOSTS
John Rubino's Just Released Book
Charles Hugh Smith's Latest Books
Our Macro Watch Partner
Richard Duncan Latest Books
MACRO ANALYTIC
GUESTS
F William Engdahl
OTHERS OF NOTE
TODAY'S TIPPING POINTS
|
Have your own site? Offer free content to your visitors with TRIGGER$ Public Edition!
Sell TRIGGER$ from your site and grow a monthly recurring income!
Contact [email protected] for more information - (free ad space for participating affiliates).
HOTTEST TIPPING POINTS |
Theme Groupings |
||
We post throughout the day as we do our Investment Research for: LONGWave - UnderTheLens - Macro
|
|||
|
MOST CRITICAL TIPPING POINT ARTICLES TODAY
|
|
||
|
09-03-15 | CENTRAL BANKS |
|
Submitted by Tyler Durden on 09/02/2015
Presenting Never-Ending QE In One Easy FlowchartBecause we know the mechanics of the currency war and the endless loop of competitive easing can be a bit confusing at times, we present the following simplified, circular flow chart from Morgan Stanley which should serve as a helpful guide to the never ending "beggar thy neighbor" loop. In case you haven’t noticed, the world’s central banks are locked in an epic race to the devaluation bottom in desperate pursuit of a post-crisis economic recovery that never came despite trillions in worldwide QE and on August 11, in the currency war equivalent of the United States entering World War II, China devalued the yuan, serving notice that, to quote Xi Jinping, "the lion has woken up." China’s move has sent shockwaves through the emerging market world and caused the Fed to reconsider the timing of the ever elusive "liftoff" and now, with the sputtering engine of global growth and trade set to export its deflation across the globe, countries like India and South Korea must decide how to respond. Because we know the mechanics of the currency war and the endless loop of competitive easing can be a bit confusing at times, we present the following simplified, circular flow chart from Morgan Stanley which should serve as a helpful guide to the never ending "beggar thy neighbor" loop. From MS:
|
|||
Submitted by Tyler Durden on 09/02/2015 The QE End-Game Decision Tree: Not "If" But "When" Central Banks Lose Control"Not 'IF' but 'WHEN central banks lose control?' The global financial repression pushed investors to invest cash in risky assets, such as property and equity. The scale of global policy interventions is trumping all fundamental factors for now. Investors should keep in mind that the road is never straight and next month should be full of potentially disruptive events impacting sharply overcrowded assets and trades. History shows that such misallocation of resources creates bubbles that can last before fully blowing; the question is not if, but when." Make no mistake, the writing has been on the wall for quite some time and we haven't been shy about pointing it out. Central banks are losing control. Trillions upon trillions in post-crisis asset purchases haven’t given the global economy the defibrillator shock the world’s central planners were depending on to bring about a sustained and robust recovery. Indeed, the opposite appears to have materialized. Subdued demand and trade looks to have become structural and endemic rather than cyclical and rather than create "healthy inflation", seven years of accommodative monetary policy has only served to bury the world in a global deflationary supply glut. And that’s just the big picture. The more granular we get, the more apparent it is that central banks are no longer in the driver's seat. Inflation expectations across the eurozone have collapsed despite Mario Draghi’s best efforts to assure the public that PSPP has been an overwhelming success and similarly, inflation expectations have tumbled in the US ahead of a expected rate hike which looks less likely by the day. Meanwhile, in Sweden, the Riksbank has sucked so much high quality collateral from the system that QE has actually reversed itself, giving the world its first look at what happens when QE demonstrably fails. And let’s not forget Japan, where the world’s most hilariously absurd example of central bankers gone stark raving mad has done exactly nothing to pull the country out of the deflationary doldrums. And so here we stand, on the precipice of crisis with central banks having run out of both ammunition and credibility. In short, it’s time to ask if central banks have officially lost control. For the answer, and for the "QE end-game decision tree", we go to BNP. Note that if CB's do lose it, the likely scenario is: "deflation, vicious cycle... economic depression". * * * From BNP Not "IF" but "WHEN central banks lose control?" The global financial repression pushed investors to invest cash in risky assets, such as property and equity. The scale of global policy interventions is trumping all fundamental factors for now. Investors should keep in mind that the road is never straight and next month should be full of potentially disruptive events impacting sharply overcrowded assets and trades. History shows that such misallocation of resources creates bubbles that can last before fully blowing; the question is not if, but when. Risk assets and risk parameters would be massively affected in the event central banks lose control;in the meantime, EDS Asia believes that central bank maturities that use forward guidance matter more than the QE process itself. The Fed and the ECB have been providing guidance which partly explains the low short-term volatility. The BoJ is moving toward this behaviour, managing the news flow: therefore there is a case for the NKY index going up slowly with a lower upfront volatility and a term structure closer to the US one: in that sense, we have started to observe an "SPX-isation of the NKY Index" in the past few months before this summer’s risk-off, as short dated volatility was trading lower. In China, the PBoC intervention learning curve is steep; this is the reason we believe the next equity leg up will be accompanied by an elevated volatility regime. The quantitative easing started in the US more than six years ago and the SPX index, as well as selective risky assets, are now hovering at the high end of their valuation histories. Recent price actions are testimony of the fragility of imbalances built over the years. Investors may recall the Japan easing experience in 2005 and 2006; an early exit, together with a global financial crisis, caused a Japanese equities meltdown (between mid-2007 and late-2008). In the decision tree, EDS Asia addresses the potential "QE end-game scenarios" [attempting to] answer the question "Are central banks losing control?" and providing a time horizon and probabilities affecting each path, which should allow investors to get a clearer overview.
|
|||
| MOST CRITICAL TIPPING POINT ARTICLES THIS WEEK - August 23rd, 2015 - August 29th, 2015 | |||
| BOND BUBBLE | 1 | ||
| RISK REVERSAL - WOULD BE MARKED BY: Slowing Momentum, Weakening Earnings, Falling Estimates | 2 | ||
| GEO-POLITICAL EVENT | 3 | ||
| CHINA BUBBLE | 4 | ||
| JAPAN - DEBT DEFLATION | 5 | ||
EU BANKING CRISIS |
6 |
||
| TO TOP | |||
| MACRO News Items of Importance - This Week | |||
GLOBAL MACRO REPORTS & ANALYSIS |
|||
US ECONOMIC REPORTS & ANALYSIS |
|||
| CENTRAL BANKING MONETARY POLICIES, ACTIONS & ACTIVITIES | |||
Submitted by Tyler Durden on 09/01/2015 19:10
The "Great Accumulation" Is Over: The Biggest Risk Facing The World's Central Banks Has ArrivedTo be sure, there’s been no shortage of media coverage regarding the collapse in crude prices that’s unfolded over the course of the past year. Similarly, it’s no secret that commodity prices in general are sitting near their lowest levels of the 21st century. When Saudi Arabia, in an effort to bankrupt the US shale space and tighten the screws on a recalcitrant Moscow, endeavored late last year to keep oil prices suppressed, the kingdom killed the petrodollar, a move we argued would put pressure on USD assets and suck hundreds of billions in liquidity from global markets. Thanks to the fanfare surrounding China’s stepped up UST liquidation in support of the yuan, the world is beginning to understand what we meant. The accumulation of USD assets held as FX reserves across the emerging world served as a source of liquidity and kept a bid under things like US Treasurys. Now that commodity prices have fallen off a cliff thanks to lackluster global demand and trade, the accumulation of those assets slowed, and as a looming Fed hike along with fears about the stability of commodity currencies conspired to put pressure on EM FX, the great EM reserve accumulation reversed itself. This is the environment into which China is now dumping its own reserves and indeed, the PBoC’s rapid liquidation of USTs over the past two weeks has added fuel to the fire and effectively boxed the Fed in. On Tuesday, Deutsche Bank is out extending their "quantitative tightening" (QT) analysis with a look at what’s ahead now that the so-called "Great Accumulation" is over. "Following two decades of unremitting growth, we expect global central bank reserves to at best stabilize but more likely to continue to decline in coming years," DB begins, before noting what we outlined above, namely that the "three cyclical drivers point[ing] to further reserve draw-downs in the short term [are] China’s economic slowdown, impending US monetary tightening, and the collapse in the oil price." In an attempt to quantify the effect of China’s reserve liquidation, we’ve quoted Citi, who, after reviewing the extant literature noted that for every $500 billion in EM FX reserve draw downs, the effect is to put around 108 bps of upward pressure on 10Y UST yields. Applying that to the possibility that China will have to sell up to $1.1 trillion in assets to offset the unwind of the great RMB carry and you end up, theoretically, with over 200 bps of upward pressure on yields, which would of course pressure the US economy and force the Fed, to whatever degree they might have tightened by the time China’s 365-day liquidation sale ends, to reverse course quickly. Deutsche Bank comes to similar conclusions. To wit:
Which of course means the Fed is stuck:
Put simply, raising rates now would be to tighten into a tightening. That is, the liquidation of EM FX reserves is QE in reverse. The end of the great EM FX reserve accumulation means QT is set to proliferate in the face of stubbornly low commodity prices and decelerating Chinese growth. And indeed, if the slowdown in global demand and trade turns out to be structural and endemic rather than cyclical, the pressure on EM could continue unabated for years to come. The bottom line is this: if the Fed hikes into QT, it will exacerbate capital outflows from EM, which will intensify reserve draw downs, necessitating a quick (and likely embarrassing) reversal of Fed policy and perhaps even QE4. |
|||
| Market | |||
| TECHNICALS & MARKET |
|
||
Submitted by Tyler Durden on 09/01/2015 16:31
The Market's "Other" Panic Indicator Just Went Off The ChartsWith indicators from macro-fundamentals (e.g. retail sales, core capex, inventory-to-sales) to market-oriented measures (VIX levels and backwardation, HY credit spreads, commodity prices) all flashing various colors of dead canary in the coal-mine red, we thought today's colossal spike in the Arms (TRIN) Index was a notable addition. An Arms Index value above one is bearish, a value below one is bullish and a value of one indicates a balanced market. Traders look not only at the value of the index, but also at how it changes throughout the day. Traders look for extremes in the index value for signs that the market may soon change directions. The Arm's Index was invented by Richard W. Arms, Jr. in 1967. In essence, a sudden surge in the TRIN indicates a jump in trader lack of confidence, as everyone scrambles to either go long the 2-3 rising stocks, or to sell or short the biggest decliners, ignoring the bulk of the market.. Today's move was far greater than "Black Monday's market-halting crash: In longer context: As we noted previously, the Arms index is an indicator of market breadth essentially tracks lemming like momentum-chasing behavior with respect to volume... meaning today saw panic-buying volumes which given that it was dip-buyers at the close, we suspect won't end well... Trade accordingly.... |
|||
| COMMODITY CORNER - AGRI-COMPLEX | PORTFOLIO | ||
| SECURITY-SURVEILANCE COMPLEX | PORTFOLIO | ||
| THESIS - Mondays Posts on Financial Repression & Posts on Thursday as Key Updates Occur | |||
| 2015 - FIDUCIARY FAILURE | 2015 | THESIS 2015 |  |
| 2014 - GLOBALIZATION TRAP | 2014 |  |
|
|
2013 2014 |
|||
DANIELLE DIMARTINO BOOTH TALKS FINANCIAL REPRESSION A CAMP KOTOK 2015 GUEST Having done lots of fishing this summer at Camp Kotok in northern Maine, Danielle DiMartino Booth is here interviewed by FRA's Gordon T Long. Danielle is a former Dallas Federal Reserve Bank Advisor and now the Chief Market Strategist of The Liscio Report. She takes an Austrian School of Economics viewpoint on economic and financial matters. Danielle emphasizes how she understands financial repression "in her bones" because she worked in "The Financial Repression Factory", referring to the Federal Reserve. She understands the level of malinvestment, mispricing and lack of price discovery as the unintended consequences of repressive and obfuscating monetary policies of central banks. She thinks the Federal Reserve "does not have a deep enough appreciation of malinvestment .. as if Ludwig von Mises never walked the planet." She is angered by the considerable level of savings which has been foregone thanks to the quantitative easing (QE) policies of the Federal Reserve. Gone are the days of retiring on a Certificate of Deposit paying a decent level of interest income, due to the virtually 0% interest rates. Danielle says there must be a renewed emphasis on education and innovation in America for it create jobs and jobs that are higher-paying generally than is currently the case. Check out her recent speech - subscribe to our Mailing and Alert System and we will email you the PDF or view the Scribd below: July 2015 Speech by Danielle DiMartino Booth �
|
|||
2011 2012 2013 2014 |
|||
| THEMES - Normally a Thursday Themes Post & a Friday Flows Post | |||
I - POLITICAL |
|||
| CENTRAL PLANNING - SHIFTING ECONOMIC POWER - STATISM | THEME | ||
- - CORRUPTION & MALFEASANCE - MORAL DECAY - DESPERATION, SHORTAGES. |
THEME |  |
|
| - - SECURITY-SURVEILLANCE COMPLEX - STATISM | M | THEME | |
| - - CATALYSTS - FEAR (POLITICALLY) & GREED (FINANCIALLY) | G | THEME | |
II-ECONOMIC |
|||
| GLOBAL RISK | |||
| - GLOBAL FINANCIAL IMBALANCE - FRAGILITY, COMPLEXITY & INSTABILITY | G | THEME | |
| - - SOCIAL UNREST - INEQUALITY & A BROKEN SOCIAL CONTRACT | US | THEME | |
Source: The Lonely Libertarian
|
|||
Submitted by Mike Krieger via Liberty Blitzkrieg blog, We were told we needed to bail out Wall Street in order to save Main Street. Well the results are in… Wall Street has never done better, and Main Street has never done worse. From the Huffington Post:
Where’s our hero when you need him?
|
|||
| - - ECHO BOOM - PERIPHERAL PROBLEM | M | THEME | |
| - -GLOBAL GROWTH & JOBS CRISIS | |||
| - - - PRODUCTIVITY PARADOX - NATURE OF WORK | THEME | MACRO w/ CHS |
|
| - - - STANDARD OF LIVING - EMPLOYMENT CRISIS, SUB-PRIME ECONOMY | US | THEME | MACRO w/ CHS |
III-FINANCIAL |
|||
| FLOWS -FRIDAY FLOWS | MATA RISK ON-OFF |
THEME | |
| CRACKUP BOOM - ASSET BUBBLE | THEME | ||
| SHADOW BANKING - LIQUIDITY / CREDIT ENGINE | M | THEME | |
| GENERAL INTEREST |
|
||
| STRATEGIC INVESTMENT INSIGHTS - Weekend Coverage | |||
|
SII | ||
|
SII | ||
|
SII | ||
|
SII | ||
| TO TOP | |||
Read More - OUR RESEARCH - Articles Below
Tipping Points Life Cycle - Explained
Click on image to enlarge
TO TOP
�
TO TOP
