|
JOHN RUBINO'SLATEST BOOK |
||||||||||||||||||||||||||||||||||||||||||||||||||||||||||||||||||||||||||||||||||||||||||||||||||||||||||||||||||||||||||||||||||||||||||||||||||||||||||||||||||||||||||||||||||||||||||||||||||||||||||||||||||||||||||||||||||||||||||||||||||||||||||||||||||||||
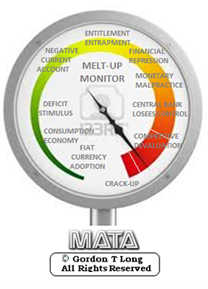
"MELT-UP MONITOR "
Meltup Monitor: FLOWS - The Currency Cartel Carry Cycle - 09 Dec 2013 Meltup Monitor: FLOWS - Liquidity, Credit & Debt - 04 Dec 2013 Meltup Monitor: Euro Pressure Going Critical - 28- Nov 2013 Meltup Monitor: A Regression-to-the-Exponential Mean Required - 25 Nov 2013
|

![]()
"DOW 20,000 "
Lance Roberts Charles Hugh Smith John Rubino Bert Dohman & Ty Andros
|

HELD OVER
Currency Wars
Euro Experiment
Sultans of Swap
Extend & Pretend
Preserve & Protect
Innovation
Showings Below
"Currency Wars "
|


"SULTANS OF SWAP" archives open ACT II ACT III
ALSO Sultans of Swap: Fearing the Gearing! Sultans of Swap: BP Potentially More Devistating than Lehman! |

"EURO EXPERIMENT"
archives open EURO EXPERIMENT : ECB's LTRO Won't Stop Collateral Contagion!
EURO EXPERIMENT: |

![]()
"INNOVATION"
archives open |

"PRESERVE & PROTE CT"
archives open |

Fri. Aug. 21st, 2015
Follow Our Updates
onTWITTER
https://twitter.com/GordonTLong
AND FOR EVEN MORE TWITTER COVERAGE
ANNUAL THESIS PAPERS
FREE (With Password)
THESIS 2010-Extended & Pretend
THESIS 2011-Currency Wars
THESIS 2012-Financial Repression
THESIS 2013-Statism
THESIS 2014-Globalization Trap
THESIS 2015-Fiduciary Failure
NEWS DEVELOPMENT UPDATES:
FINANCIAL REPRESSION
FIDUCIARY FAILURE
WHAT WE ARE RESEARCHING
2015 THEMES
SUB-PRIME ECONOMY
PENSION POVERITY
WAR ON CASH
ECHO BOOM
PRODUCTIVITY PARADOX
FLOWS - LIQUIDITY, CREDIT & DEBT
GLOBAL GOVERNANCE
- COMING NWO
WHAT WE ARE WATCHING
(A) Active, (C) Closed
MATA
Q3 '15- Chinese Market Crash
(A)
Q3 '15-
GMTP
Q3 '15- Greek Negotiations
(A)
Q3 '15- Puerto Rico Bond Default
MMC
OUR STRATEGIC INVESTMENT INSIGHTS (SII)
NEGATIVE-US RETAIL
NEGATIVE-ENERGY SECTOR
NEGATIVE-YEN
NEGATIVE-EURYEN
NEGATIVE-MONOLINES
POSITIVE-US DOLLAR
ARCHIVES
| AUGUST | ||||||
| S | M | T | W | T | F | S |
| 1 | ||||||
| 2 | 3 | 4 | 5 | 6 | 7 | 8 |
| 9 | 10 | 11 | 12 | 13 | 14 | 15 |
| 16 | 17 | 18 | 19 | 20 | 21 | 22 |
| 23 | 24 | 25 | 26 | 27 | 28 | 29 |
| 30 | 31 | |||||
KEY TO TIPPING POINTS |
| 1- Bond Bubble |
| 2 - Risk Reversal |
| 3 - Geo-Political Event |
| 4 - China Hard Landing |
| 5 - Japan Debt Deflation Spiral |
| 6- EU Banking Crisis |
| 7- Sovereign Debt Crisis |
| 8 - Shrinking Revenue Growth Rate |
| 9 - Chronic Unemployment |
| 10 - US Stock Market Valuations |
| 11 - Global Governance Failure |
| 12 - Chronic Global Fiscal ImBalances |
| 13 - Growing Social Unrest |
| 14 - Residential Real Estate - Phase II |
| 15 - Commercial Real Estate |
| 16 - Credit Contraction II |
| 17- State & Local Government |
| 18 - Slowing Retail & Consumer Sales |
| 19 - US Reserve Currency |
| 20 - US Dollar Weakness |
| 21 - Financial Crisis Programs Expiration |
| 22 - US Banking Crisis II |
| 23 - China - Japan Regional Conflict |
| 24 - Corruption |
| 25 - Public Sentiment & Confidence |
| 26 - Food Price Pressures |
| 27 - Global Output Gap |
| 28 - Pension - Entitlement Crisis |
| 29 - Central & Eastern Europe |
| 30 - Terrorist Event |
| 31 - Pandemic / Epidemic |
| 32 - Rising Inflation Pressures & Interest Pressures |
| 33 - Resource Shortage |
| 34 - Cyber Attack or Complexity Failure |
| 35 - Corporate Bankruptcies |
| 36 - Iran Nuclear Threat |
| 37- Finance & Insurance Balance Sheet Write-Offs |
| 38- Government Backstop Insurance |
| 39 - Oil Price Pressures |
| 40 - Natural Physical Disaster |
Reading the right books?
No Time?
We have analyzed & included
these in our latest research papers Macro videos!
OUR MACRO ANALYTIC
CO-HOSTS
John Rubino's Just Released Book
Charles Hugh Smith's Latest Books


Our Macro Watch Partner
Richard Duncan Latest Books
MACRO ANALYTIC
GUESTS
F William Engdahl


OTHERS OF NOTE
Book Review- Five Thumbs Up
for Steve Greenhut's Plunder!


![]()
TODAY'S TIPPING POINTS
|
Have your own site? Offer free content to your visitors with TRIGGER$ Public Edition!
Sell TRIGGER$ from your site and grow a monthly recurring income!
Contact [email protected] for more information - (free ad space for participating affiliates).
HOTTEST TIPPING POINTS |
Theme Groupings |
||
We post throughout the day as we do our Investment Research for: LONGWave - UnderTheLens - Macro
|
|||
|
MOST CRITICAL TIPPING POINT ARTICLES TODAY
|
|
||
|
|||
Submitted by Tyler Durden on 08/17/2015 15:35
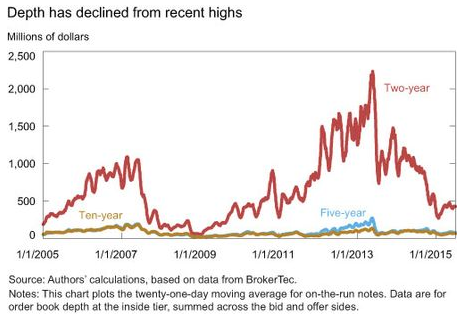
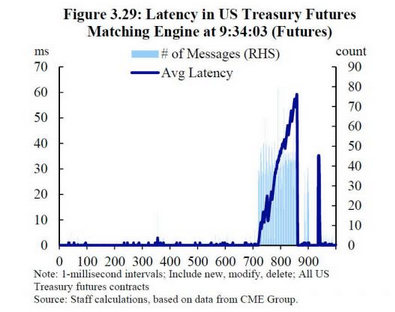
Fed Goes Looking For Evidence Of Broken Treasury Market, Decides Everything Is FineOne doesn’t have to look very far to find evidence that the Fed’s monumental attempt to corner the Treasury market is producing all manner of distortions and anomalies. For example, one could point to episodic instances of acute collateral shortages manifested by "immensely" special repo rates. If that’s too esoteric for you, just go and have a look at a 10Y chart from October 15 of last year and ask yourself what happened there. Put simply, when someone comes along and does a multi-trillion dollar bellyflop into any market - even one that could previously be described as the deepest and most liquid on the planet - there are bound to be far-reaching repercussions for market function and that’s precisely what’s happening, and not only in USTs but in JGBs and most recently in German bunds. Apparently someone at the NY Fed decided that with everyone in the financial universe suddenly screaming about liquidity (or a lack thereof) it was time to take a cursory look at the issue and make a half-hearted, slightly disingenuous attempt to find out if there’s really a problem. So that’s exactly what Tobias Adrian, Michael Fleming, Daniel Stackman, and Erik Vogt did. There results are posted on the NY Fed’s blog and we present some of the highlights below.
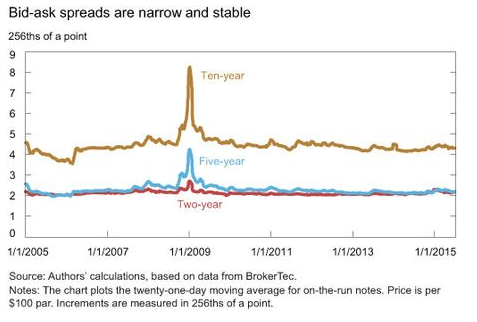
Of course bid-asks aren’t really the best way to assess this - market depth is. That is, the question is this: can you transact in size without accidently causing some kind of catastrophe? On that question the NY Fed is a bit less optimistic.
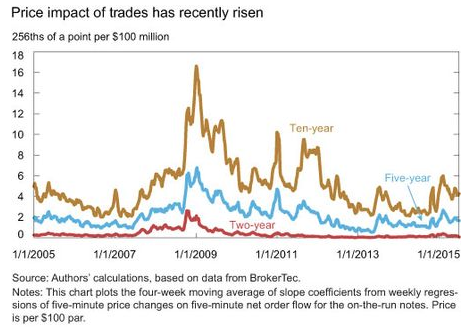
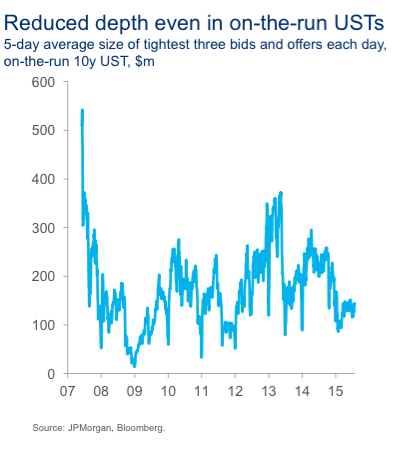
The authors' takeaway from the above is that "high-frequency liquidity measures provide a mixed message regarding the state of Treasury liquidity." And while that doesn't sound particularly comforting, we shouldn't worry because the Fed doesn't think those are actually the right measures. When one looks at another set of indicators, everything is actually ok. To wit: "...the daily measures we consider are more consistent." As an aside, it would have helped if, in the depth chart shown above, they hadn't plotted the 10Y on the same chart with the 2Y because as you can see from the following, the picture looks a little different when the 10Y is plotted on its own.
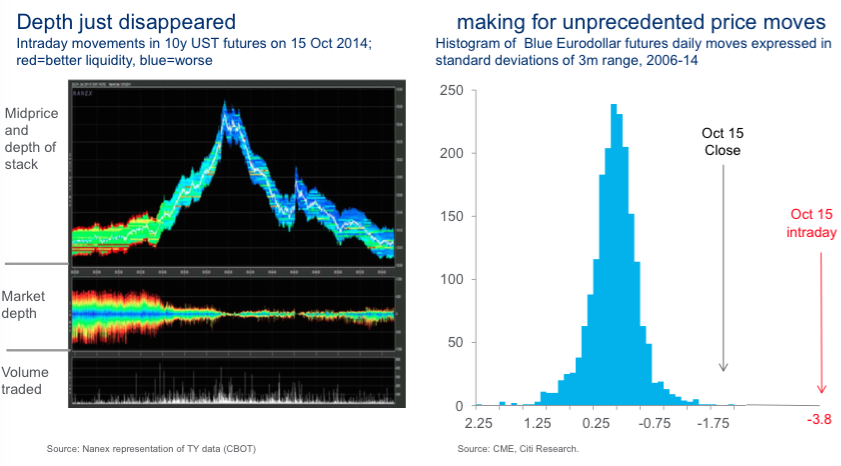
All in all, the authors conclude that "the current state of Treasury market liquidity [is] fairly favorable," but do concede that "the events of October 15 and similar episodes of sharp, seemingly unexplained price changes in the dollar-euro and German Bund markets have heightened worry about tail events in which liquidity suddenly evaporates." Why yes, yes they do "heighten worries" because as you can see from the following, market depth just seems to disappear out of the clear blue nowadays.
We also noticed that at the end of the article, the authors promise to ferret out the causes of such anomalous events "in a future blog post." To the NY Fed we say this: we know the good folks at 33 Liberty have more important things to do (like running the equity plunge protection team) than spending time searching for the culprits behind the Treasury flash crash, so we'll go ahead and point you in the right direction. First, look in the mirror, next refer to the graphic shown below.
Mystery solved. You are welcome. |
|||
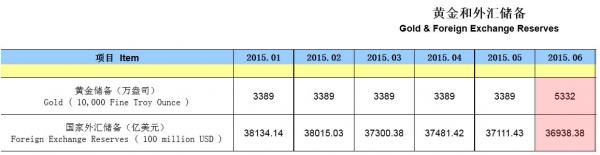
Submitted by Tyler Durden [1] on 07/22/2015 19:40 China's Record Dumping Of US Treasuries Leaves Goldman SpeechlessOn Friday, alongside China's announcement that it had bought over 600 tons of gold in "one month", the PBOC released another very important data point [12]: its total foreign exchange reserves, which declined by $17.3 billion to $3,694 billion.
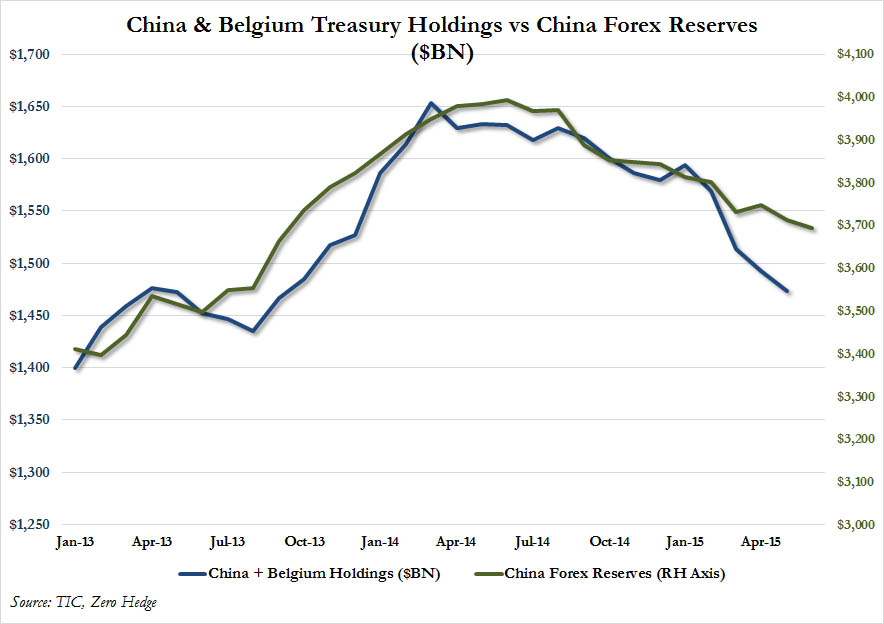
We then put China's change in FX reserves alongside the total Treasury holdings of China and its "anonymous" offshore Treasury dealer Euroclear (aka "Belgium") as released by TIC, and found that the dramatic relationship which we first discovered back in May [13], has persisted - namely virtually the entire delta in Chinese FX reserves come via China's US Treasury holdings. As in they are being aggressively sold, to the tune of $107 billion in Treasury sales so far in 2015.
We explained all of his on Friday in "China Dumps Record $143 Billion In US Treasurys In Three Months Via Belgium [15]", and frankly we have been surprised that this extremely important topic has not gotten broader attention. Then, to our relief, first JPM noticed. This is what Nikolaos Panigirtzoglou, author of Flows and Liquidity had to say on the topic of China's dramatic reserve liquidation
JPM conclusion is actually quite stunning:
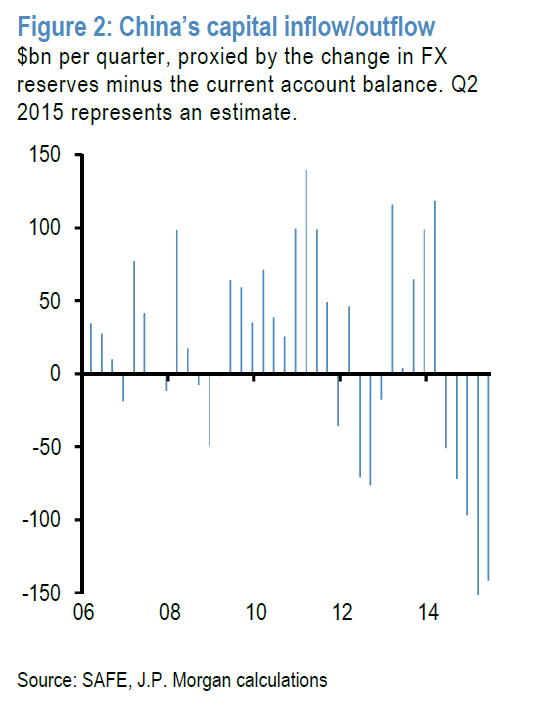
Incidentally, $520 billion is roughly triple what implied Treasury sales would suggest as China's capital outflow, meaning that China is also liquidating some other USD-denominated asset(s) at a feverish pace. So far we do not know which, but the chart above and the magnitude of the Chinese capital outflow is certainly the biggest story surrounding the world's most populous nation: what is happening in its stock market is just a diversion. At this point JPM goes into a tangent explaining what the practical implications of a massive capital outflow from China are for the global economy. Regular readers, especially those who have read our previous piece on the collapse in the Petrodollar [17], the plunge in EM capital inflows, and their impact on capital markets and global economies can skip this part. Those for whom the interplay of capital flows and the global economy are new, are urged to read the following:
Summarizing the above as simply as possible: for all those confounded by why not only the US, but the global economy, hit another brick wall in Q1 the answer was neither snow, nor the West Coast strike, nor some other, arbitrary, goal-seeked excuse, but China, and specifically over half a trillion in still largely unexplained Chinese capital outflows. * * * But wait, because it wasn't just JPM whose attention perked up over the weekend. This morning Goldman Sachs itself had a note titled "the Curious Case of China's Capital Outflows":
Granted, this is smaller than JPM's $520 billion number but this also captures a far shorter time period. Annualizing a $224 billion outflow in one quarter would lead to a unprecedented $1 trillion capital outflow out of China for the year. Needless to say, a capital exodus of that pace and magnitude would suggest that something is very, very wrong with not only China's economy, but its capital markets, and last but not least, its capital controls, which prohibit any substantial outbound capital flight (at least for ordinary people, the Politburo is clearly exempt from the regulations for the "common folk"). Back to Goldman:
In other words, for once Goldman is speechless, however it is quick to point out that what traditionally has been a major source of reserve reflow, the Chinese current and capital accounts, is no longer there. It also means that what may have been one of the biggest drivers of DM FX strength in recent years, if only against the pegged Renminbi, is suddenly no longer present. While the implications of this on the global FX scene are profound, they tie in to what we said last November [17]when explaining the death of the petrodollar. For the most part, the country most and first impacted from this capital outflow will be China, something its stock market has already noticed in recent weeks. But what is likely the take home message for non-Chinese readers from all of this, is that while there has been latent speculation over the years that China will dump US treasuries voluntarily because it wants to (as punishment or some other reason), suddenly China is forced to liquidate US Treasury paper even though it does not want to, merely to fund a capital outflow unlike anything it has seen in history. It still has a lot of 10 Year paper, aka FX reserves, left: about $1.3 trillion at last check, however this raises two critical questions: i) what happens to 10 Year rates when whoever has been absorbing China's Treasury dump no longer bids the paper and ii) how much more paper can China sell before the entire world starts paying attention, besides just JPM and Goldman... and this website of course. Finally, if China's selling is only getting started, just what does this mean for future Fed strategy. Because one can easily forget a rate hike if in addition to rising short-term rates, China is about to dump a few hundred billion in paper on a vastly illiquid market. Or let us paraphrase: how soon until QE 4? |
|||
| MOST CRITICAL TIPPING POINT ARTICLES THIS WEEK - August 16th, 2015 - August 22nd, 2015 | |||
| BOND BUBBLE | 1 | ||
| RISK REVERSAL - WOULD BE MARKED BY: Slowing Momentum, Weakening Earnings, Falling Estimates | 2 | ||
| GEO-POLITICAL EVENT | 3 | ||
| CHINA BUBBLE | 4 | ||
China Stocks Crash, More Than Half Of Market Halted Limit Down; PBOC Loss Of Control Spooks Global Assets Submitted by Tyler Durden on 08/18/2015 - 08:09 Submitted by Tyler Durden on 08/18/2015 - 08:09
Just hours after the PBOC announced a modestly "revalued" fixing in the CNY, which curiously led to weaker trading in the onshore Yuan for most of the day before a forceful last minute intervention by the central bank pushed it back down to 6.39 it was the local stock market spinning plate - which had been relatively stable during the entire FX devaluation process - that China lost control over, and after 7 days of margin debt increases the Shanghai Composite plunged by 6.2% in late trade, tumbling 245 points to 3748, just 240 points above its recent trough on July 8, a closing level some 27% off its June peak. Indonesia Impaled: Currency Crashes To 1998 Asian Crisis Low As Exports CraterOn Monday we laid out the rather dire road ahead for the world’s emerging economies in the face of China’s entry into the global currency wars. The path ahead is riddled with exported deflation and decreased trade competitiveness for a whole host of emerging economies [and] all of this is set against a backdrop of declining global growth and trade, a trend which many had assumed was merely cyclical, but which in fact may prove to be structural and endemic." Well don’t look now, but trade just collapsed for Indonesia as exports and imports plunged 19.2% and 28.4% (more than double to consensus estimate), respectively in July. Meanwhile, the rupiah is sitting near multi-decade lows. Asian Currency Crisis Continues As China Holds, Malaysia Folds, & Japan Heads For Quintuple Dip Recession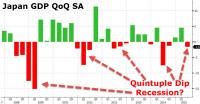 Submitted by Tyler Durden on 08/16/2015 - 21:21 Submitted by Tyler Durden on 08/16/2015 - 21:21
Asia got off to an inauspicious start this evening with Japan printing a disappointing 1.6% drop in GDP - heading for its fifth recession in 6 years... so much for Abenomics, but, of course, Amari spewed forth some standard propaganda that he expects Japan to recover moderately (and Japanese stocks popped modestly assuming moar QQE). Then Malaysia continued its collapse with the Ringgit down another 1% hitting fresh 17-year lows and stocks dropping further, as the Asian Currency crisis continues. Heading into the China open, offshore Yuan signaled further devaluation but the CNY Fix printed very modestly stronger at 6.3969; and following last week's best gains in 2 months, Chinese stocks are plunging at the open after Chinese farmers extend their streak of margin debt increases. Finally, WTI Crude drifted back to a $41 handle in early futures trading. Futures Flat As Oil Drops To Fresh 6 Year Low; EM Currencies Crumble Under Continuing FX War Submitted by Tyler Durden on 08/17/2015 - 06:27 Submitted by Tyler Durden on 08/17/2015 - 06:27
It was a relatively quiet weekend out of China, where FX warfare has taken a back seat to evaluating the full damage from the Tianjin explosion which as we reported on Saturday has prompted the evacuation of a 3 km radius around the blast zone, and instead it was Japan that featured prominently in Sunday's headlines after its Q2 GDP tumbled by 1.6% (a number which would have been far worse had Japan used a correct deflator), and is now halfway to its fifth recession in the past 6 year, underscoring Abenomics complete success in desrtoying Japan's economy just to get a few rich people richer. Of course, economic disintegration is great news for stocks, and courtesy of the latest Yen collapse driven by the bad GDP data which has raised the likelihood of even more Japanese QE, the Nikkei closed 100 points, or 0.5% higher.
|
08-18-15 | TP - CHINA THEMES ECHO BOOM
|
4 - China Hard Landing |
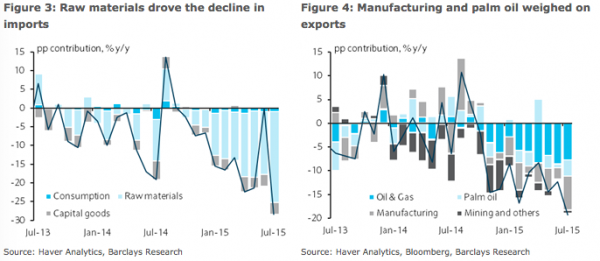
Submitted by Tyler Durden on 08/18/2015 07:53 Indonesia Impaled: Currency Crashes To 1998 Asian Crisis Low As Exports CraterOn Monday we laid out the rather dire road ahead for the world’s emerging economies in the face of China’s entry into the global currency wars. The path ahead is riddled with exported deflation and decreased trade competitiveness for a whole host of emerging economies [and] all of this is set against a backdrop of declining global growth and trade, a trend which many had assumed was merely cyclical, but which in fact may prove to be structural and endemic." Well don’t look now, but trade just collapsed for Indonesia as exports and imports plunged 19.2% and 28.4% (more than double to consensus estimate), respectively in July. Imports of raw materials dove 24%. Manufacturing and palm oil exports fell 7.1% and 2.4%, respectively, nearly tripling June’s declines. Oil and gas exports fell nearly 8%.
Meanwhile, Bank of Indonesia kept its policy rate on hold at 7.5% and indeed the bank looks to be stuck in a dilemma similar to what we described earlier this month when we noted that "EM central bankers are grappling with slumping exports and FX-pass through inflation or, more simply, bankers are caught between a 'can’t cut to boost the economy' rock and a 'can’t hike to tame inflation' hard place. The rupiah, like the Malaysian ringgit, is trading near multi-decade lows and hit its weakest level since August 1998 earlier in the session.Depressed commodity prices and slumping demand from China aren’t helping. And neither is Beijing's devaluation of the yuan which means that suddenly, Indonesia has lost export competitiveness to China while anything China imports from Indonesia will now cost more. "We believe there is a strong case for the central bank remaining on hold this year," Barclays notes, adding that "BI is visibly more reluctant to weaken the IDR in the near term, to avoid stoking imported price pressures[and] the commodity drag due to weaker demand from China has not subsided." Similarly, Toru Nishihama, EM economist at Dai-ichi Life Research Institute says the "hurdle is higher for BI to cut rate due to the rupiah’s move even though inflation will slow toward year-end due to base effect from last year’s fuel price increase." Of course cuts, even if they do come, are now less effective in terms of boosting exports as the yuan devaluation puts upward pressure on regional NEER.
In other words, there are no right answers. Just more pain and further pressure on the beleaguered economy and severely battered currency and further evidence that between China's entry into the global currency wars, depressed global commodity prices, the threat of an imminent Fed hike, and a generally lackluster environment for global demand and trade, the world's emerging markets face a perfect storm with no end in sight. |
|||
| JAPAN - DEBT DEFLATION | 5 | ||
EU BANKING CRISIS |
6 |
||
| TO TOP | |||
| MACRO News Items of Importance - This Week | |||
GLOBAL MACRO REPORTS & ANALYSIS |
|||
US ECONOMIC REPORTS & ANALYSIS |
|||
| CENTRAL BANKING MONETARY POLICIES, ACTIONS & ACTIVITIES | |||
| Market | |||
| TECHNICALS & MARKET |
|
||
23 Nations Around The World Where Stock Market Crashes Are Already HappeningPosted:Tue, 18 Aug 2015 14:54:28 GMTSubmitted by Michael Snyder via The Economic Collapse blog, You can stop waiting for a global financial crisis to happen. The truth is that one is happening right now. All over the world, stock markets are already crashing. Most of these stock market crashes are occurring in nations that are known as “emerging markets”. In recent years, developing countries in Asia, South America and Africa loaded up on lots of cheap loans that were denominated in U.S. dollars. But now that the U.S. dollar has been surging, those borrowers are finding that it takes much more of their own local currencies to service those loans. At the same time, prices are crashing for many of the commodities that those countries export. The exact same kind of double whammy caused the Latin American debt crisis of the 1980s and the Asian financial crisis of the 1990s. As you read this article, almost every single stock market in the world is down significantly from a record high that was set either earlier this year or late in 2014. But even though stocks have been sliding in the western world, they haven’t completely collapsed just yet. In much of the developing world, it is a very different story. Emerging market currencies are crashing hard, recessions are starting, and equity prices are getting absolutely hammered. Posted below is a list that I put together of 23 nations around the world where stock market crashes are already happening. To see the stock market chart for each country, just click the link… 1. Malaysia 2. Brazil 3. Egypt 4. China 5. Indonesia 6. South Korea 7. Turkey 8. Chile 9. Colombia 10. Peru 11. Bulgaria 12. Greece 13. Poland 14. Serbia 15. Slovenia 16. Ukraine 17. Ghana 18. Kenya 19. Morocco 20. Nigeria 21. Singapore 22. Taiwan 23. Thailand Of course this is just the beginning. The western world is going to feel this kind of pain as well very soon. I want to share with you an excerpt from an article that just appeared in the Telegraph entitled “Doomsday clock for global market crash strikes one minute to midnight as central banks lose control“. You see, the Telegraph is not just one of the most important newspapers in the UK – it is truly one of the most important newspapers in the entire world. When it speaks on financial matters, millions of people listen very carefully. So for the Telegraph to declare that the countdown to a “global market crash” is “one minute to midnight” is a very, very big deal…
I encourage you to read the rest of that excellent article right here. It contains lots of charts and graphs, and it discusses many of the exact same things that I have been hammering on for months. When one of the newspapers of record for the entire planet starts sounding exactly like The Economic Collapse Blog, then you know that it is late in the game. Others are sounding the alarm about an imminent global financial crash as well. For example, just consider what Egon von Greyerz recently told King World News…
Hmm – there is another example of someone talking about September. It is funny how often that monthkeeps coming up. And of course most of the major stock market crashes in U.S. history have been in the fall. Just go back and take a look at what happened in 1929, 1987, 2001 and 2008. The “smart money” has been pulling their money out of stocks for quite a while now, and at this point a lot of others have hopped on the bandwagon. The following comes from CNBC…
A global financial crisis has already begun. So those that were claiming that one would not happen in 2015 are already wrong. Over the coming months we will find out how bad it will ultimately be. Sometimes I get criticized for talking about these things. There are a few people out there that don’t like all of the “doom and gloom” that I discuss on my website. Apparently it is a bad thing to talk about the things that really matter and we should all just be “keeping up with the Kardashians” instead. I consider myself just to be another watchman on the wall. From our spots on the wall, watchmen such as myself all over the nation are sounding the alarm about what we clearly see coming. If we saw what was coming and we did not warn the people, their blood would be on our hands. But if we do warn the people, then we have done our duty. Every day I just do the best that I can with what I have been given. And there are many others just like me that are doing exactly the same thing. Those that do not like the warning message are going to feel really stupid when things start falling apart all around them and they finally realize how wrong they truly were. |
08-19-15 | STUDIES | |
| COMMODITY CORNER - AGRI-COMPLEX | PORTFOLIO | ||
| SECURITY-SURVEILANCE COMPLEX | PORTFOLIO | ||
| THESIS - Mondays Posts on Financial Repression & Posts on Thursday as Key Updates Occur | |||
| 2015 - FIDUCIARY FAILURE | 2015 | THESIS 2015 |  |
| 2015 - FIDUCIARY FAILURE | 2015 | THESIS 2015 | |
Submitted by Tyler Durden on 08/16/2015 21:00
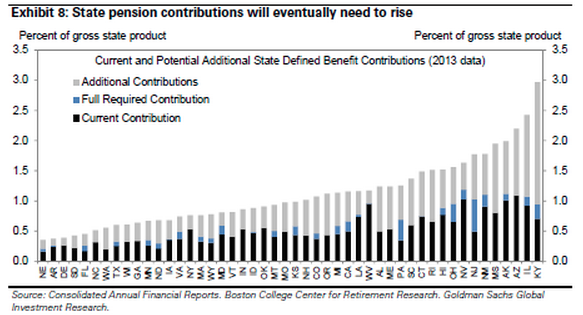
Goldman Weighs In On America's Pension Ponzi: Contributions Must Rise $100 Billion Per YearOver the past several months, we’ve taken a keen interest in the deteriorating condition of state and local government finances in America. Moody’s move to downgrade the city of Chicago to junk in May put fiscal mismanagement in the national spotlight and indeed, the Illinois Supreme Court ruling that triggered the downgrade (in combination with a subsequent ruling by a Cook County court which struck down a bid to reform the city’s pensions), effectively set a precedent for other states and localities, meaning that now, solving the growing underfunded pension liability problem will be that much more difficult. Just how big of a problem is this you ask? Well, pretty big, according to Moody’s which, as we noted last month, contends that the largest 25 public pensions are underfunded by some $2 trillion. It’s against that backdrop that we present the following graphic and color from Goldman which together demonstrate the amount by which state and local governments would need to raise contributions to "bring plans into balance over time."
From Goldman:
|
|||
Submitted by Tyler Durden on 08/20/2015 Via MyBudget360.com,
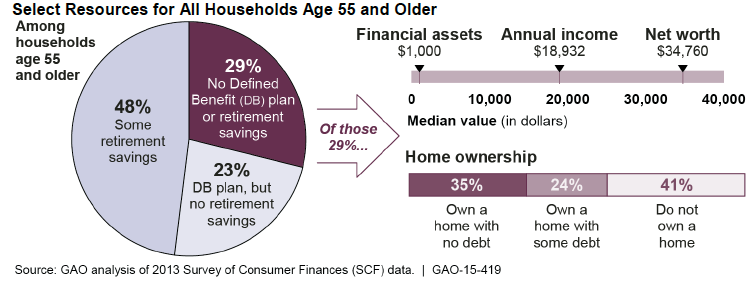
The Baby Boom Will Never Retire - Half Have No Retirement Savings At AllSome of you might remember the glossy highly produced advertisements back in the early 1980s when Wall Street decided it was time to turn American retirement plans into casinos. The slow and agonizing death of the pension plan was supposed to be replaced by the beautiful and wonderful world of the 401(k) plan. Save for 30 years and in the end, you will be a millionaire just like your friends on Wall Street that sincerely care about your financial future. Of course since then, we have found out about junk bond scandals, mutual fund fees that make loan sharks look conservative, and of course the financial shenanigans of giving people toxic mortgages that were essentially ticking time bombs of destruction. This was the industry that was put in charge of helping you plan for your future. We are now a generation out from those slick ads and the results have been disastrous for most Americans. A recent analysis found that half of US households 55 and older have no money stashed away for retirement. The new retirement is no retirement Planning for retirement takes time. Saving money is a slow process. There was a time when simply stashing money into CDs and savings bonds was enough to have a nice nest egg if you were diligent enough. Yet for the last decade, most banks are paying close to zero percent on their savings accounts thanks to the Fed’s low rate policy to juice the markets. Since the true inflation rate is much higher, you are essentially letting your money rot away. So the only other option is for people to invest in the stock market or try to leverage into real estate. The stock market is largely an arena for the wealthy. Half of Americans own no stocks at all. Now after a generation, we are finding out that most people did not follow in the footsteps of those glossy over produced retirement ads:
Source: GAO
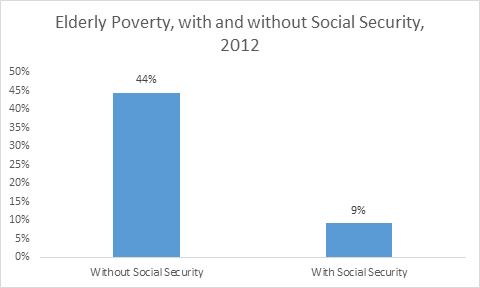
The idea that all older Americans own their home free and clear is simply not true. Only 35 percent own their home free and clear from debt (and this does not mean they don’t have expenses like taxes, insurance, and maintenance). 24 percent are still saddled with mortgage debt. And 41 percent do not own a home meaning they have to pay rents that continue tooutpace any wage gains. The median net worth of those 55 and older is $34,760. This is basically one small illness from bankrupting this family. The median annual income of those 55 and older is $18,932 which makes them part of the new low wage America cohort. On the retirement side 48 percent have some retirement savings (not much). 29 percent have no pension or retirement savings. And 23 percent have a pension but no retirement savings. In the end, it is a tough situation for many older Americans. And that is why older Americans rely heavily on Social Security as their primary source of income into old age:
If it were not for Social Security, half of retirees would be out in the street bringing back another Great Depression like atmosphere. This is in stark contrast to that 401(k) dreams pushed by Wall Street investment banks of endless Margaritas and walks on nameless sunny beaches. The sad reality is that retirement is no longer what people think. And keep in mind this is happening to the baby boomer generation that lived through some mega US prosperity and stock market bull runs. What about young Americans today that are starting in an even more precarious position thanks to the insane cost of going to college and the mountain of student debt? Many people are realizing that retirement is a luxury only a few can afford.
|
|||
| 2014 - GLOBALIZATION TRAP | 2014 |  |
|
 |
|||
|
2013 2014 |
 |
||
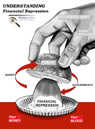
FINANCIAL REPRESSION The Unseen Consequences of Zero Interest Rate Policy Incrementum's Ronald-Peter Stöferle explains how central banks with a zero interest rate policy (ZIRP) in place are creating unintenddd consequences & associated adverse risks to investors & retirees .. it's financial repression .. "With artificial stimulus like ZIRP, we only end up with a situation in which governments, financial institutions, entrepreneurs, and consumers who should actually be declared insolvent all remain on artificial life support." .. with the unintended consequences being: 1. Conservative investors by nature come under increasing pressure with respect to their investments & take on excessive risks in light of the prospect that interest rates will remain low in the long term. This leads to capital misallocation & the emergence of bubbles. 2. The sweet poison of low interest rates leads to massive asset price inflation (stocks, bonds, works of art, real estate). 3. Structurally too low interest rates in industrialized nations due to carry trades lead to the emergence of asset price bubbles & contagion effects in emerging markets. 4. Changes in human behavior patterns occur, due to continually declining purchasing power. 5. As a result of the structurally too low level of interest rates, a 'culture of instant gratification' is created, which is among other things characterized by the fact that consumption is financed with credit instead of savings. 6. The medium of exchange and unit of account function of money increases in importance, while its role as a store of value declines. 7. Incentives for fiscal discipline decline. 8. Zombie banks are created: Low interest rates prevent the healthy process of creative destruction. 9. Banks are enabled to roll over potentially non-performing loans practically indefinitely & can thus lower their write-off requirements. 9. Newly created money is neither uniformly nor simultaneously distributed amongst the population
The Unintended Consequences of Financial Repression: "The Impossibility of Meeting Return Targets" Greenwich Associates conducted a study on German institutions .. some quotes from the study: “The low interest rate environment makes it impossible to meet return targets. We have not yet found a solution.” — German Public Pension Fund. “Low interest rates are a problem. As a reaction, we have globalized our investments and invested in higher risk asset classes.” — German Foundation “Primary challenge is the low interest rates. The only chance to avoid this is to do things you didn’t do before.” — German Insurer. For many institutions in Germany, “doing things they didn’t do before” means investing significant amounts of assets in something other than domestic & government bonds.
|
08-17-15 | ||
2011 2012 2013 2014 |
 |
||
| THEMES - Normally a Thursday Themes Post & a Friday Flows Post | |||
I - POLITICAL |
|||
| CENTRAL PLANNING - SHIFTING ECONOMIC POWER - STATISM | THEME | ||
- - CORRUPTION & MALFEASANCE - MORAL DECAY - DESPERATION, SHORTAGES. |
THEME |  |
|
| - - SECURITY-SURVEILLANCE COMPLEX - STATISM | M | THEME | |
| - - CATALYSTS - FEAR (POLITICALLY) & GREED (FINANCIALLY) | G | THEME | |
II-ECONOMIC |
|||
| GLOBAL RISK | |||
| - GLOBAL FINANCIAL IMBALANCE - FRAGILITY, COMPLEXITY & INSTABILITY | G | THEME | |
| - - SOCIAL UNREST - INEQUALITY & A BROKEN SOCIAL CONTRACT | US | THEME | |
| - - ECHO BOOM - PERIPHERAL PROBLEM | M | THEME | |
| - -GLOBAL GROWTH & JOBS CRISIS | |||
| - - - PRODUCTIVITY PARADOX - NATURE OF WORK | THEME | MACRO w/ CHS |
|
| - - - STANDARD OF LIVING - EMPLOYMENT CRISIS, SUB-PRIME ECONOMY | US | THEME | MACRO w/ CHS |
III-FINANCIAL |
|||
| FLOWS -FRIDAY FLOWS | MATA RISK ON-OFF |
THEME |  |
| CRACKUP BOOM - ASSET BUBBLE | THEME | ||
| SHADOW BANKING - LIQUIDITY / CREDIT ENGINE | M | THEME | |
| GENERAL INTEREST |
|
||
| STRATEGIC INVESTMENT INSIGHTS - Weekend Coverage | |||
|
SII | ||
|
SII | ||
|
SII | ||
|
SII | ||
| TO TOP | |||


Read More - OUR RESEARCH - Articles Below

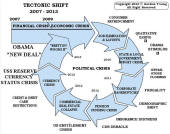
Tipping Points Life Cycle - Explained
Click on image to enlarge
TO TOP
 |
YOUR SOURCE FOR THE LATEST THINKING & RESEARCH
|
�
TO TOP