|
JOHN RUBINO'SLATEST BOOK |
||||||||||||||||||||||||||||||||||||||||||||||||||||||||||||||||||||||||||||||||||||||||||||||||||||||||||||||||||||||||||||||||||||||||||||||||||||||||||||||||||||||||||||||||||||||||||||||||||||||||||||||||||||||||||||||||||||||||||||||||||||||||||||
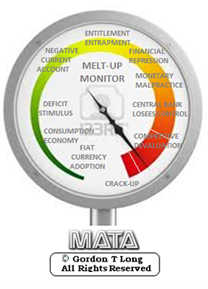
"MELT-UP MONITOR " Meltup Monitor: FLOWS - The Currency Cartel Carry Cycle - 09 Dec 2013 Meltup Monitor: FLOWS - Liquidity, Credit & Debt - 04 Dec 2013 Meltup Monitor: Euro Pressure Going Critical - 28- Nov 2013 Meltup Monitor: A Regression-to-the-Exponential Mean Required - 25 Nov 2013
|
"DOW 20,000 " Lance Roberts Charles Hugh Smith John Rubino Bert Dohman & Ty Andros
|
HELD OVER
Currency Wars
Euro Experiment
Sultans of Swap
Extend & Pretend
Preserve & Protect
Innovation
Showings Below
"Currency Wars "
|
"SULTANS OF SWAP" archives open ACT II ACT III ALSO Sultans of Swap: Fearing the Gearing! Sultans of Swap: BP Potentially More Devistating than Lehman! |
"EURO EXPERIMENT"
archives open EURO EXPERIMENT : ECB's LTRO Won't Stop Collateral Contagion!
EURO EXPERIMENT: |
"INNOVATION"
archives open |
"PRESERVE & PROTE CT"
archives open |

Wed Aug. 26th, 2015
Follow Our Updates
onTWITTER
https://twitter.com/GordonTLong
AND FOR EVEN MORE TWITTER COVERAGE
ANNUAL THESIS PAPERS
FREE (With Password)
THESIS 2010-Extended & Pretend
THESIS 2011-Currency Wars
THESIS 2012-Financial Repression
THESIS 2013-Statism
THESIS 2014-Globalization Trap
THESIS 2015-Fiduciary Failure
NEWS DEVELOPMENT UPDATES:
FINANCIAL REPRESSION
FIDUCIARY FAILURE
WHAT WE ARE RESEARCHING
2015 THEMES
SUB-PRIME ECONOMY
PENSION POVERITY
WAR ON CASH
ECHO BOOM
PRODUCTIVITY PARADOX
FLOWS - LIQUIDITY, CREDIT & DEBT
GLOBAL GOVERNANCE
- COMING NWO
WHAT WE ARE WATCHING
(A) Active, (C) Closed
MATA
Q3 '15- Chinese Market Crash
(A)
Q3 '15-
GMTP
Q3 '15- Greek Negotiations
(A)
Q3 '15- Puerto Rico Bond Default
MMC
OUR STRATEGIC INVESTMENT INSIGHTS (SII)

NEGATIVE-US RETAIL
NEGATIVE-ENERGY SECTOR
NEGATIVE-YEN
NEGATIVE-EURYEN
NEGATIVE-MONOLINES
POSITIVE-US DOLLAR
ARCHIVES
| AUGUST | ||||||
| S | M | T | W | T | F | S |
| 1 | ||||||
| 2 | 3 | 4 | 5 | 6 | 7 | 8 |
| 9 | 10 | 11 | 12 | 13 | 14 | 15 |
| 16 | 17 | 18 | 19 | 20 | 21 | 22 |
| 23 | 24 | 25 | 26 | 27 | 28 | 29 |
| 30 | 31 | |||||
KEY TO TIPPING POINTS |
| 1- Bond Bubble |
| 2 - Risk Reversal |
| 3 - Geo-Political Event |
| 4 - China Hard Landing |
| 5 - Japan Debt Deflation Spiral |
| 6- EU Banking Crisis |
| 7- Sovereign Debt Crisis |
| 8 - Shrinking Revenue Growth Rate |
| 9 - Chronic Unemployment |
| 10 - US Stock Market Valuations |
| 11 - Global Governance Failure |
| 12 - Chronic Global Fiscal ImBalances |
| 13 - Growing Social Unrest |
| 14 - Residential Real Estate - Phase II |
| 15 - Commercial Real Estate |
| 16 - Credit Contraction II |
| 17- State & Local Government |
| 18 - Slowing Retail & Consumer Sales |
| 19 - US Reserve Currency |
| 20 - US Dollar Weakness |
| 21 - Financial Crisis Programs Expiration |
| 22 - US Banking Crisis II |
| 23 - China - Japan Regional Conflict |
| 24 - Corruption |
| 25 - Public Sentiment & Confidence |
| 26 - Food Price Pressures |
| 27 - Global Output Gap |
| 28 - Pension - Entitlement Crisis |
| 29 - Central & Eastern Europe |
| 30 - Terrorist Event |
| 31 - Pandemic / Epidemic |
| 32 - Rising Inflation Pressures & Interest Pressures |
| 33 - Resource Shortage |
| 34 - Cyber Attack or Complexity Failure |
| 35 - Corporate Bankruptcies |
| 36 - Iran Nuclear Threat |
| 37- Finance & Insurance Balance Sheet Write-Offs |
| 38- Government Backstop Insurance |
| 39 - Oil Price Pressures |
| 40 - Natural Physical Disaster |
Reading the right books?
No Time?We have analyzed & included
these in our latest research papers Macro videos!
OUR MACRO ANALYTIC
CO-HOSTS
John Rubino's Just Released Book
Charles Hugh Smith's Latest Books
Our Macro Watch Partner
Richard Duncan Latest Books
MACRO ANALYTIC
GUESTS
F William Engdahl
OTHERS OF NOTE
TODAY'S TIPPING POINTS
|
Have your own site? Offer free content to your visitors with TRIGGER$ Public Edition!
Sell TRIGGER$ from your site and grow a monthly recurring income!
Contact [email protected] for more information - (free ad space for participating affiliates).
HOTTEST TIPPING POINTS |
Theme Groupings |
||
We post throughout the day as we do our Investment Research for: LONGWave - UnderTheLens - Macro
|
|||
|
MOST CRITICAL TIPPING POINT ARTICLES TODAY
|
|
||
| TECHNICAL STUDIES | |||
CLOSING THE DIVERGENCES Following the biggest (and only) market correction in years, the biggest weekly surge in the VIX ever, the second wholesale market flash crash in history coupled with the first ever limit down trade in the Nasdaq and the E-Mini, not to mention the biggest intraday bearish reversal since Lehman, it would appear that the "smart money" actually was aptly named.
|
08-26-15 | STUDIES | |
US MACRO
SMART MONEY
|
|||
Global Stocks Break Multi-Year Neckline
Via Credit Suisse, The MSCI World Developed index has seen its expected fall to pivotal price and "neckline" support at 1586/72. Below here would mark a medium-term top, and further weakness to 1400/1380.
S&P 500 September Contract The S&P 500 fall extended below 1886/82 for a move to our lower target of trendline support April 2014 at 1832, from which a sharp retracement higher is underway. Above 1950/52 is needed to suggest strength can extend back to the price gap from Monday morning at 1967/71, but we would look for this to then cap, for a fresh turn lower again. Support shows at 1900 initially, then 1887, with a break below 1868 needed for a retest of 1832/31. Below here can target the 1814/03 lows of April and October 2014, loss of which would mark a larger top for 1732/27 – the 38.2% retracement of the 2011/2015 rise. VIX has needs to hold 37.10/00 to suggest the immediate risk can stay higher for a retest of the 50% retracement of the entire 2008/14 fall at 49.90. Flat. Sell at 1950, stop above 1972, for a retest of 1832. Above 1972 can see the recovery extend back to 2002, then 2028. Russell 2000 The Russell has gapped lower again on the open this week, and removed our main target at 1138/34 – the late 2014 low and the 61.8% retracement of the rally from October. This sets a larger top and keeps the immediate risks down to the 78.6% retracement level next at 1095. We allow for a bounce here, but a direct break can throw open a move down to major support at 1040/32 ? the October 2014 low and the 38.2% retracement of the 2011/15 rise. Resistance moves to 1149 initially, then 1159, with 1173 ideally capping to keep the immediate trend still lower. Covered an existing short at 1138/34. Re-sell at 1148, stop above 1173, for 1040. Above 1173 can see a move back up to 1189 then 1194. Euro Stoxx 50 September Contract Another dramatic session for the Euro Stoxx as the sharp fall extends below medium-term channel support at 3102/00. The recovery from the 2951 spike low has been accompanied by a DeMark exhaustion signal, and we look for a recovery back to test gap resistance from Monday morning at 3208/32, also the 382% retracement of the fall from the 3688 August high. We look for this to then try to cap, for a fresh move lower. Support shows at 3060/53 initially, with a break below 3034 needed to reassert a bearish tone again for a move back to 2951, then 2918 – the late 2014 low. Above 3232 can ease the immediate bearish tone, for a deeper recovery back to 3280. Short took profit at 3065. Retry a short at 3200/10, stop above 3255. Also add below 3020. Take profit at 2920. Above 3255 should see strength extend back to 3280/3300. Retry a short here, stop above 3355. FTSE 100 September Contract The FTSE fall extended to a low of 5761, following which a sharp retracement higher has emerged. We look for strength to extend price gap and 38.2% retracement resistance at 6117/29, but we look for this to then try to cap, for a fresh move lower. Support shows at 5947 initially, below which should see a move back to 5856/55, then 5818. Below this latter level can see a move back to the 5761 recent low, ahead of 5695/94 – the 38.2% retracement of the entire 2009/2015 bull market. Above 6129 can see a deeper recovery back to 6184. Flat. Sell at 6110/30, stop above 6185. Take profit at 5700. Above 6185 can see strength back to 6250/60. Retry a short here, stop above 6275. Nikkei 225 A rollercoaster session for the Nikkei as it was unable to sustain its early strength, and the market has closed near the session’s low on increased volume, leaving the immediate spotlight on the 50% retracement of the rally from last October at 17740/30. Below here should see the immediate risk stay lower for 17420 at first, followed by the February low and the measured target from the top at 17335/270, where we would look for buying to show. A direct capitulation though can suggest further selling for the 61.8% retracement at 16970, ahead of 16595. Near-term resistance moves to 18175, followed by 18540. An extension higher can target 18835/970, above which is needed to ease the downside pressure. Short took profit at 19250. Sell again at 18600, stop above 19000, for 17350. Above 19000 can see a move higher for 19115/55. Shanghai Composite Shanghai Comp has gapped lower on the open, taking out a series of key supports at 3121/3049 respectively – the 61.8% retracement of the entire 2013/2015 bull trend and February low. This reinforces our bearish view for a further decline towards 2935 at first, ahead of the 78.6% retracement of the 2014/2015 bull trend and price support at 2666/60. Whilst we would allow for an initial hold here, bigger picture, we continue to favor an eventual breakdown towards 2562 next (the 78.6% retracement of the entire 2013/2015 uptrend), with our core target remaining at 2480/40, the top of the 2012/2014 base. Nearterm resistance shows at 3123, followed by 3192. Above is needed to target further gap resistance at 3388, which we look to ideally cap. Covered the short at 3050/49. Sell again at 3050/3100, stop above 3192, for 2670. Above 3192 can see a move higher for 3388. Retry a short here, stop above 3491.
|
|||
| MOST CRITICAL TIPPING POINT ARTICLES THIS WEEK - August 23rd, 2015 - August 29th, 2015 | |||
| BOND BUBBLE | 1 | ||
| RISK REVERSAL - WOULD BE MARKED BY: Slowing Momentum, Weakening Earnings, Falling Estimates | 2 | ||
| GEO-POLITICAL EVENT | 3 | ||
| CHINA BUBBLE | 4 | ||
| JAPAN - DEBT DEFLATION | 5 | ||
EU BANKING CRISIS |
6 |
||
"This Is Not A Correction .. It’s The Beginning Of The Global Bubble Unwind
DOUG NOLAN LINK HERE to the essay Doug Noland explains how contemporary international finance is a complex network of "faith-based networks" .. sees most the finance as being based on IOUs which depend on confidence, faith & trust .. "Over recent years too much of global finance has been underpinned – directly and indirectly – by concerted efforts of the world’s central bankers. Trillions of newly minted government finance have been validating tens of Trillions more of private-sector obligations and asset prices. Now, faith in the almighty power of central bank Credit and fiscal deficits, unquestioned for far too long, has begun to dim. The unfolding global crisis of confidence expanded and accelerated this week." EGON von GREYERZ LINK HERE to the commentary Egon von Greyerz explains the gravity of the current situation in the international financial system .. "Since the start of the Great Financial Crisis the bubble economy has now properly spread to the world’s second largest economy – China. China has had exponential growth in debt from $2 Trillion to $28 Trillion this century. A major part of this debt has financed 'white elephant' projects and ghost cities. It would be surprising if the total Chinese bad debts were below $10 trillion before all of this is finished .. The bubble contagion has also totally infected most emerging markets .. The Great Financial Crisis will now transcend into the Great Financial Catastrophe. This could very well involve a total reset or more likely a collapse of the world economy, financial system and world political system. And it won’t be orderly. It is likely to take a very long time and will involve bankruptcies of major parts of the financial system as well as many major nations. It will also lead to social unrest, escalation of wars, major poverty and famine with the world population going down significantly. [Cliff Note: WOW] CHARLES HUGH SMITH LINK HERE to the essay Charles Hugh Smith* ponders whether there are any factors which are better than the onset to the financial crisis ..
|
08-25-15 | RISK | 10 - US Stock Market Valuations |
US DOLLAR
|
|||
FINANCIAL REPRESSION SocGen: "Markets Have Lost Faith In Monetary Policies" Submitted by Tyler Durden on 08/23/2015 - 22:35 Submitted by Tyler Durden on 08/23/2015 - 22:35
"Clearly, markets have lost faith in the ability of unorthodox monetary policies to kick start the economy over time. This also fits the findings of academic literature suggestion diminishing returns from subsequent rounds of QE."
10Y Slides Back Under 2%, Precisely What Goldman Said Could Not Happen Submitted by Tyler Durden on 08/23/2015 - 22:37 Submitted by Tyler Durden on 08/23/2015 - 22:37
Remember trade #2 from Goldman's list of top trade recommendations for 2015, the one which said "10-year US Treasuries above 3% but not below 2% in mid-2015, through cap and floor spreads at zero cost." Um, yeah.... well, moments ago the 10Y just dropped below 2% for the first time since April. Global Trade In Freefall: Container Freight Rates From Asia To Europe Crash 60% In Three WeeksSubmitted by Tyler Durden on 08/23/2015 - 12:42Three weeks ago, "something just snapped." Now, it is getting worse by the day.
|
08-24-15 | 10 - US Stock Market Valuations | |
Posted:Sun, 23 Aug 2015 19:34This Wasn't Supposed To Happen: Crashing Inflation Expectations Suggest Imminent Launch Of QE4The wind up for the most telegraphed rate hike in history was supposed to achieve one thing: generate benign inflation in the form of a rising short end and a broadly steeper yield curve, or in short: boost inflation expectations without crashing the market (recall after 7 years of ZIRP and QE all the media is blasting is that "rate hikes are good for stocks") - after all why else would the Fed be hiking rates if not to offset the market's inflationary expectations and to have "dry policy powder" ahead of the next recession, even if said powder was a meager 25 basis points. It was most certainly not supposed to achieve this: This is how Nomura summarizes the chart above:
Here is a better way of summarizing it: the last three times inflation expectations tumbled this low, the Fed was about to launch QE1, QE2, Operation Twist and QE3. And the Fed is now expected to hike rates in less than a month even as inflation expectations are the lowest since Lehman? Good luck. The Fed - which is damned if it hikes rates (and crushes financial conditions by tightening, sending deflationary signals surging even higher and undoing 7 years of stock market levitation), and damned if it launches QE4 (as it loses all verbal jawboning credibility it worked so hard to establish in the past year ) - is now truly boxed in. |
|||
| TO TOP | |||
| MACRO News Items of Importance - This Week | |||
GLOBAL MACRO REPORTS & ANALYSIS |
|||
US ECONOMIC REPORTS & ANALYSIS |
|||
| CENTRAL BANKING MONETARY POLICIES, ACTIONS & ACTIVITIES | |||
| Market | |||
| TECHNICALS & MARKET |
|
||
| COMMODITY CORNER - AGRI-COMPLEX | PORTFOLIO | ||
| SECURITY-SURVEILANCE COMPLEX | PORTFOLIO | ||
| THESIS - Mondays Posts on Financial Repression & Posts on Thursday as Key Updates Occur | |||
| 2015 - FIDUCIARY FAILURE | 2015 | THESIS 2015 |  |
| 2014 - GLOBALIZATION TRAP | 2014 |  |
|
|
2013 2014 |
|||
2011 2012 2013 2014 |
|||
| THEMES - Normally a Thursday Themes Post & a Friday Flows Post | |||
I - POLITICAL |
|||
| CENTRAL PLANNING - SHIFTING ECONOMIC POWER - STATISM | THEME | ||
- - CORRUPTION & MALFEASANCE - MORAL DECAY - DESPERATION, SHORTAGES. |
THEME |  |
|
| - - SECURITY-SURVEILLANCE COMPLEX - STATISM | M | THEME | |
| - - CATALYSTS - FEAR (POLITICALLY) & GREED (FINANCIALLY) | G | THEME | |
II-ECONOMIC |
|||
| GLOBAL RISK | |||
| - GLOBAL FINANCIAL IMBALANCE - FRAGILITY, COMPLEXITY & INSTABILITY | G | THEME | |
| - - SOCIAL UNREST - INEQUALITY & A BROKEN SOCIAL CONTRACT | US | THEME | |
| - - ECHO BOOM - PERIPHERAL PROBLEM | M | THEME | |
| - -GLOBAL GROWTH & JOBS CRISIS | |||
| - - - PRODUCTIVITY PARADOX - NATURE OF WORK | THEME | MACRO w/ CHS |
|
| - - - STANDARD OF LIVING - EMPLOYMENT CRISIS, SUB-PRIME ECONOMY | US | THEME | MACRO w/ CHS |
III-FINANCIAL |
|||
| FLOWS -FRIDAY FLOWS | MATA RISK ON-OFF |
THEME | |
| CRACKUP BOOM - ASSET BUBBLE | THEME | ||
| SHADOW BANKING - LIQUIDITY / CREDIT ENGINE | M | THEME | |
| GENERAL INTEREST |
|
||
| STRATEGIC INVESTMENT INSIGHTS - Weekend Coverage | |||
|
SII | ||
|
SII | ||
|
SII | ||
|
SII | ||
| TO TOP | |||
Read More - OUR RESEARCH - Articles Below
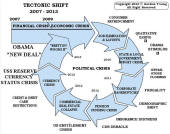
Tipping Points Life Cycle - Explained
Click on image to enlarge
TO TOP
�
TO TOP


