|
JOHN RUBINO'SLATEST BOOK |
|||||||||||||||||||||||||||||||||||||||||||||||||||||||||||||||||||||||||||||||||||||||||||||||||||||||||||||||||||||||||||||||||||||||||||||||||||||||||||||||||||||||||||||||||||||||||||||||||||||||||||||||||||||||||||||||||||||||||||||||||||||||||||||||||||||||||||||||||||||||||||||||||||||||||
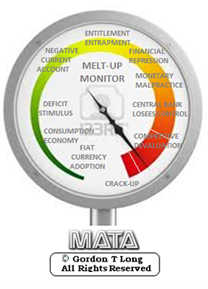
"MELT-UP MONITOR "
Meltup Monitor: FLOWS - The Currency Cartel Carry Cycle - 09 Dec 2013 Meltup Monitor: FLOWS - Liquidity, Credit & Debt - 04 Dec 2013 Meltup Monitor: Euro Pressure Going Critical - 28- Nov 2013 Meltup Monitor: A Regression-to-the-Exponential Mean Required - 25 Nov 2013
|

![]()
"DOW 20,000 "
Lance Roberts Charles Hugh Smith John Rubino Bert Dohman & Ty Andros
|

HELD OVER
Currency Wars
Euro Experiment
Sultans of Swap
Extend & Pretend
Preserve & Protect
Innovation
Showings Below
"Currency Wars "
|


"SULTANS OF SWAP" archives open ACT II ACT III
ALSO Sultans of Swap: Fearing the Gearing! Sultans of Swap: BP Potentially More Devistating than Lehman! |

"EURO EXPERIMENT"
archives open EURO EXPERIMENT : ECB's LTRO Won't Stop Collateral Contagion!
EURO EXPERIMENT: |

![]()
"INNOVATION"
archives open |

"PRESERVE & PROTE CT"
archives open |

Weekend Aug. 29th, 2015
Follow Our Updates
onTWITTER
https://twitter.com/GordonTLong
AND FOR EVEN MORE TWITTER COVERAGE
ANNUAL THESIS PAPERS
FREE (With Password)
THESIS 2010-Extended & Pretend
THESIS 2011-Currency Wars
THESIS 2012-Financial Repression
THESIS 2013-Statism
THESIS 2014-Globalization Trap
THESIS 2015-Fiduciary Failure
NEWS DEVELOPMENT UPDATES:
FINANCIAL REPRESSION
FIDUCIARY FAILURE
WHAT WE ARE RESEARCHING
2015 THEMES
SUB-PRIME ECONOMY
PENSION POVERITY
WAR ON CASH
ECHO BOOM
PRODUCTIVITY PARADOX
FLOWS - LIQUIDITY, CREDIT & DEBT
GLOBAL GOVERNANCE
- COMING NWO
WHAT WE ARE WATCHING
(A) Active, (C) Closed
MATA
Q3 '15- Chinese Market Crash
(A)
Q3 '15-
GMTP
Q3 '15- Greek Negotiations
(A)
Q3 '15- Puerto Rico Bond Default
MMC
OUR STRATEGIC INVESTMENT INSIGHTS (SII)

NEGATIVE-US RETAIL
NEGATIVE-ENERGY SECTOR
NEGATIVE-YEN
NEGATIVE-EURYEN
NEGATIVE-MONOLINES
POSITIVE-US DOLLAR
ARCHIVES
| AUGUST | ||||||
| S | M | T | W | T | F | S |
| 1 | ||||||
| 2 | 3 | 4 | 5 | 6 | 7 | 8 |
| 9 | 10 | 11 | 12 | 13 | 14 | 15 |
| 16 | 17 | 18 | 19 | 20 | 21 | 22 |
| 23 | 24 | 25 | 26 | 27 | 28 | 29 |
| 30 | 31 | |||||
KEY TO TIPPING POINTS |
| 1- Bond Bubble |
| 2 - Risk Reversal |
| 3 - Geo-Political Event |
| 4 - China Hard Landing |
| 5 - Japan Debt Deflation Spiral |
| 6- EU Banking Crisis |
| 7- Sovereign Debt Crisis |
| 8 - Shrinking Revenue Growth Rate |
| 9 - Chronic Unemployment |
| 10 - US Stock Market Valuations |
| 11 - Global Governance Failure |
| 12 - Chronic Global Fiscal ImBalances |
| 13 - Growing Social Unrest |
| 14 - Residential Real Estate - Phase II |
| 15 - Commercial Real Estate |
| 16 - Credit Contraction II |
| 17- State & Local Government |
| 18 - Slowing Retail & Consumer Sales |
| 19 - US Reserve Currency |
| 20 - US Dollar Weakness |
| 21 - Financial Crisis Programs Expiration |
| 22 - US Banking Crisis II |
| 23 - China - Japan Regional Conflict |
| 24 - Corruption |
| 25 - Public Sentiment & Confidence |
| 26 - Food Price Pressures |
| 27 - Global Output Gap |
| 28 - Pension - Entitlement Crisis |
| 29 - Central & Eastern Europe |
| 30 - Terrorist Event |
| 31 - Pandemic / Epidemic |
| 32 - Rising Inflation Pressures & Interest Pressures |
| 33 - Resource Shortage |
| 34 - Cyber Attack or Complexity Failure |
| 35 - Corporate Bankruptcies |
| 36 - Iran Nuclear Threat |
| 37- Finance & Insurance Balance Sheet Write-Offs |
| 38- Government Backstop Insurance |
| 39 - Oil Price Pressures |
| 40 - Natural Physical Disaster |
Reading the right books?
No Time?
We have analyzed & included
these in our latest research papers Macro videos!
OUR MACRO ANALYTIC
CO-HOSTS
John Rubino's Just Released Book
Charles Hugh Smith's Latest Books


Our Macro Watch Partner
Richard Duncan Latest Books
MACRO ANALYTIC
GUESTS
F William Engdahl


OTHERS OF NOTE
Book Review- Five Thumbs Up
for Steve Greenhut's Plunder!


![]()
TODAY'S TIPPING POINTS
|
Have your own site? Offer free content to your visitors with TRIGGER$ Public Edition!
Sell TRIGGER$ from your site and grow a monthly recurring income!
Contact [email protected] for more information - (free ad space for participating affiliates).
HOTTEST TIPPING POINTS |
Theme Groupings |
|||||
We post throughout the day as we do our Investment Research for: LONGWave - UnderTheLens - Macro
|
||||||
|
MOST CRITICAL TIPPING POINT ARTICLES TODAY
|
|
|||||
|
||||||
| 08-29-15 | SII | |||||
Submitted by Tyler Durden on 08/21/2015
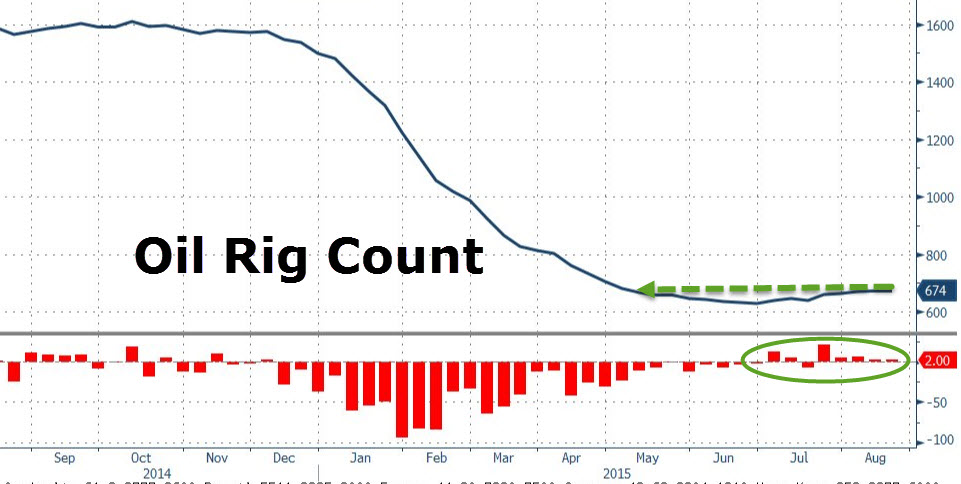
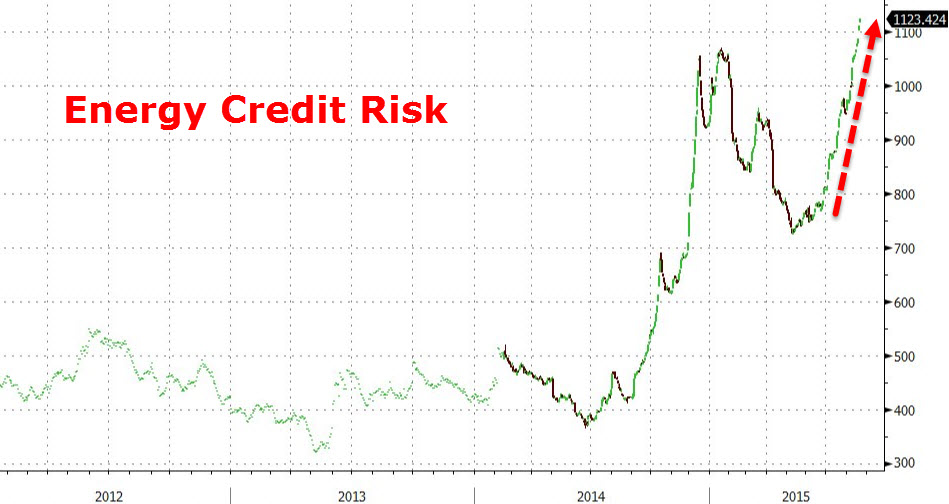
WTI Crude Breaks Below Historic $40 Level, Energy Credit Spikes To Record Highs After Rig Count RiseWell, we have a winner - Oil broke to a 3 handle before 10Y rates hit a 1 handle (just - 10Y at 2.04%) following the 5th weekly rise in rig count (+2 to 674). Energy credit risk is soaring to record highs as investors realize 'there will be blood' in all those highly-levered loans. This is the first time the front-month crude contract traded below $40 since March 3rd 2009... just before QE was unleashed in all its asset-inflating, malinvestment-driving, zombifying glory. This didn't help:
And then the rig count data hit.
WTI Crude breaks below $40....
and Energy credit risk is exploding..
Trade accordingly... Charts: Bloomberg
| ||||||
Low Oil Prices Could Break The "Fragile Five" Producing NationsPersistently low oil prices have already inflicted economic pain on oil-producing countries. But with crude sticking near six-year lows, the risk of political turmoil is starting to rise. There are several countries in which the risks are the greatest – Algeria, Iraq, Libya, Nigeria, and Venezuela – and RBC Capital Markets has labeled them the “Fragile Five.” Iraq, facing instability from the ongoing fight with ISIS, has seen its problems compounded by the fall in oil prices, causing its budget to shrink significantly. The government is moving to tap the bond markets for the first time in years, looking to issue $6 billion in new debt. Revenues have been bolstered somewhat by continued gains in production. Iraq’s oil output hit a record high in July at 4.18 million barrels per day, up sharply from an average of 3.42 million barrels per day in the first quarter of this year. But with Brent crude now dropping well below $50 per barrel, Iraq’s finances are worsening. According to Fitch Ratings, Iraq may post a fiscal deficit in excess of 10 percent this year, and all the savings accrued during the years of high oil prices have been depleted. Other political problems loom for Iraq. The central government and the semiautonomous region of Kurdistan have been unable to resolve a dispute over oil sales. With revenues running low for the central government, it has failed to transfer adequate funds to the Kurdish Regional Government (KRG). That led to the breakdown of a tenuous deal between the two sides that saw Kurdish oil sold under the purview of the Iraqi government. The KRG is selling oil on its own now in an effort to obtain much needed revenue in order to pay private oil companies operating in its territory. Meanwhile, in southern Iraq, which produces the bulk of the country’s oil and has been far from the violence associated with ISIS, protests have threatened oil operations there. Protests at the West Qurna-2 oilfield operated by Russian firm Lukoil have raised concerns within both the company and the Iraqi central government about disruptions. The Prime Minister even traveled to the site to reassure Lukoil about the stability of its operations. “Recent pressure from villagers and nearby residents making demands could force us to consider halting operations if they keep extorting us,” a Lukoil official reportedly said. Disruptions don’t appear to be imminent, but any cutback in production would be a huge blow to Baghdad and would plunge Iraq deeper into financial despair. Low oil prices could also push Venezuela into a deeper crisis. The cost of insuring Venezuelan government bonds has hit its highest level in 12 years, indicating the growing probability of default. Critical parliamentary elections loom in December, but the government has already cracked down on opposition candidates and will likely prevent a fair election from taking place, even while President Maduro’s popularity sinks. The economy is already in crisis, but it is teetering on the brink of something more acute. Bloomberg’s editors openly wonder whether Venezuela’s neighbors are prepared for its collapse. For Libya, already torn apart by civil war and the growing presence of ISIS militants, low oil prices are the last thing the country needs. ISIS violently crushed a civilian rebellion last week in the coastal city of Sirte, according to Al-Jazeera. Libya’s internationally-recognized government has called upon Arab states for help in fighting ISIS, something that the Arab League has endorsed. Meanwhile, the country’s oil sector – the backbone of the economy – is producing less than 400,000 barrels per day, well below the 1.6 million barrels per day Libya produced during the Gaddafi era. In other words, Libya is selling far less oil than it used to, and at prices far below what they were as recently as last year. Citing IMF data, Bloomberg says that oil is selling for almost $160 per barrel less than what Libya would need it to be for its budget to breakeven. Saudi Arabia does not belong in the same category of troubled countries, but it is also not immune to oil prices at multiyear lows, despite its vast reserves of foreign exchange. Saudi Arabia could run a fiscal deficit that is equivalent to about 20 percent of GDP. To finance public spending, Saudi Arabia has returned to the bond markets for the first time in eight years, issuing 15 billion riyals ($4 billion) in July, only to be followed up by an additional bond offering of 20 billion riyals ($5.33 billion) in August. The government plans on taking on more debt in the coming months as well. Still, Saudi Arabia has a market share strategy that it is pursuing, and there are no signs that it will reconsider. That could spell trouble for much more fragile oil-producing countries around the world. |
||||||
| MOST CRITICAL TIPPING POINT ARTICLES THIS WEEK - August 23rd, 2015 - August 29th, 2015 | ||||||
| BOND BUBBLE | 1 | |||||
| RISK REVERSAL - WOULD BE MARKED BY: Slowing Momentum, Weakening Earnings, Falling Estimates | 2 | |||||
| GEO-POLITICAL EVENT | 3 | |||||
| CHINA BUBBLE | 4 | |||||
CHINA - Dumping Treasuries China Has Dumped $100 Billion in U.S. Treasury Bonds in 2 Weeks Article with references by SocGen suggests China has been selling U.S. Treasury bonds .. is more coming? .. SocGen: From an operational perspective, China's FX reserves are estimated to be two-thirds made up of relatively liquid assets. According to TIC data, China held $1,271bn U.S. treasuries end-June 2015, but treasury bills and notes accounted for only $3.1bn. The currency composition is said to be similar to the IMF's COFER data: 2/3 USD, 1/5 EUR and 5% each of GBP and JPY. Given that EUR and JPY depreciation contributed the most to the RMB's NEER appreciation in the past year, it is plausible that the PBoC may not limit its intervention to selling only USD-denominated assets." .. Zero Hedge projects China could continue this pace of selling for 18 months - "What happens when China liquidates all of its Treasury holdings is anyone's guess, and an even better question is will anyone else decide to join China as its sells U.S. Treasurys at a never before seen pace, and best of all: will the Fed just sit there and watch as the biggest offshore holder of U.S. Treasurys liquidates its entire inventory." |
08-27-15 | THEMES | 4 - China Hard Landing | |||
| Posted by Cliff Küle at 8/26/2015 12:37:00 PM | ||||||
Devaluation Stunner: China Has Dumped $100 Billion In Treasurys In The Past Two WeekOn August 11, China devalued its currency, and in the subsequent 3 days the onshore Yuan, the CNY, tumbled by some 4% against the dollar. Then, as if by magic, the CNY stabilized when China started intervening massively, only this time not through the fixing, but in the actual FX market. This means that while China has previously been dumping reserves as a matter of FX policy, after August 11 it was intervening directly in the FX market, with the intervention said to really pick up after the FOMC Minutes on August 19, the same day the market finally topped out, and has tumbled into a correction since then. The result was the same: massive FX reserve liquidations to defend the currency one way or the other. And yet something curious emerges when comparing the traditionally tight, and inverse, relationship between the S&P and the Treausry long-end: the drop in yields has not been anywhere near as profound as the tumble in stocks. In fact, the 30 Year is wider now than where it was the day China announced the Yuan devaluation.
Why is that? We hinted at the answer on two occasions earlier (here and here) and yet the point is so critical, and was missed by virtually all readers, that it deserves to be repeated once again: as part of China's devaluation and subsequent attempts to contain said devaluation, it has been purging foreign reserves at an epic pace. Said otherwise, China has sold an epic amount of Treasurys in the past two weeks. How epic? We turn it over to SocGen once again:
There you have it: in the past two weeks alone China has sold a gargantuan $106 (or more) billion in US paper just as a result of the change in the currency regime! But wait, there's more: recall that one months ago we posted that "China's Record Dumping Of US Treasuries Leaves Goldman Speechless" in which we reported that China has sold some $107 billion in Treasurys since the start of 2015. When we did that article, we too were quite shocked at that number. However, we - just like Goldman - are absolutely speechless to find out that China has sold as much in Treasurys in the past 2 weeks, over $100 billion, as it has sold in the entire first half of the year! In retrospect, it is absolutely amazing that the 10 and 30 Year Bonds have cratered considering the amount of concentrated selling by China. But the bigger question is how much more does China have left to sell, if this pace of outflows continues. Here is SocGen again:
Should the current pace of liquidity outflows continue, and require the dumping of $100 billion in FX reserves, read US Treasurys, every two weeks this means China has, oh, call it some 18 weeks of intervention left. What happens when China liquidates all of its Treasury holdings is anyone's guess, and an even better question is will anyone else decide to join China as its sells US Treasurys at a never before seen pace, and best of all: will the Fed just sit there and watch as the biggest offshore holder of US Treasurys liquidates its entire inventory...
|
||||||
| JAPAN - DEBT DEFLATION | 5 | |||||
EU BANKING CRISIS |
6 |
|||||
"This Is Not A Correction .. It’s The Beginning Of The Global Bubble Unwind
DOUG NOLAN LINK HERE to the essay Doug Noland explains how contemporary international finance is a complex network of "faith-based networks" .. sees most the finance as being based on IOUs which depend on confidence, faith & trust .. "Over recent years too much of global finance has been underpinned – directly and indirectly – by concerted efforts of the world’s central bankers. Trillions of newly minted government finance have been validating tens of Trillions more of private-sector obligations and asset prices. Now, faith in the almighty power of central bank Credit and fiscal deficits, unquestioned for far too long, has begun to dim. The unfolding global crisis of confidence expanded and accelerated this week." EGON von GREYERZ LINK HERE to the commentary Egon von Greyerz explains the gravity of the current situation in the international financial system .. "Since the start of the Great Financial Crisis the bubble economy has now properly spread to the world’s second largest economy – China. China has had exponential growth in debt from $2 Trillion to $28 Trillion this century. A major part of this debt has financed 'white elephant' projects and ghost cities. It would be surprising if the total Chinese bad debts were below $10 trillion before all of this is finished .. The bubble contagion has also totally infected most emerging markets .. The Great Financial Crisis will now transcend into the Great Financial Catastrophe. This could very well involve a total reset or more likely a collapse of the world economy, financial system and world political system. And it won’t be orderly. It is likely to take a very long time and will involve bankruptcies of major parts of the financial system as well as many major nations. It will also lead to social unrest, escalation of wars, major poverty and famine with the world population going down significantly. [Cliff Note: WOW] CHARLES HUGH SMITH LINK HERE to the essay Charles Hugh Smith* ponders whether there are any factors which are better than the onset to the financial crisis ..
|
08-25-15 | RISK | 10 - US Stock Market Valuations | |||
US DOLLAR
|
||||||
FINANCIAL REPRESSION SocGen: "Markets Have Lost Faith In Monetary Policies" Submitted by Tyler Durden on 08/23/2015 - 22:35 Submitted by Tyler Durden on 08/23/2015 - 22:35
"Clearly, markets have lost faith in the ability of unorthodox monetary policies to kick start the economy over time. This also fits the findings of academic literature suggestion diminishing returns from subsequent rounds of QE."
10Y Slides Back Under 2%, Precisely What Goldman Said Could Not Happen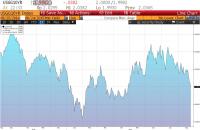 Submitted by Tyler Durden on 08/23/2015 - 22:37 Submitted by Tyler Durden on 08/23/2015 - 22:37
Remember trade #2 from Goldman's list of top trade recommendations for 2015, the one which said "10-year US Treasuries above 3% but not below 2% in mid-2015, through cap and floor spreads at zero cost." Um, yeah.... well, moments ago the 10Y just dropped below 2% for the first time since April. Global Trade In Freefall: Container Freight Rates From Asia To Europe Crash 60% In Three WeeksSubmitted by Tyler Durden on 08/23/2015 - 12:42Three weeks ago, "something just snapped." Now, it is getting worse by the day.
|
08-24-15 | 10 - US Stock Market Valuations | ||||
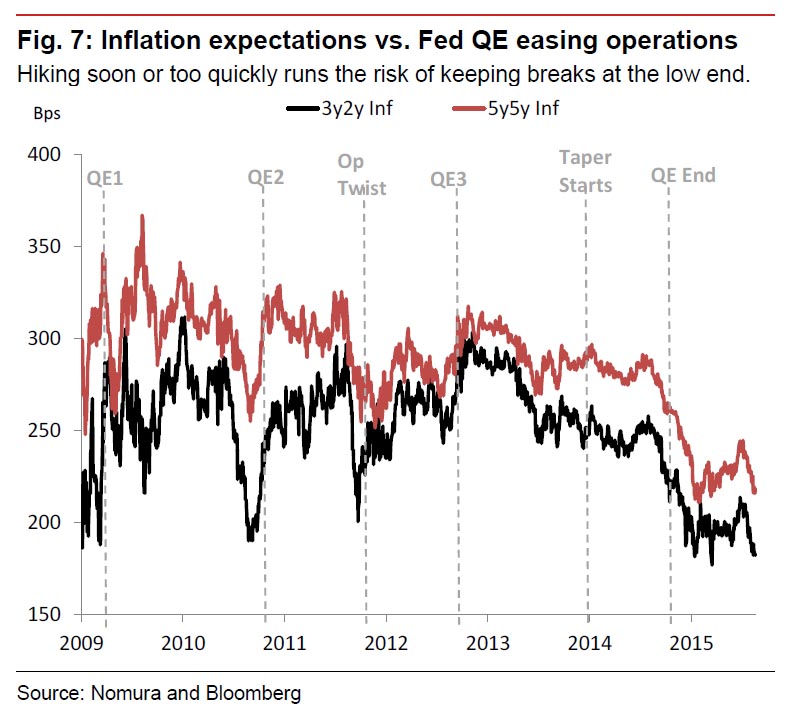
Posted:Sun, 23 Aug 2015 19:34This Wasn't Supposed To Happen: Crashing Inflation Expectations Suggest Imminent Launch Of QE4The wind up for the most telegraphed rate hike in history was supposed to achieve one thing: generate benign inflation in the form of a rising short end and a broadly steeper yield curve, or in short: boost inflation expectations without crashing the market (recall after 7 years of ZIRP and QE all the media is blasting is that "rate hikes are good for stocks") - after all why else would the Fed be hiking rates if not to offset the market's inflationary expectations and to have "dry policy powder" ahead of the next recession, even if said powder was a meager 25 basis points. It was most certainly not supposed to achieve this:
This is how Nomura summarizes the chart above:
Here is a better way of summarizing it: the last three times inflation expectations tumbled this low, the Fed was about to launch QE1, QE2, Operation Twist and QE3. And the Fed is now expected to hike rates in less than a month even as inflation expectations are the lowest since Lehman? Good luck. The Fed - which is damned if it hikes rates (and crushes financial conditions by tightening, sending deflationary signals surging even higher and undoing 7 years of stock market levitation), and damned if it launches QE4 (as it loses all verbal jawboning credibility it worked so hard to establish in the past year ) - is now truly boxed in. |
||||||
| TO TOP | ||||||
| MACRO News Items of Importance - This Week | ||||||
GLOBAL MACRO REPORTS & ANALYSIS |
||||||
US ECONOMIC REPORTS & ANALYSIS |
||||||
| CENTRAL BANKING MONETARY POLICIES, ACTIONS & ACTIVITIES | ||||||
| Market | ||||||
| TECHNICALS & MARKET |
|
|||||
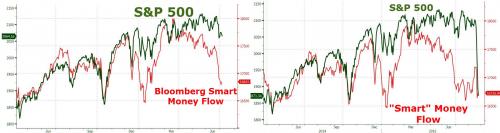
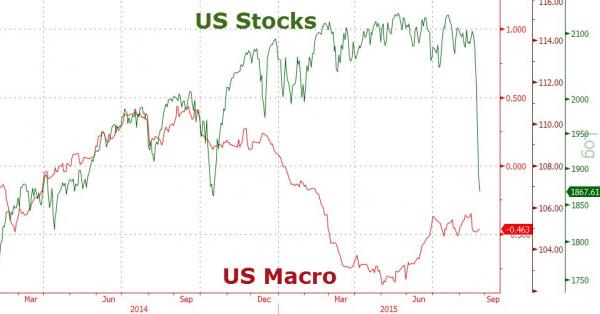
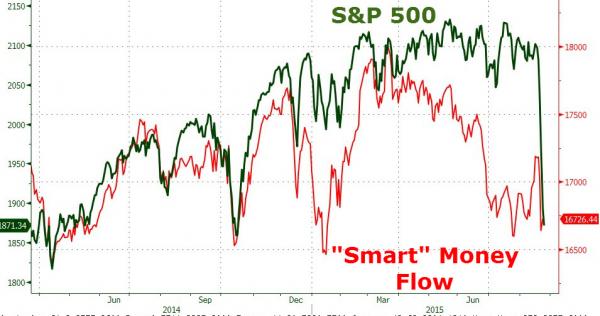
CLOSING THE DIVERGENCES Following the biggest (and only) market correction in years, the biggest weekly surge in the VIX ever, the second wholesale market flash crash in history coupled with the first ever limit down trade in the Nasdaq and the E-Mini, not to mention the biggest intraday bearish reversal since Lehman, it would appear that the "smart money" actually was aptly named.
|
08-26-15 | STUDIES | ||||
US MACRO
SMART MONEY
|
||||||
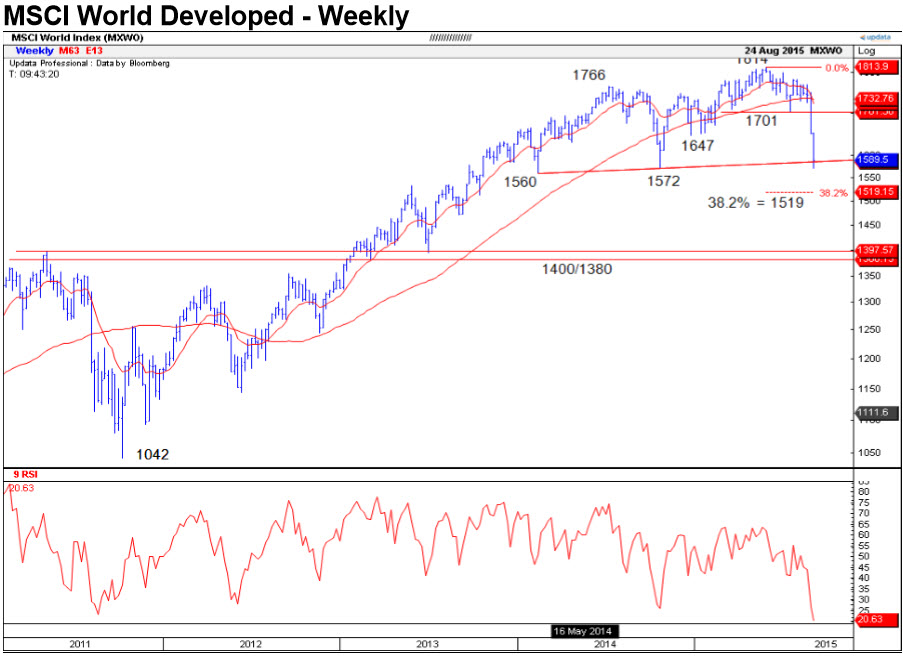
Global Stocks Break Multi-Year Neckline
Via Credit Suisse, The MSCI World Developed index has seen its expected fall to pivotal price and "neckline" support at 1586/72. Below here would mark a medium-term top, and further weakness to 1400/1380.
S&P 500 September Contract
The S&P 500 fall extended below 1886/82 for a move to our lower target of trendline support April 2014 at 1832, from which a sharp retracement higher is underway. Above 1950/52 is needed to suggest strength can extend back to the price gap from Monday morning at 1967/71, but we would look for this to then cap, for a fresh turn lower again. Support shows at 1900 initially, then 1887, with a break below 1868 needed for a retest of 1832/31. Below here can target the 1814/03 lows of April and October 2014, loss of which would mark a larger top for 1732/27 – the 38.2% retracement of the 2011/2015 rise. VIX has needs to hold 37.10/00 to suggest the immediate risk can stay higher for a retest of the 50% retracement of the entire 2008/14 fall at 49.90. Flat. Sell at 1950, stop above 1972, for a retest of 1832. Above 1972 can see the recovery extend back to 2002, then 2028. Russell 2000
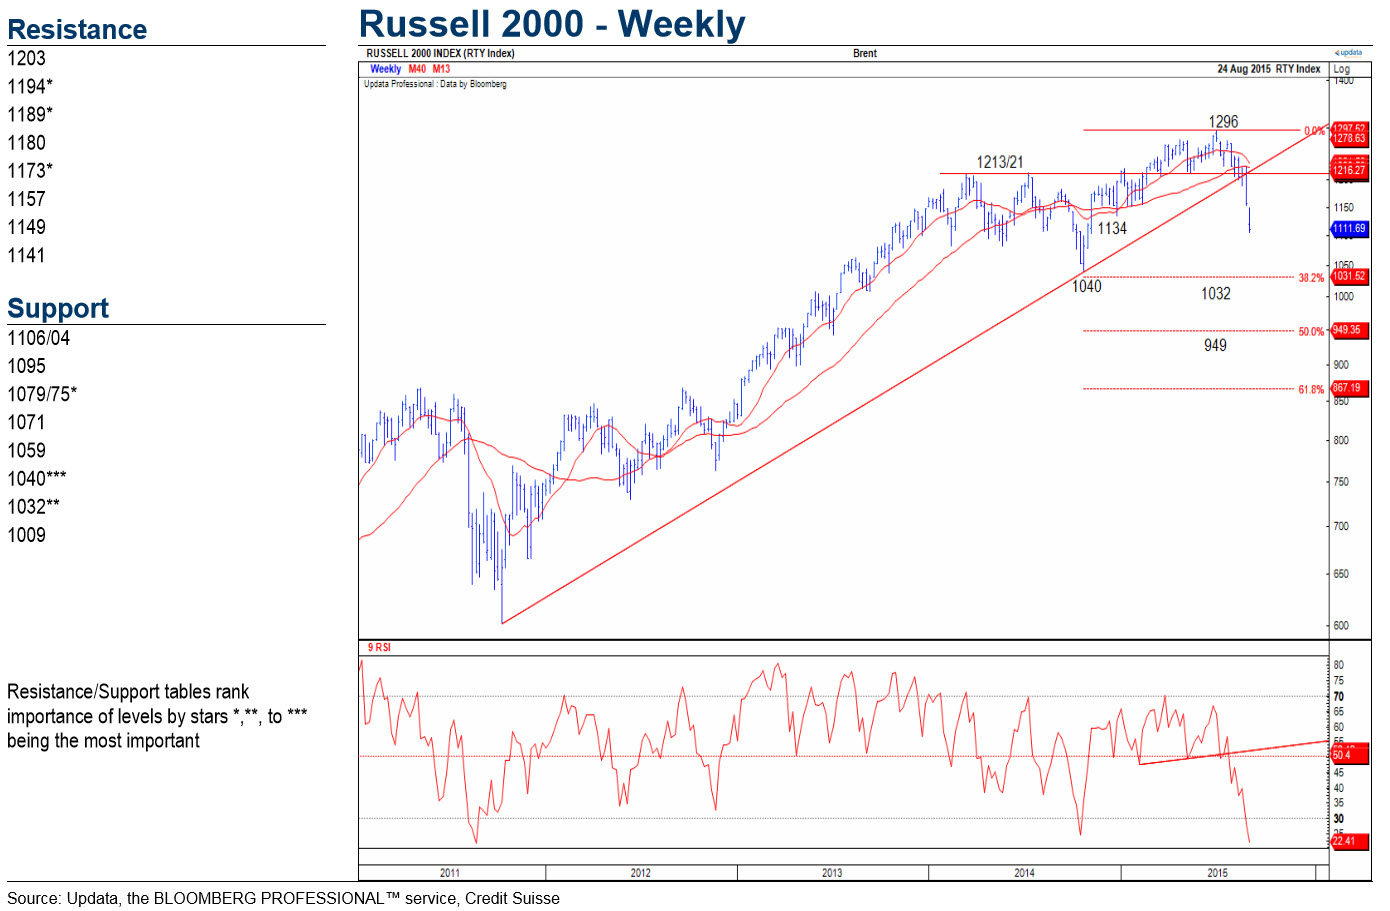
The Russell has gapped lower again on the open this week, and removed our main target at 1138/34 – the late 2014 low and the 61.8% retracement of the rally from October. This sets a larger top and keeps the immediate risks down to the 78.6% retracement level next at 1095. We allow for a bounce here, but a direct break can throw open a move down to major support at 1040/32 ? the October 2014 low and the 38.2% retracement of the 2011/15 rise. Resistance moves to 1149 initially, then 1159, with 1173 ideally capping to keep the immediate trend still lower. Covered an existing short at 1138/34. Re-sell at 1148, stop above 1173, for 1040. Above 1173 can see a move back up to 1189 then 1194. Euro Stoxx 50 September Contract
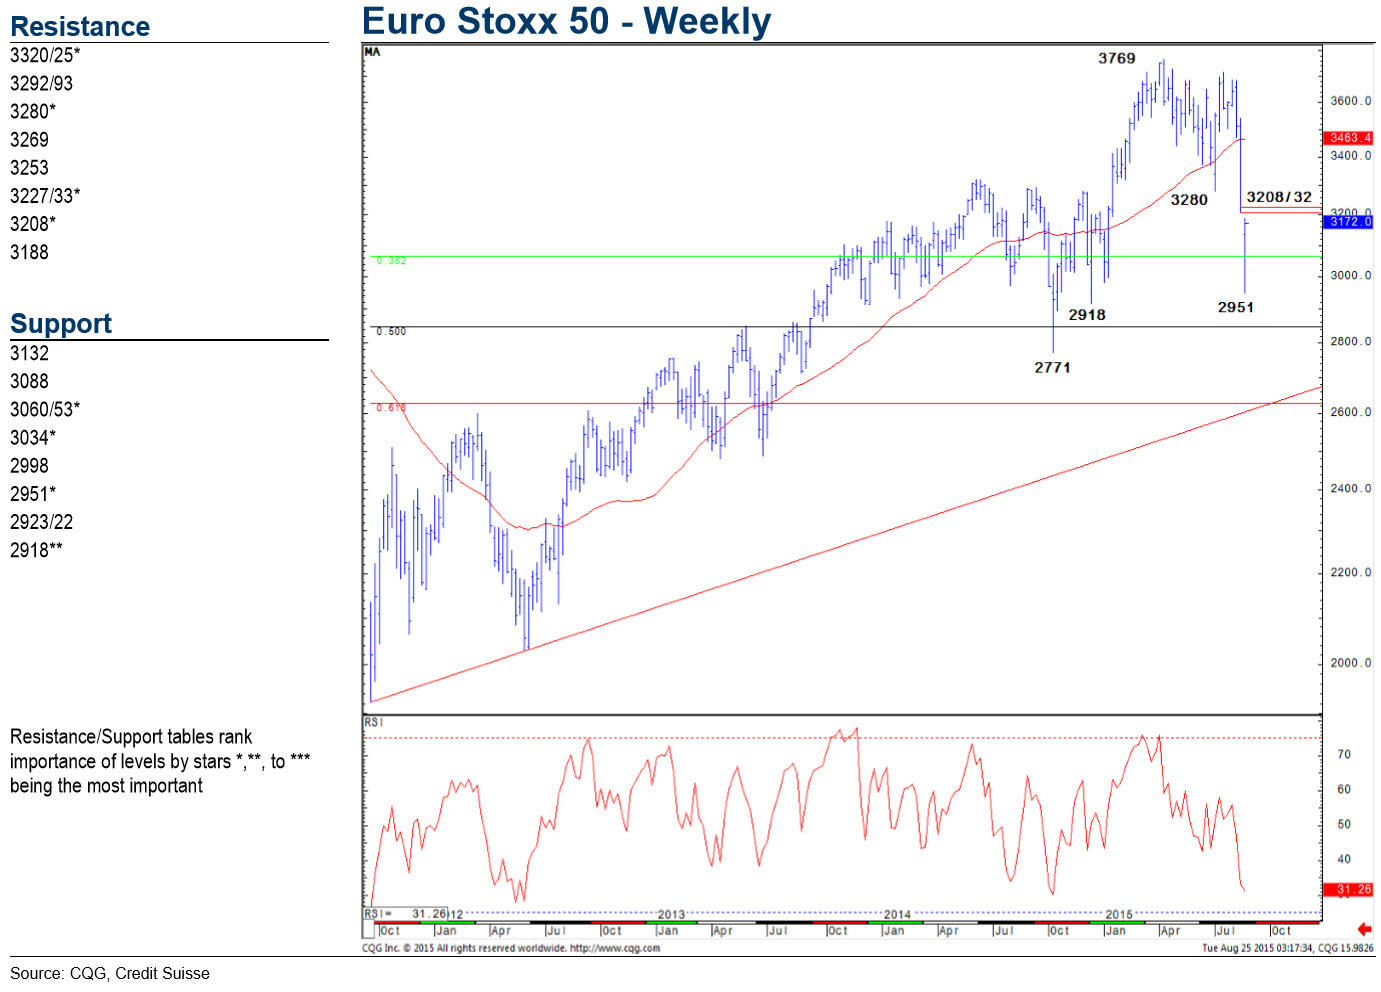
Another dramatic session for the Euro Stoxx as the sharp fall extends below medium-term channel support at 3102/00. The recovery from the 2951 spike low has been accompanied by a DeMark exhaustion signal, and we look for a recovery back to test gap resistance from Monday morning at 3208/32, also the 382% retracement of the fall from the 3688 August high. We look for this to then try to cap, for a fresh move lower. Support shows at 3060/53 initially, with a break below 3034 needed to reassert a bearish tone again for a move back to 2951, then 2918 – the late 2014 low. Above 3232 can ease the immediate bearish tone, for a deeper recovery back to 3280. Short took profit at 3065. Retry a short at 3200/10, stop above 3255. Also add below 3020. Take profit at 2920. Above 3255 should see strength extend back to 3280/3300. Retry a short here, stop above 3355. FTSE 100 September Contract
The FTSE fall extended to a low of 5761, following which a sharp retracement higher has emerged. We look for strength to extend price gap and 38.2% retracement resistance at 6117/29, but we look for this to then try to cap, for a fresh move lower. Support shows at 5947 initially, below which should see a move back to 5856/55, then 5818. Below this latter level can see a move back to the 5761 recent low, ahead of 5695/94 – the 38.2% retracement of the entire 2009/2015 bull market. Above 6129 can see a deeper recovery back to 6184. Flat. Sell at 6110/30, stop above 6185. Take profit at 5700. Above 6185 can see strength back to 6250/60. Retry a short here, stop above 6275. Nikkei 225
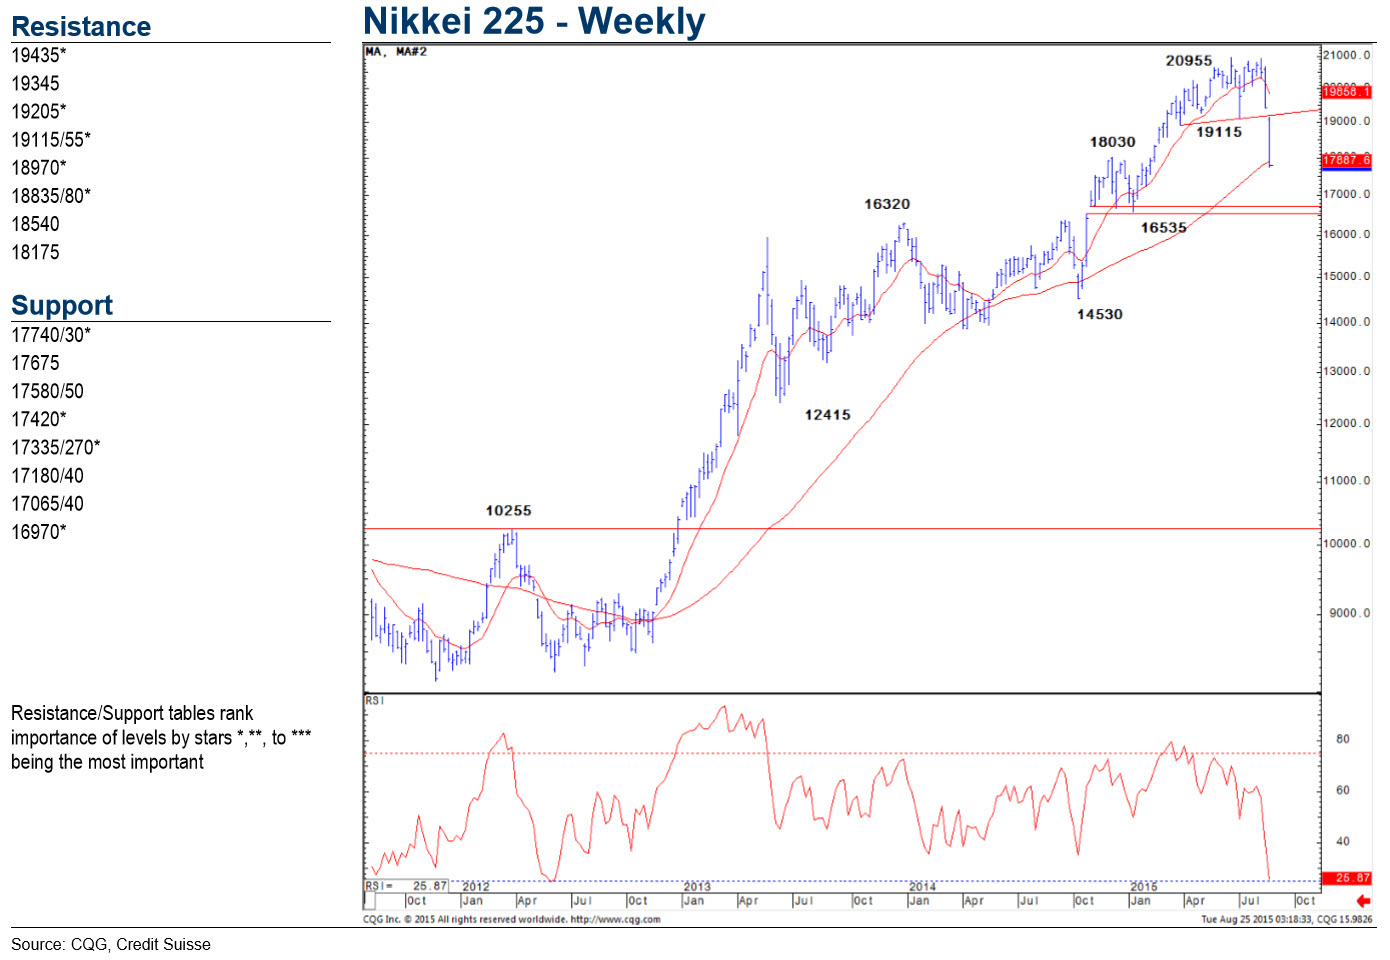
A rollercoaster session for the Nikkei as it was unable to sustain its early strength, and the market has closed near the session’s low on increased volume, leaving the immediate spotlight on the 50% retracement of the rally from last October at 17740/30. Below here should see the immediate risk stay lower for 17420 at first, followed by the February low and the measured target from the top at 17335/270, where we would look for buying to show. A direct capitulation though can suggest further selling for the 61.8% retracement at 16970, ahead of 16595. Near-term resistance moves to 18175, followed by 18540. An extension higher can target 18835/970, above which is needed to ease the downside pressure. Short took profit at 19250. Sell again at 18600, stop above 19000, for 17350. Above 19000 can see a move higher for 19115/55. Shanghai Composite
Shanghai Comp has gapped lower on the open, taking out a series of key supports at 3121/3049 respectively – the 61.8% retracement of the entire 2013/2015 bull trend and February low. This reinforces our bearish view for a further decline towards 2935 at first, ahead of the 78.6% retracement of the 2014/2015 bull trend and price support at 2666/60. Whilst we would allow for an initial hold here, bigger picture, we continue to favor an eventual breakdown towards 2562 next (the 78.6% retracement of the entire 2013/2015 uptrend), with our core target remaining at 2480/40, the top of the 2012/2014 base. Nearterm resistance shows at 3123, followed by 3192. Above is needed to target further gap resistance at 3388, which we look to ideally cap. Covered the short at 3050/49. Sell again at 3050/3100, stop above 3192, for 2670. Above 3192 can see a move higher for 3388. Retry a short here, stop above 3491.
|
||||||
| COMMODITY CORNER - AGRI-COMPLEX | PORTFOLIO | |||||
| SECURITY-SURVEILANCE COMPLEX | PORTFOLIO | |||||
| THESIS - Mondays Posts on Financial Repression & Posts on Thursday as Key Updates Occur | ||||||
| 2015 - FIDUCIARY FAILURE | 2015 | THESIS 2015 |  |
|||
| 2014 - GLOBALIZATION TRAP | 2014 |  |
||||
 |
||||||
|
2013 2014 |
 |
|||||
2011 2012 2013 2014 |
 |
|||||
| THEMES - Normally a Thursday Themes Post & a Friday Flows Post | ||||||
I - POLITICAL |
||||||
| CENTRAL PLANNING - SHIFTING ECONOMIC POWER - STATISM | THEME | |||||
- - CORRUPTION & MALFEASANCE - MORAL DECAY - DESPERATION, SHORTAGES. |
THEME |  |
||||
| - - SECURITY-SURVEILLANCE COMPLEX - STATISM | M | THEME | ||||
| - - CATALYSTS - FEAR (POLITICALLY) & GREED (FINANCIALLY) | G | THEME | ||||
II-ECONOMIC |
||||||
| GLOBAL RISK | ||||||
| - GLOBAL FINANCIAL IMBALANCE - FRAGILITY, COMPLEXITY & INSTABILITY | G | THEME | ||||
| - - SOCIAL UNREST - INEQUALITY & A BROKEN SOCIAL CONTRACT | US | THEME | ||||
| - - ECHO BOOM - PERIPHERAL PROBLEM | M | THEME | ||||
| - -GLOBAL GROWTH & JOBS CRISIS | ||||||
| - - - PRODUCTIVITY PARADOX - NATURE OF WORK | THEME | MACRO w/ CHS |
||||
| - - - STANDARD OF LIVING - EMPLOYMENT CRISIS, SUB-PRIME ECONOMY | US | THEME | MACRO w/ CHS |
|||
III-FINANCIAL |
||||||
| FLOWS -FRIDAY FLOWS | MATA RISK ON-OFF |
THEME |  |
|||
|
|
08-28-15 | FLOWS |
|
|||
The global economy appears to be moving rapidly back into recession. Commodity prices have crashed to a 13-year low, world industrial production has begun to fall and world trade is contracting. In fact, measured in dollars terms, world trade is collapsing! All around the world, the supply of most products greatly exceeds effective demand. Consequently, prices are falling and production is being scaled back. In short, the global credit bubble is deflating. Let’s quickly review what has brought us to this point and then consider some of the likely consequences. The world stopped backing money with gold at the end of the 1960s. Afterwards, all around the globe, credit growth ran wild for decades. In the US, for instance, total credit/debt grew fifty-fold from $1 trillion in 1964 to $50 trillion in 2007. Then, in 2008, that credit could not be repaid and the world came very close to collapsing into a new great depression. At that stage, global policymakers launched an extraordinary and unprecedented campaign of fiscal and monetary stimulus to prevent the global credit bubble from imploding. It was successful. Trillions of dollars of budget deficits combined with trillions of dollars of new money creation not only prevented the bubble from deflating, but actually made the bubble grow considerably larger. Again, using the US as an example, US household sector net worth hit a peak of $68 trillion in 2007, then collapsed to $55 trillion in 2009, before being reflated by government intervention to $85 trillion today. Now, however, the policy stimulus is no longer adequate to keep the air from leaking out of the global bubble. Japan is still doing its part. The Japanese government ran a budget deficit of 8% of GDP last year and the Bank of Japan is still carrying on with its extraordinarily aggressive “Qualitative and Quantitative Easing” policy by printing Yen 80 trillion a year. The European Central Bank also began doing its share when it started printing €60 billion a month last year. The problem in Europe, however, is on the fiscal side. As a percentage of GDP, budget deficits are really quite low in general, too low to provide any economic stimulus. And, astonishingly, Germany has very foolishly has chosen this moment to balance its budget entirely. The United States contribution to global stimulus has ended altogether. Its budget deficit declined from 10% of GDP in 2009 to less than 3% of GDP last year, while the Fed ended its third round of Quantitative Easing in October. Finally, there is China. After the crisis began in 2008, China made a herculean effort to keep its bubble economy inflated and, by doing so, provided a great deal of global stimulus. For instance, Chinese bank loans more than tripled between 2008 and now. That massive stimulus keep China’s economy growing at more than 7% a year, but only by investing in new plant and equipment on a ridiculous scale. During just two years (2012 and 2013), China produced more cement than the United States did during the entire 20th Century. Now China has far more production capacity across practically every industry than the entire world needs. Therefore, it is not only pointless, but also loss making for China to invest and build any more. But, nearly 50% of China’s GDP is made up of Investment. Moreover, Investment drives job creation and consumption. This explains why China is facing a real crisis. Its entire economic growth model of export-led and investment-driven growth is exhausted and incapable of generating further growth. Suddenly, instead of contributing to global growth by buying more goods from the rest of the world every year, China has become a break on global growth because it has begun to buy less. China’s imports have contracted by more than 10% during the first half of 2015 compared with the first half of 2014. China was the main driver behind the so-called Commodities Super Cycle. Now that China has begun to buy fewer commodities, that Super Cycle has gone into reverse. As a result, commodity prices are crashing and the economies of the commodity producing countries are being slammed. Their currencies are plunging. Investment, job creation and consumption are slowing; and their government budgets are deteriorating. Soon, many of these commodity-producing nations will be unable to repay their international loans. A new “third world debt crisis” may well be just around the corner. These global economic problems are now being compounded by the strengthening Dollar. A strong Dollar pushes down commodity prices and makes dollar-denominated debt more difficult to repay. Therefore, if the Fed now begins to increase US interest rates, these problems will not only persist, they will become considerably worse.
The global downturn has resumed. I expect the global economy will continue to spiral downward until the United States provides another massive dose of stimulus. A fourth round of Quantitative Easing alone would probably prove to be insufficient. A new jolt of fiscal stimulus is also likely to be required. Eventually, I expect to see the United States deliver both fiscal and monetary stimulus. Let’s just hope that that does the trick – one more time. If you are a subscriber to my video-newsletter, Macro Watch, log in and learn how the crisis in the global economy will affect you. If not, join here: http://www.gordontlong.com/RichardDuncan/Macrowatch.htm For a 55% subscription discount, hit the “Click Here to Subscribe Now” tab and use the coupon code: flows
|
||||||
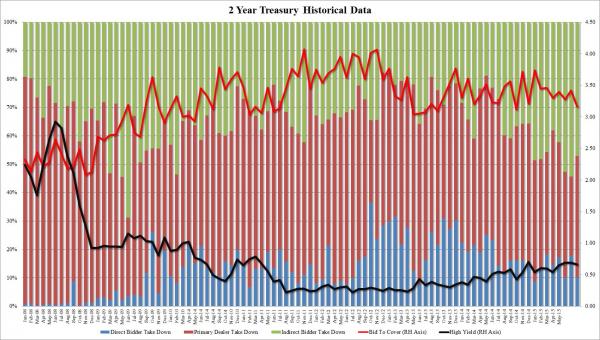
Submitted by Tyler Durden on 08/25/2015 13:15 Weak 2 Year Auction Demand As Repo Pressure Eases From "Super Special" To Virtually NothingLast Friday, when we did a cursory check of Treasury repo rates, we noticed something strange on the short end: the 2Y was trading a whopping -2.5% in repo, suggesting a huge build up of short position coming into the auction. And then on Monday, and especially this morning, the repo pressure evaporate almost entirely, sliding to -1.20% and -0.1%, barely special, which was a signal that today's 2Y auction would hardly be the blockbuster issuance some other recent 2Y auctions have been.
Sure enough, moments ago the sale of $26 billion in 2Year paper was concluded, and it was if not a dud, then certainly lackluster, with a yield of 0.663%, just through the 0.666% When Issued, but it was tthe bid to cover that caught many by surprise: at 3.164 this was the lowest BtC since October's 3.113. The internals were also weak: Directs dropped to just 10.27% while Indirect slid to 47% from 54.4% in July: this was the lowest foreign central bank participation since May. It means that Dealers had to take 42.6% of the auction, the most since April.
So while the auction was an easily forgettable one, what is notable is that the back of the envelope mnemonic of looking at repo "specialness" as an indicator of auction strength (or weakness) continues to work as a very good leading indicator of what to expect out of any one day's TSY auction. |
||||||
| CRACKUP BOOM - ASSET BUBBLE | THEME | |||||
| SHADOW BANKING - LIQUIDITY / CREDIT ENGINE | M | THEME | ||||
| GENERAL INTEREST |
|
|||||
| STRATEGIC INVESTMENT INSIGHTS - Weekend Coverage | ||||||
|
SII | |||||
|
SII | |||||
|
SII | |||||
|
SII | |||||
| TO TOP | ||||||


Read More - OUR RESEARCH - Articles Below

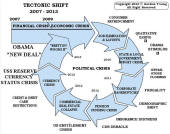
Tipping Points Life Cycle - Explained
Click on image to enlarge
TO TOP
 |
YOUR SOURCE FOR THE LATEST THINKING & RESEARCH
|
�
TO TOP