|
JOHN RUBINO'SLATEST BOOK |
||||||||||||||||||||||||||||||||||||||||||||||||||||||||||||||||||||||||||||||||||||||||||||||||||||||||||||||||||||||||||||||||||||||||||||||||||||||||||||||||||||||||||||||||||||||||||||||||||||||||||||||||||||||||||||||||||||||||||||||||||||||||||||||||||||||||||||||||||||||||||||||||||||||||||||||||||||||||||||
"MELT-UP MONITOR " Meltup Monitor: FLOWS - The Currency Cartel Carry Cycle - 09 Dec 2013 Meltup Monitor: FLOWS - Liquidity, Credit & Debt - 04 Dec 2013 Meltup Monitor: Euro Pressure Going Critical - 28- Nov 2013 Meltup Monitor: A Regression-to-the-Exponential Mean Required - 25 Nov 2013
|
"DOW 20,000 " Lance Roberts Charles Hugh Smith John Rubino Bert Dohman & Ty Andros
|
HELD OVER
Currency Wars
Euro Experiment
Sultans of Swap
Extend & Pretend
Preserve & Protect
Innovation
Showings Below
"Currency Wars "
|
"SULTANS OF SWAP" archives open ACT II ACT III ALSO Sultans of Swap: Fearing the Gearing! Sultans of Swap: BP Potentially More Devistating than Lehman! |
"EURO EXPERIMENT"
archives open EURO EXPERIMENT : ECB's LTRO Won't Stop Collateral Contagion!
EURO EXPERIMENT: |
"INNOVATION"
archives open |
"PRESERVE & PROTE CT"
archives open |

Wed. Mar. 23rd , 2016
Follow Our Updates
on TWITTER
https://twitter.com/GordonTLong
AND FOR EVEN MORE TWITTER COVERAGE
![]()
| MARCH | ||||||
| S | M | T | W | T | F | S |
| 1 | 2 | 3 | 4 | 5 | ||
| 6 | 7 | 8 | 9 | 10 | 11 | 12 |
| 13 | 14 | 15 | 16 | 17 | 18 | 19 |
| 20 | 21 | 22 | 23 | 24 | 25 | 26 |
| 27 | 28 | 29 | 30 | 31 | ||
KEY TO TIPPING POINTS |
| 1- Bond Bubble |
| 2 - Risk Reversal |
| 3 - Geo-Political Event |
| 4 - China Hard Landing |
| 5 - Japan Debt Deflation Spiral |
| 6- EU Banking Crisis |
| 7- Sovereign Debt Crisis |
| 8 - Shrinking Revenue Growth Rate |
| 9 - Chronic Unemployment |
| 10 - US Stock Market Valuations |
| 11 - Global Governance Failure |
| 12 - Chronic Global Fiscal ImBalances |
| 13 - Growing Social Unrest |
| 14 - Residential Real Estate - Phase II |
| 15 - Commercial Real Estate |
| 16 - Credit Contraction II |
| 17- State & Local Government |
| 18 - Slowing Retail & Consumer Sales |
| 19 - US Reserve Currency |
| 20 - US Dollar |
| 21 - Financial Crisis Programs Expiration |
| 22 - US Banking Crisis II |
| 23 - China - Japan Regional Conflict |
| 24 - Corruption |
| 25 - Public Sentiment & Confidence |
| 26 - Food Price Pressures |
| 27 - Global Output Gap |
| 28 - Pension - Entitlement Crisis |
| 29 - Central & Eastern Europe |
| 30 - Terrorist Event |
| 31 - Pandemic / Epidemic |
| 32 - Rising Inflation Pressures & Interest Pressures |
| 33 - Resource Shortage |
| 34 - Cyber Attack or Complexity Failure |
| 35 - Corporate Bankruptcies |
| 36 - Iran Nuclear Threat |
| 37- Finance & Insurance Balance Sheet Write-Offs |
| 38- Government Backstop Insurance |
| 39 - Oil Price Pressures |
| 40 - Natural Physical Disaster |
Reading the right books?
No Time?
We have analyzed & included
these in our latest research papers Macro videos!
![]()
OUR MACRO ANALYTIC
CO-HOSTS
John Rubino's Just Released Book
Charles Hugh Smith's Latest Books
Our Macro Watch Partner
Richard Duncan Latest Books
MACRO ANALYTIC
GUESTS
F William Engdahl
OTHERS OF NOTE
Book Review- Five Thumbs Up
for Steve Greenhut's
Plunder!
|
Have your own site? Offer free content to your visitors with TRIGGER$ Public Edition!
Sell TRIGGER$ from your site and grow a monthly recurring income!
Contact [email protected] for more information - (free ad space for participating affiliates).
HOTTEST TIPPING POINTS |
Theme Groupings |
||
We post throughout the day as we do our Investment Research for: LONGWave - UnderTheLens - Macro
|
|||
|
MOST CRITICAL TIPPING POINT ARTICLES TODAY
|
|
||
| Market - WEDNESDAY STUDIES | |||
| STUDIES - MACRO pdf | |||
TECHNICALS & MARKET |
|
||
Macro-Economy Earnings Expectations The Bond Market
|
|||
Only 4% From Record Highs?Submitted by Lance Roberts via RealInvestmentAdvice.com, In this past weekend’s newsletter, I stated
While I have maintained a cautious stance in portfolio allocations since May of last year, I have reiterated many times that interventions by Central Banks could change the shorter-term dynamic of the markets from bearish back to bullish. These past few weeks have seen exactly that occur. The question that we must primarily answer is whether enough “technical repair” has been completed to warrant an increase in equity exposure in portfolios. As stated above, the “risk” that the current “bear market” rally is nearer completion outweighs the possibility currently the markets are changing back to a “bull market.” Therefore, it is more prudent, for long-term investors, to remain cautious for now. Only 4% From All-Time HighsYesterday, while I was at the gym I looked up to see a “talking head” on CNBC stating the markets are only 4% off of their all-time highs. He was making the case, of course, that the “bull market was back” and the recent sell-off was a “buy the dip” opportunity. But is that really the case? Of course, we will never know for certain until we have the clarity of hindsight. However, since we can’t invest with hindsight we must make some assumptions, or should I say “guesses” about what will happen in the weeks and months ahead. He is correct. The markets are just off of their all-time closing highs as of yesterday’s close as shown below. However, this is only part of the story as the current action in the market is still reminiscent of “broadening market tops” we have witnessed in the past. A quick review of 2000 and 2007 show some important similarities to the current market environment. In 2000, as the market began its long and drawn out topping process, the market plunged by 11.2% in early 2000.The market then rallied back to within just 0.5% of setting new all-time highs before the “dot.com”crash set in. We can see the same “topping process” again in 2007. In August of that year, the market dropped almost 8% and then subsequently rallied to a new “all-time high” leading the bulls to chastise the “bears” for missing out on a “buy-the-dip” opportunity. The market then dove again, another 7.8% decline, followed by a new rally to within just 4% of all-time highs. The airwaves were filled with chatter the “bull market” remained intact as “green shoots” and a “Goldilocks economy” were evident. Nothing was further from the truth. Let’s look at the current market environment once again. As shown above, the current market environment remains very similar to those previous market topping processes. The 8.7% in late summer rallied back to being just shy of setting all-time highs. The “bulls” were lured back into calming waters just as the next wave crashed upon them sending markets down 11.3% to closing lows. Yes…the markets are once again just 3.7% off of their closing highs. The rally from the lows has been extremely sharp and has once again lured the “bulls” back into the water. Could this be when the markets break out to new “all-time” highs and re-establish the underlying bullish trend? Possibly. Or, could this be another rally within an ongoing topping process that leads to sharper losses in the future? The Long-ViewWhile the technical backdrop has indeed improved in the short-term, the longer-term picture still remains worrisome. As shown below, two of the three major monthly sell signals have been triggered. The last will be the crossover of the short-term and long-term monthly averages. As discussed previously, due to the length of time involved in monthly moving averages, by the time this signal crosses the bear market will already be in full swing. However, what is important to note is that all the signs of previous market action during a major market topping process are present.
However, as we approach summer, the seasonal weakness of the markets will likely resurface as the reality of Central Bank interventions are digested and focus once again returns to the real driver of asset prices longer term – profits. As shown below, that is also another picture more reminiscent of past problems for the “bulls.”
We will not know for certain until well into the future when either the “bulls” or “bears” can claim victory. Unfortunately, we don’t have the ability to invest with hindsight.
|
|||
TIPPING POINTS, STUDIES, THESIS, THEMES & SII COVERAGE THIS WEEK PREVIOUSLY POSTED - (BELOW) |
|||
| MOST CRITICAL TIPPING POINT ARTICLES THIS WEEK - Mar 20th, 2016 to Mar 26th, 2016 | |||
| TIPPING POINTS - This Week - Normally a Tuesday Focus | |||
| BOND BUBBLE | 1 | ||
| RISK REVERSAL - WOULD BE MARKED BY: Slowing Momentum, Weakening Earnings, Falling Estimates | 2 | ||
| TIPPING POINTS - This Week - Normally a Tuesday Focus | |||
| RISK REVERSAL - WOULD BE MARKED BY: Slowing Momentum, Weakening Earnings, Falling Estimates | 03-22-16 | 2 | |
Share Buybacks Turn ToxicBy Wolf Richter, WOLF STREET Companies are still borrowing and spending billions on buying back their own shares – one of the big drivers behind the blistering stock market rally of the past few years. It worked wonderfully and without fail. But suddenly, it’s doing the opposite, and now the shares of the biggest buyback queens are getting hammered. Something broke in the gears of this financially engineered market! During the November-January period, 378 of the S&P 500 companies bought back their own shares, according to FactSet. Total buybacks in the quarter rose 5.2% from a year ago, to $136.6 billion. Over the trailing 12 months (TTM), buybacks totaled $568.9 billion. That’s an enormous amount of corporate cash that was dumped on the market! The sector that blew – “blew” because that’s how it turned out – the most money on this type of financial engineering project was Information Technology, with $33.2 billion in buybacks last quarter. Four of the top 10 buyback queens were Information Technology: Apple, Microsoft, Oracle, and Visa. Apple alone blew $6 billion in the quarter, even as its stock was tanking. Relative to its average share price over the period, it paid a 13% premium, the second highest premium paid by S&P 500 companies, after Symantec! Over the trailing 12 months, Apple blew nearly $40 billion on buybacks, and yet its stock dropped 15.5%. This table shows the top 10 buyback queens in order of the amount spent on a TTM basis, and the mostly dismal performance of their shares over the same period.
GE didn’t quite make this list (though it bought back $3.1 billion in Q4), but it was very active in different ways, following through on its $50-billion buyback program announced in April last year. FactSet:
Total buybacks are ballooning in proportion to net income, which declined over the TTM period for the first time since 2009. So buybacks as a percent of income rose from 64.9% a year ago to 68.1% at the end of the quarter. In terms of free cash flow after dividends, share buybacks have now ballooned to 101.7%. This was, as FactSet put it, “a huge jump from the year ago quarter when the ratio was 81.6%.” The culprit? With income down over the TTM period, aggregate free cash flow has dropped 9.5% year-over-year. FactSet’s chart shows the declining net income (green bars), the nearly flat share-buybacks (blue bars), and the rising buyback-to-income ratio (red line, right scale). Note what happened last time income began to decline (2007) and share buybacks followed in 2008: the stock market crashed. And yet, despite the current heroic efforts to prop up their shares, companies have seen their shares get hammered. As FactSet’s chart below shows, over the past 12 months, the S&P 500 total return index, which included dividends, rose 1.3% (green line). But the total return of SPDR S&P 500 Buyback ETF, which tracks the 100 companies in the S&P 500 with the highest buyback ratio, dropped 7.6% (blue line): Clearly, financial engineering is kaput! Buybacks no longer function reliably in inflating stock prices. The opposite seems to be happening. Perhaps investors are finally starting to see through these shenanigans, and perhaps they’re now beginning to fret about all the debt these companies take on in order to fund buybacks! When companies borrow billions to then blow that moolah on buying their own shares that then promptly decline in value, it doesn’t create a loss on the income statement. Instead, those billions quietly go up in smoke. What’s left behind? Fewer shares outstanding, piles of additional debt, mauled cash balances, and much higher financial risk. But once companies see that share buybacks are becoming toxic as their shares decline despite buybacks, they curtail them. And last time this happened – in 2008 – it pulled the rug out from under the already teetering markets. The bull market from early 2009 into May 2015 looks just like every bubble in history, and there’s one sign after the next that we did indeed peak last May. The dominant pattern in the stock market is the “rounded top” pattern. Read… This Chart Shows the First Big Crash Is Likely Just Ahead |
|||
This Chart Shows the First Big Crash Is Likely Just AheadBy Harry Dent, author of the new book, How to Survive (and Thrive) During the Great Gold Bust Ahead:The story on Wall Street and CNBC continues to be that we’re in a correction and this is a buying opportunity. Even Warren Buffett joins the chorus of stock market cheerleaders for the skeptical public. Well, I agree with the skeptical public, not the experts here! The bull market from early 2009 into May 2015 looks just like every bubble in history, and I’m getting one sign after the next that we did indeed peak last May. The dominant pattern in the stock market is the “rounded top” pattern:
After trading in a steep, bubble-like channel from late 2011 into late 2014, with only 10% maximum volatility top to bottom, the market finally lost its momentum… just as the Fed finished tapering its QE. That’s because the Fed was the primary driver in this stock bubble in the first place! But the first sign that the bubble had indeed peaked was the break of that upward channel last August. Surprise, surprise! Without the Fed’s stimulus, stocks started to sputter out! With that sign we can point to what now looks like a series of major tops, in one major index after the next, since late 2014:
The Shanghai Index crashed 45% in 2.5 months, similar to the Dow in late 1929 on its first 2.5-month wave down. That one was so obvious that when I said it was about to burst, it peaked that day and rolled over the next! Then there’s the Biotech bubble that crashed 40% into its February 11 bottom, another one that’s clearly done for. And major global banks are crashing, with even Deutsche Bank in Germany down 59% from its 2015 highs… and 89% from its 2008 highs. You don’t even want to look at the larger banks in Italy! But one analyst after the next still doesn’t think it’s a bubble! So I pull out the next chart, comparing this bubble with the obvious bubble in stocks from late 1994 into early 2000 – the infamous tech bubble.
Again, this looks like every major bubble in history! As I told Grant Williams in an interview for Real Vision, this bubble along with every other follows the same pattern – there’s a rise, a climax, and a sharp fall! From the moment we’re born until we kick the bucket, humans are cyclical along with everything they do. That’s the other thing Grant and I talked about: what’s consistent across humans is that we absolutely refuse to recognize a bubble when we see it. That’s why they call it “living in a bubble!” I told Grant that someone once handed one of my books to Bill Clinton, and I told the guy, “you’re wasting your time!” Economists are bad at seeing bubbles, but politicians are even worse! If the economy does well, they want to take credit for it. If it doesn’t, it’s probably the last party’s fault! They attribute everything to government and give consumers a back seat. It’s laughable! The markets on crack are still in denial about the bubble and its ultimate collapse. The typical stock bubble crashes between 70% to 90%. In other words, they don’t correct… they don’t have a soft landing… they BURST. No exceptions in history. In the rounded top scenario above, we’re getting close to the point where the markets are very likely to fail for the second time to make a new high since the peak in mid-May. When that happens and the S&P 500 falls to new lows below the 1,810 threshold, reality might finally kick in. The markets will then see a more serious wave down, likely into around early July or so. And eventually, it’ll carry the Dow to around 5,500 to 6,000 likely by late 2017. The greatest crash of your life is just ahead… By Harry Dent, author of the new book, How to Survive (and Thrive) During the Great Gold Bust Ahead, where he warns investors that moving their assets into gold isn’t the safe haven they think it is – and why it won’t protect them from the biggest market collapse since The Great Depression. Get a free copy of his eBook here. |
|||
| GEO-POLITICAL EVENT | 3 | ||
| CHINA BUBBLE | 4 | ||
| JAPAN - DEBT DEFLATION | 5 | ||
EU BANKING CRISIS |
6 |
||
| TO TOP | |||
| MACRO News Items of Importance - This Week | |||
GLOBAL MACRO REPORTS & ANALYSIS |
|||
US ECONOMIC REPORTS & ANALYSIS |
|||
| CENTRAL BANKING MONETARY POLICIES, ACTIONS & ACTIVITIES | |||
| Market - WEDNESDAY STUDIES | |||
| STUDIES - MACRO pdf | |||
TECHNICALS & MARKET |
|
||
| COMMODITY CORNER - AGRI-COMPLEX | |||
| THESIS - Mondays Posts on Financial Repression & Posts on Thursday as Key Updates Occur | |||
|
2016 | THESIS 2016 |  |
| 2015 - FIDUCIARY FAILURE | 2015 | THESIS 2015 |  |
| 2014 - GLOBALIZATION TRAP | 2014 |  |
|
|
2013 2014 |
|||
Ty Andros: “ITS A CURRENCY & FINANCIAL EXTINCTION EVENT!”The Financial Repression Authority is pleasured to be revisited by Ty Andros, Chief Investment Officer of the Sanctuary Fund. FRA Co-Founder Gordon T. Long has has a stirring conversation with Mr. Andros on a number of current economic developments and consequently, the things to unfold. Ty began his commodity career in the early 1980’s and became a managed futures specialist beginning in 1985. Mr. Andros duties include marketing, sales, and portfolio selection and monitoring, customer relations and all aspects required in building a successful managed futures and alternative investment brokerage service. Mr. Andros attended the University of San Diego, and the University of Miami, majoring in Marketing, Economics and Business Administration. He began his career as a broker in 1983, and has worked his way to the creation of TraderView of which he is the CEO. Mr. Andros is active in Economic analysis and brings this information and analysis to his clients on a regular basis. Ty prides himself on his personal preparation for the markets as they unfold. Ty is an expert in applying the indirect exchange method as a principle of the Austrian School of Economics in his investing approach. THE AUSTRIAN SCHOOL OF ECONOMICS It consists of 3 major components.
The cycle we are going through now has happened hundreds of times in history and has led to the rise and falls of empires. It’s because of people forgetting the past and repeating the same mistakes. If you don’t have sound money, you really don’t have protection against the government. They can confiscate your money and they have been doing so since Bretton Woods. “The money that we hold in banks is a worthless junk bond. The government has essentially become the mafia; they are scheming and transferring property to themselves.” SOUND MONEY The figure below outlines the specific functions of money: If it doesn’t have these components then you’re not holding money. Until 1971 it had all those features, and it has been replaced with an I.O.U of fiscally and morally bankrupt politicians and banks. It is worth no more than the paper it is printed on. “In my opinion, the gold and silver bear market is over so it is a prime time to start accumulating now.” MARKET CAPITALISM AND WEALTH CREATION Capitalism is about getting more for less and three groups of people being rewarded for it: The consumer because he is able to give his family a better life, the company which supplied it, and the employees within the company. Socialism eats everything. Real wealth and income creation are in freefall. There will be no recovering. The confiscation of wealth is also known as runaway regulations, runaway debt creation, more taxes and currency debasement. “Its pure confiscation, cannibalism, and slavery. It is eating the golden goose. It’s the people that aren’t self-reliant and don’t produce anything eating those that do.” It’s pure confiscation, cannibalism, and slavery. It is eating the golden goose. It’s the people that aren’t self-reliant and don’t produce anything eating those that do. Nobody owns their homes, it’s simply a record that’s held in a database and all they have to do is misplace it. Nobody owns their stocks in their name and if you look at your banking agreement you don’t even have title to your money, the bank does. Slowly but surely they have removed everything. They don’t let you hold money because they can’t steal from it; real money has been outlawed. “Gold is the currency of kings, silver is the currency of merchants, and debt is the currency of slaves.” CURRENCY EXTINCTION EVENT GDP is nothing of the sort, it’s just debt disguised as GDP. It is spending future wealth rather than creating future wealth for proper allocation to productive enterprises. “We have nothing; we are just a bunch of debt slaves living in an illusion until we wake up.” THE EVENTS OF 1971 President Nixon changed from a reserve backed system where the dollar was semi redeemable in gold and silver to a system that has no backing. “It was the greatest heist in history. It was the greatest transfer of wealth from the public to the ‘bankseters’.” He did this so that he wouldn’t have to operate in a prudent manner. Prudent manner means have to pass laws and have taxes which gives people a reason to get up in the morning and have the ability to do the capitalism which was discussed earlier. When you have bad laws and bad regulations, the economy will either collapse or they have to print the money to fill the whole; unfortunately they chose the latter.
“History has shown what happens to people who try to fix this system.” Kennedy was taking the central bank back and creating silver backed money, 90 days later he was dead. Of course we will never truly know, everything is so covered up now and the government is incapable of telling the truth. THE INDIRECT EXCHANGE “This is how you go through a currency and financial extinction event. Exchange something of uncertain value, fiat money, for something of certain value, real wealth. This is the indirect exchange in simplest terms.” So much of the ‘financialization’ of the economy is an illusion because it is not the real things going up; it’s the paper that they’re priced in losing its purchasing power “The greatest applied Austrian economist in the world is none other than Warren Buffet. “ What Warren does is he sells paper which means liabilities are being debased by central bank’s printing presses and credit creation. If he writes an insurance policy for someone for $10 million, he now has a liability of 10 million, if he did this in 2000 that liability may be 5 million and simultaneously he took that money and bought the Burlington Northern Railroad, which is something that will just reprice to reflect the lower purchasing power it is denominated in. If we are in a depression or a boom, regardless the railroads will run. Half of his great track record is inflation that isn’t properly disclosed. He has been doing this since, coincidently 1971. He has been selling paper and buying real things with cash flow ever since. Gold doesn’t cash flow but it is about to. Because of negative interest rates you’re paying somebody to borrow money from you. If you are able to hold your money without having to pay someone to hold it.The gold and silver bear market is over. As these destructive negative interest rates go deeper and deeper, people will eventually wake up. They’ve already woken up, this is what’s going on with the presidential race and particularly Donald Trump. “This is the greatest insanity ever. It will be studied and written about for centuries. It is a much bigger example of stupidity and failing to learn the lessons of history. It is much larger in scale than the Great Depression because of the nature of globalization and the nature of man.” Abstract written by, Karan Singh [email protected] Video Editor: Sarah Tung [email protected]
|
|||
2011 2012 2013 2014 |
|||
| THEMES - Normally a Thursday "Themes" Post & a Friday "Flows" Post | |||
I - POLITICAL |
|||
CENTRAL PLANNING - SHIFTING ECONOMIC POWER - STATISM
MACRO MAP - EVOLVING ERA OF CENTRAL PLANNING
|
G | THEME | |
| - - CRISIS OF TRUST - Era of Uncertainty | G | THEME | |
CORRUPTION & MALFEASANCE - MORAL DECAY - DESPERATION - RESENTMENT. |
US | THEME PAGE |  |
| - - SECURITY-SURVEILLANCE COMPLEX - STATISM | G | THEME | |
| - - CATALYSTS - FEAR (POLITICALLY) & GREED (FINANCIALLY) | G | THEME | |
II-ECONOMIC |
|||
| GLOBAL RISK | |||
| - GLOBAL FINANCIAL IMBALANCE - FRAGILITY, COMPLEXITY & INSTABILITY | G | THEME | |
| - - SOCIAL UNREST - INEQUALITY & A BROKEN SOCIAL CONTRACT | US | THEME | |
| - - ECHO BOOM - PERIPHERAL PROBLEM | M | THEME | |
| - -GLOBAL GROWTH & JOBS CRISIS | |||
| - - - PRODUCTIVITY PARADOX - NATURE OF WORK | THEME | MA w/ CHS |
|
| 01-08-16 | THEME | MA w/ CHS |
|
| - - - STANDARD OF LIVING - EMPLOYMENT CRISIS, SUB-PRIME ECONOMY | US | THEME | MA w/ CHS |
III-FINANCIAL |
|||
|
FLOWS - Capital, Liqudity & Credit Flows
|
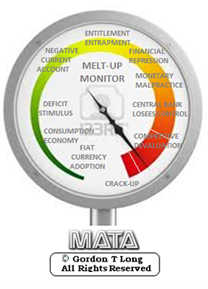
MATA RISK ON-OFF |
THEME | |
| CRACKUP BOOM - ASSET BUBBLE | 12-31-15 | THEME | |
| SHADOW BANKING - LIQUIDITY / CREDIT ENGINE | M | THEME | |
| GENERAL INTEREST |
|
||
| STRATEGIC INVESTMENT INSIGHTS - Weekend Coverage | |||
 |
|||
|
SII | ||
|
SII | ||
|
SII | ||
|
SII | ||
| TO TOP | |||
Read More - OUR RESEARCH - Articles Below
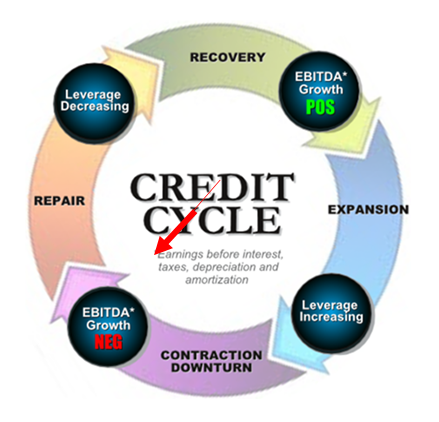
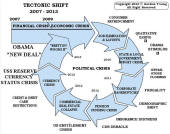
Tipping Points Life Cycle - Explained
Click on image to enlarge
TO TOP
�
TO TOP















![I believe that banking institutions are more dangerous to our liberties than standing armies. If the American people ever allow private banks to control the issue of their currency, first by inflation, then by deflation, the banks and corporations that will grow up around [the banks] will deprive the people of all property until their children wake-up homeless on the continent their fathers conquered. The issuing power should be taken from the banks and restored to the people, to whom it properly belongs. - Thomas Jefferson](../quotes-pictures/quote-i-believe-that-banking-institutions-are-more-dangerous-to-our-liberties-than-standing-armies-if-thomas-jefferson-283953.jpg)


