|
JOHN RUBINO'SLATEST BOOK |
||||||||||||||||||||||||||||||||||||||||||||||||||||||||||||||||||||||||||||||||||||||||||||||||||||||||||||||||||||||||||||||||||||||||||||||||||||||||||||||||||||||||||||||||||||||||||||||||||||||||||||||||||||||||||||||||||||||||||||||||||||||||||||||||||||||||||||||||||||||||||||||||||||||||||||||||||||||||||||||||||||||||||||
"MELT-UP MONITOR " Meltup Monitor: FLOWS - The Currency Cartel Carry Cycle - 09 Dec 2013 Meltup Monitor: FLOWS - Liquidity, Credit & Debt - 04 Dec 2013 Meltup Monitor: Euro Pressure Going Critical - 28- Nov 2013 Meltup Monitor: A Regression-to-the-Exponential Mean Required - 25 Nov 2013
|
"DOW 20,000 " Lance Roberts Charles Hugh Smith John Rubino Bert Dohman & Ty Andros
|
HELD OVER
Currency Wars
Euro Experiment
Sultans of Swap
Extend & Pretend
Preserve & Protect
Innovation
Showings Below
"Currency Wars "
|
"SULTANS OF SWAP" archives open ACT II ACT III ALSO Sultans of Swap: Fearing the Gearing! Sultans of Swap: BP Potentially More Devistating than Lehman! |
"EURO EXPERIMENT"
archives open EURO EXPERIMENT : ECB's LTRO Won't Stop Collateral Contagion!
EURO EXPERIMENT: |
"INNOVATION"
archives open |
"PRESERVE & PROTE CT"
archives open |

RECAP
Sun. Apr. 17th , 2016
Follow Our Updates
on TWITTER
https://twitter.com/GordonTLong
AND FOR EVEN MORE TWITTER COVERAGE
![]()
| APRIL | ||||||
| S | M | T | W | T | F | S |
| 1 | 2 | |||||
| 3 | 4 | 5 | 6 | 7 | 8 | 9 |
| 10 | 11 | 12 | 13 | 14 | 15 | 16 |
| 17 | 18 | 19 | 20 | 21 | 22 | 23 |
| 24 | 25 | 26 | 27 | 28 | 29 | 30 |
KEY TO TIPPING POINTS |
| 1- Bond Bubble |
| 2 - Risk Reversal |
| 3 - Geo-Political Event |
| 4 - China Hard Landing |
| 5 - Japan Debt Deflation Spiral |
| 6- EU Banking Crisis |
| 7- Sovereign Debt Crisis |
| 8 - Shrinking Revenue Growth Rate |
| 9 - Chronic Unemployment |
| 10 - US Stock Market Valuations |
| 11 - Global Governance Failure |
| 12 - Chronic Global Fiscal ImBalances |
| 13 - Growing Social Unrest |
| 14 - Residential Real Estate - Phase II |
| 15 - Commercial Real Estate |
| 16 - Credit Contraction II |
| 17- State & Local Government |
| 18 - Slowing Retail & Consumer Sales |
| 19 - US Reserve Currency |
| NEW - Stagflation - Slow Growth & Personal Inflation |
| 20 - US Dollar |
| 21 - Financial Crisis Programs Expiration |
| 22 - US Banking Crisis II |
| 23 - China - Japan Regional Conflict |
| 24 - Poorly Regulated Corruption |
| 25 - Public Sentiment & Confidence |
| 26 - Food Price Pressures |
| 27 - Global Output Gap |
| 28 - Pension - Entitlement Crisis |
| 29 - Central & Eastern Europe |
| 30 - Terrorist Event |
| 31 - Pandemic / Epidemic |
| 32 - Rising Inflation Pressures & Interest Pressures |
| 33 - Resource Shortage |
| 34 - Cyber Attack or Complexity Failure |
| 35 - Corporate Bankruptcies |
| 36 - Iran Nuclear Threat |
| 37- Finance & Insurance Balance Sheet Write-Offs |
| 38- Government Backstop Insurance |
| 39 - Oil Price Pressures |
| 40 - Natural Physical Disaster |
Reading the right books?
No Time?
We have analyzed & included
these in our latest research papers Macro videos!
![]()
OUR MACRO ANALYTIC
CO-HOSTS
John Rubino's Just Released Book
Charles Hugh Smith's Latest Books
Our Macro Watch Partner
Richard Duncan Latest Books
MACRO ANALYTIC
GUESTS
F William Engdahl
OTHERS OF NOTE
Book Review- Five Thumbs Up
for Steve Greenhut's
Plunder!
|
HOTTEST TIPPING POINTS |
Theme Groupings |
||
We post throughout the day as we do our Investment Research for: LONGWave - UnderTheLens - Macro
|
|||
"BEST OF THE WEEK " MOST CRITICAL TIPPING POINT ARTICLES TODAY
|
|
||
TIPPING POINTS, STUDIES, THESIS, THEMES & SII COVERAGE THIS WEEK PREVIOUSLY POSTED - (BELOW) |
|||
| MOST CRITICAL TIPPING POINT ARTICLES THIS WEEK - Apr 11th, 2016 to April 16th, 2016 | |||
| TIPPING POINTS - This Week - Normally a Tuesday Focus | |||
| BOND BUBBLE | 1 | ||
| RISK REVERSAL - WOULD BE MARKED BY: Slowing Momentum, Weakening Earnings, Falling Estimates | 2 | ||
| GEO-POLITICAL EVENT | 3 | ||
| CHINA BUBBLE | 4 | ||
| JAPAN - DEBT DEFLATION | 5 | ||
EU BANKING CRISIS |
6 |
||
8 - Shrinking Revenue Growth Rate |
04-12-16 | 8 - Shrinking Revenue Growth Rate |
|
Supply Chain Slump"Worse Than The Great Recession"Submitted by Jeffrey Snider via Alhambra Investment Partners, Not to continue beating a dead horse, but I have a stick and the carcass is right in front of me. The entire supply chain inside the US economy is full agreement both on where the economy is right now and, perhaps more importantly, how it came to be that way. Such harmony is not atypical, as synchronicity usually defines the hard edges of any cycle. This, however, is something else entirely, especially as it stretches back years and confirms we are witnessing nothing like the usual. As it is, this latest part or phase or whatever has already taken up nearly two years. In terms of wholesale sales, as noted this morning, overall sales peaked in July 2014 – meaning nineteen months (thru Feb 2016) of deceleration into sustained contraction. Worse and what is probably the most concerning is that after those nineteen months inventory is only just now starting to correct, and it is doing so ever so gently. That suggests again slowdown without yet any visible end. In that sense, recession might actually be the best case since it would greatly speed up the affair in at least the convergence and reversion of inventory to sales (though that would still leave questions about the economic trend after it). By comparison, the Great Recession featured just nine months of contraction; the whole of the dot-com recession twelve. Those were both top to bottom, peak to trough, over and done with. In 2016, we are very likely facing two years and still only the beginning of reconciliation or balance, and no idea what that might mean further down in wider economic feedbacks and negative multipliers. The supply chain, top to bottom:
One other noteworthy interpretation: to find the “goods economy” including the whole of the supply chain in such joined, steady dislocation cannot be anything but a negative comment on the whole of the economy, services included. That starts with the fact that a significant portion (as much as half) of the “services economy” directly addresses the “goods economy” (retail, wholesale, transportation, etc.). Beyond that, if there is total breakdown in growth and advance in goods that can only mean a serious problem with US consumers. It has already forced economists and policymakers to completely abandon what was in late 2014 and early 2015 inarguable recovery and success. Just because it has not, so far, acted like recession does not propose a clean bill of health (just like it did not, last year, recommend this was all some temporary slump worthy of nothing but dismissal). Instead, that it has continued on for so long suggests quite the opposite, and, again, likely worse than just recession prospects in the long run. |
|||
| TO TOP | |||
| MACRO News Items of Importance - This Week | |||
GLOBAL MACRO REPORTS & ANALYSIS |
|||
US ECONOMIC REPORTS & ANALYSIS |
|||
| CENTRAL BANKING MONETARY POLICIES, ACTIONS & ACTIVITIES | |||
| Market - WEDNESDAY STUDIES | |||
| STUDIES - MACRO pdf | |||
TECHNICALS & MARKET |
|
||
TECHNICALS & MARKET |
04-13-16 |
||
Q1 SECTOR PERFORMANCE
|
|||
| COMMODITY CORNER - AGRI-COMPLEX | |||
| THESIS - Mondays Posts on Financial Repression & Posts on Thursday as Key Updates Occur | |||
|
2016 | THESIS 2016 |  |
| 2015 - FIDUCIARY FAILURE | 2015 | THESIS 2015 |  |
| 2014 - GLOBALIZATION TRAP | 2014 |  |
|
|
2013 2014 |
|||
James Rickards:“The only way every currency can get cheaper at the same time, is not against themselves, but against Gold!”James Rickards, Chief Global Strategist at West Shore Funds and a widely renowned author is interviewed by FRA Co-founder Gordon T. Long in which they discuss Jim’s just released book The New Case for Gold. They also delve into issues concerning the false perceptions of the world switching back to a Gold Standard and the reasons for a suspected G-20 stealth “Shanghai Accord”. THE NEW CASE FOR GOLD James Rickards suggests that there is a new case for Gold and points out that everyone thinks that what they own currently, in terms of stocks, bonds and other financial securities, is actually only “electronic digits” representing claims on assets. The new reality of Cyber war and Cyber attack suggests the real possibility of a single group of people or political regime hacking U.S servers. The potential exists today for investors to lose wealth and there will be almost nothing any one can do to bring back that money, at least in any realistic period of time. Physical Gold cannot be hacked nor simply be erased from the world’s ledger. It is the most tangible and secure way of preserving wealth and James recommends a portfolio with at least 10% being allocated to physical Gold. Being outside the system, and being non-digital are the two main reasons that smart investors economists suggest will ensure having some sort of security for your wealth. Gold meets both these requirements and in the next big financial crisis will provide you with insurance for the rest of your portfolio.
OUTSIDE THE BANKING SYSTEM – The Best Kind if Insurance The financial system is inherently unstable based on:
Gold acts as an insurance policy no matter what happens:
Gold is always gold – It’s outside the banking system, can’t be reproduced by fiat, It cannot be “hacked”.
Jim talks to FRA about methodically dispelling the decades old arguments and fallacies associated with going back to the Gold Standard. He additionally dispels myths such as:
GOLD IS STILL A MONETARY ASSET & REAL MONEY Rickards feels that over 40 years of “un-education or mis-education” has resulted in the new generation of economists and youth not understanding the importance or the value behind why gold is so important for our economy. We cannot blame the new generation for this gap inn their knowledge. We have not been teaching Gold as money in university curriculum and along with myths created about gold have virtually disowning it from economic thinking.
Gold is the one form of monetary value that can’t fight back which is why they have completely stopped educating the U.S public on Gold as a whole. A POST MONETARY RESET – Gold after the Next Crisis The current financial system is inherently unstable and may soon have to be reformed. Gold will play a prominent role, if that happens. The IMF is the third largest holder of official gold reserves after the United States. Gold is at the very center of international finance as the International Monetary Fund (IMF) with its Special Drawing Rights (SDR) reserve currency is regaining prominence. In addition, the current valuation of the SDR could not be calculated without using gold, even though one has to go back to the 1970s to understand why. China is not only acquiring vast quantities of physical gold, it is also going through the hassle of infiltrating the London gold market and simultaneously setting up its own clearing mechanism in Shanghai. Russia has boosted its gold to GDP ratio to 2.7 percent, higher than the United States percentage of 1.7 percent. All powers are acquiring gold to have some bargaining power when the international financial system will be reformed.
Why? After redistributing the official gold holdings and having monetized everything from bonds to stocks, the world’s governments and central banks won’t have a choice left other than to devalue paper money compared to gold, the same trick President Roosevelt used during the great depression and with the same objective of getting rid of an unsustainable debt burden. In a monetary reset, gold will be the chips that are used to play a game of poker. Russians, Chinese and even the Iranians are stock piling gold because of this fear. If Gold has a role in the future monetary system, Gold’s price has to go up. Gold cannot multiply at the alarming rate that we will need it for. But we can always increase the price which is why the current monetary system will fail in terms of Gold in the future and will still hold the parity between money supply and demand. James expects a price target of $10,000 for the future if this falls in line.
James new book The New Case for Gold is available in stores and online now and provides an in-depth analysis on the old and new reasons for why Gold is a necessity in our upcoming monetary system. As always for more analysis and interviews follow us on twitter @FRAuthority or Subscribe to our YouTube channel, Financial Repression Authority for weekly interviews. Abstract Writer: Saad Gohir [email protected] Video Editor: Min Jung Kim [email protected]
|
|||
2011 2012 2013 2014 |
|||
| THEMES - Posts Normally on Thursday OR as Key Updates Occur | |||
I - POLITICAL |
|||
CENTRAL PLANNING - SHIFTING ECONOMIC POWER - STATISM
MACRO MAP - EVOLVING ERA OF CENTRAL PLANNING
|
G | THEME | |
| - - CRISIS OF TRUST - Era of Uncertainty | G | THEME | |
CORRUPTION & MALFEASANCE - MORAL DECAY - DESPERATION - RESENTMENT. |
US | THEME PAGE |  |
| - - SECURITY-SURVEILLANCE COMPLEX - STATISM | G | THEME | |
| - - CATALYSTS - FEAR (POLITICALLY) & GREED (FINANCIALLY) | G | THEME | |
II-ECONOMIC |
|||
| GLOBAL RISK | |||
| - GLOBAL FINANCIAL IMBALANCE - FRAGILITY, COMPLEXITY & INSTABILITY | G | THEME | |
| - - SOCIAL UNREST - INEQUALITY & A BROKEN SOCIAL CONTRACT | US | THEME | |
| - - ECHO BOOM - PERIPHERAL PROBLEM | M | THEME | |
| - -GLOBAL GROWTH & JOBS CRISIS | |||
| - - - PRODUCTIVITY PARADOX - NATURE OF WORK | THEME | MA w/ CHS |
|
| 01-08-16 | THEME | MA w/ CHS |
|
| - - - STANDARD OF LIVING - EMPLOYMENT CRISIS, SUB-PRIME ECONOMY | US | THEME | MA w/ CHS |
| - - - STANDARD OF LIVING - EMPLOYMENT CRISIS, SUB-PRIME ECONOMY | US | THEME | MA w/ CHS |
19 Signs That American Families Are Being Economically DestroyedVia Michael Snyder's Economic Collapse blog, The systematic destruction of the American way of life is happening all around us, and yet most people have no idea what is happening. Once upon a time in America, if you were responsible and hard working you could get a good paying job that could support a middle class lifestyle for an entire family even if you only had a high school education. Things weren’t perfect, but generally almost everyone in the entire country was able to take care of themselves without government assistance. We worked hard, we played hard, and our seemingly boundless prosperity was the envy of the entire planet. But over the past several decades things have completely changed. We consumed far more wealth than we produced, we shipped millions of good paying jobs overseas, we piled up the biggest mountain of debt in the history of the world, and we kept electing politicians that had absolutely no concern for the long-term future of this nation whatsoever. So now good jobs are in very short supply, we are drowning in an ocean of red ink, the middle class is rapidly shrinking and dependence on the government is at an all-time high. Even as we stand at the precipice of the next great economic crisis, we continue to make the same mistakes. In the end, all of us are going to pay a very great price for decades of incredibly foolish decisions. Of course a tremendous amount of damage has already been done. The numbers that I am about to share with you are staggering. The following are 19 signs that American families are being economically destroyed… #1 The poorest 40 percent of all Americans now spend more than 50 percent of their incomes just on food and housing. #2 For those Americans that don’t own a home, 50 percent of them spend more than a third of their incomes just on rent. #3 The price of school lunches has risen to the 3 dollar mark at many public schools across the nation. #4 McDonald’s “Dollar Menu & More” now includes items that cost as much as 5 dollars. #5 The price of ground beef has doubled since 2009. #6 In 1986, child care expenses for families with employed mothers used up 6.3 percent of all income. Today, that figure is up to 7.2 percent. #7 Incomes fell for the bottom 80 percent of all income earners in the United States during the 12 months leading up to June 2014. #8 At this point, more than 50 percent of all American workers bring home less than $30,000 a year in wages. #9 After adjusting for inflation, median household income has fallen by nearly $5,000 since 2007. #10 According to the New York Times, the “typical American household” is now worth 36 percent less than it was worth a decade ago. #11 47 percent of all Americans do not put a single penny out of their paychecks into savings. #12 One survey found that 62 percent of all Americans are currently living paycheck to paycheck. #13 According to the U.S. Department of Education, 33 percent of all Americans with student loans are currently behind on their student loan debt repayments. #14 According to one recent report, 43 million Americans currently have unpaid medical debt on their credit reports. #15 The rate of homeownership in the U.S. has been declining for seven years in a row, and it is now the lowest that it has been in 20 years. #16 For each of the past six years, more businesses have closed in the United States than have opened. Prior to 2008, this had never happened before in all of U.S. history. #17 According to the Census Bureau, 65 percent of all children in the United States are living in a home that receives some form of aid from the federal government. #18 If you have no debt at all, and you also have 10 dollars in your wallet, that you are wealthier than 25 percent of all Americans. #19 On top of everything else, the average American must work from January 1st to April 24th just to pay all federal, state and local taxes. All of us know people that once were doing quite well but that are now just struggling to get by from month to month. Perhaps this has happened to you. If you have ever been in that position, you probably remember what it feels like to have people look down on you. Unfortunately, in our society the value that we place on individuals has a tremendous amount to do with how much money they have. So if you don’t have much money, there are a lot of people out there that will treat you like dirt. The following excerpt comes from a Washington Post article entitled “The poor are treated like criminals everywhere, even at the grocery store“…
Have you ever seen this? Have you ever experienced this yourself? These days, most people on food stamps are not in that situation because they want to be. Rather, they are victims of our long-term economic collapse. And this is just the beginning. When the next major economic crisis strikes, the suffering in this country is going to go to unprecedented levels. As we enter that time, we are going to need a whole lot more love and compassion than we are exhibiting right now. As a nation, we have made decades of incredibly bad decisions. As a result, we are experiencing bad consequences which are going to become increasingly more severe. The numbers that I just shared with you are not good. But over the next several years they are going to get a whole lot worse. Everything that can be shaken will be shaken, and life in America is about to change in a major way. |
|||
III-FINANCIAL |
|||
|
FLOWS - Capital, Liqudity & Credit Flows
|
MATA RISK ON-OFF |
THEME | |
Wall Street Rushes to Aid CLO Market as New Rules Cloud Outlook
Wall Street is moving to prop up the $881 billion market for leveraged loans by helping the largest buyers of the debt overcome tougher regulations. JPMorgan Chase & Co., Citigroup Inc. and Bank of America Corp. are among banks exploring ways to arrange a type of financing for managers of collateralized loan obligations that would help them comply with the rules, according to people with knowledge of the matter. The funding would allow managers to put in less of their own capital to conform with so-called risk retention rules that require them to keep some skin in the game to avoid excessive risk-taking. The banks have a very good reason to help. CLOs purchased more than 60 percent of leveraged loans last year and if they aren’t able to get off the ground, that could jeopardize buyout deals that have relied on the backing of credit markets. CLO issuance has already plunged to its slowest pace in more than four years and making it easier for managers to comply may help revive the market. “Risk retention and the financing solution is part of a bigger puzzle for the whole leveraged-finance universe,” said Maggie Wang, Citigroup’s head of U.S. CLO research. “If CLO issuance falls, it will have a major impact on the loan market." Vertical StripCLOs pool high-yield corporate debt that are often sold to finance some of the largest buyouts. The bundled debt is sliced into securities of varying risk with ratings that range from AAA down to B. The new risk-retention rules, a part of the Dodd-Frank reform, require CLO managers to hold 5 percent of their deals. A manager can do this either by buying up 5 percent of the junior-most portion, known as the equity tranche, or by purchasing a little bit of each portion of the CLO structure -- or the so-called vertical strip -- to make up its 5 percent holding. The banks are offering to raise money from investors to help provide the vertical-strip financing for CLO managers, the people said, asking not to be identified as the information isn’t public. One option the lenders are discussing is arranging financing for the safest portion of the vertical-strip, leaving the CLO manager having to look after the rest, the people said. Smallest CheckBanks may be willing to provide financing for between five and 12 years, the people said. Longer-term financing that more closely matches the maturity period for the vehicles is better for CLO managers so they can avoid the risk of having to refinance before their fund matures. Without the financing from the banks, the manager of a $500 million CLO might have to put in $25 million to comply with the rules. That’s five times as much as the $5 million the same manager may have to tip in if it can secure financing for most of the vertical strip, the people said. “This is the path to the smallest check for a manager to write,” said Oliver Wriedt, co-president of CIFC Asset Management. “The reason this financing solution is a hot topic is because poorly capitalized CLO managers and their underwriters want to find access to market.” Representatives for JPMorgan, Citigroup and Bank of America declined to comment. New CLO sales plunged to $8.2 billion in the first three months of the year, its slowest stretch since 2012. That follows nearly $100 billion of CLO sales in 2015 and a record $124 billion in 2014. Bank of America cut its CLO issuance forecast for the year to $45 billion, less than half the total in 2015. JPMorgan analysts said it could fall to as low as $35 billion, after loans last year suffered their first downturn since 2008 and as managers grapple with the new rules. Funding discussions between banks and CLO managers come as firms including Leon Black’s Apollo Global Management LLC raise fresh capital to address the new rules. “Financing will be a big part of the solution,” said David Preston, an analyst at Wells Fargo & Co. “It will certainly help CLO managers continue issuing deals." |
|||
One Junk Bond Analyst's Catastrophic Forecast For What Is Coming
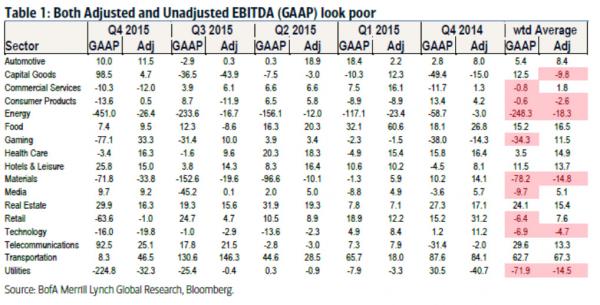
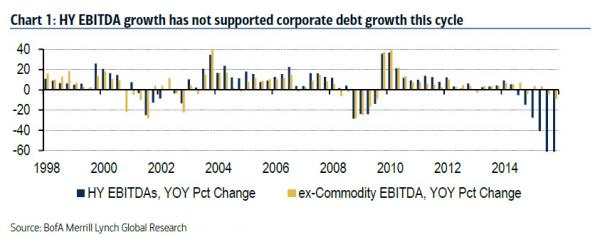
- BofA High Yield strategist Michael Contopoulos While not as quixotic as Morgan Stanley's Adam Parker piece on market-chasing cockroaches, BofA high yield analyst Michael Contopoulos has moved beyond merely bearish and is now outright catastrophic . That may be a little far fetched, but in his latest note - while he doesn't call rally chasers "cockroaches" (yet), he seems at a loss to explain the ongoing junk bond rally. His reasoning: fundamentals just keep getting worse by the day, while price action has completely disconnected from reality, and virtually nobody expects what is about to unfold in the junk bond space. First, according to his assessment of deteriorating macro and micro indicators, the recent price move makes little sense:
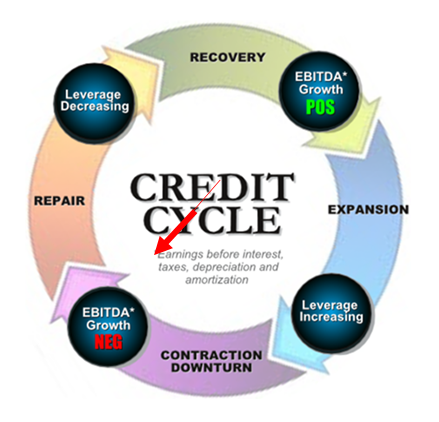
Then he looks at where in the credit cycle the market currently finds itself:
That is a bold assumption with every central bank having become an activist, but yes: ultimately fundamentals will prevail.
Next, he proceeds to the "apocalyptic part", stating quite clearly that "the losses over the credit cycle could be worse than we've ever seen before." One reason: central bank intervention that keeps kicking the can instead of allowing the disastrous fundamentals to finally reveal themselves.
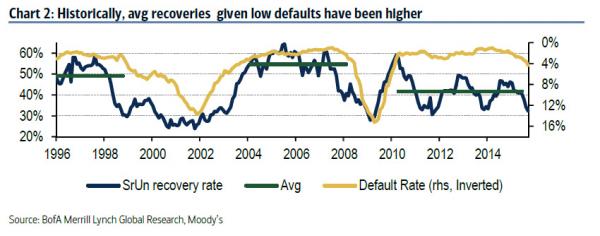
It's not just the upcoming surge defaults. Contopoulos also e focuses on product-specific issues which we have discussed before, namely the already record low recovery rates, a unique feature of this particular default cycle. These are only going to get worse.
One reason for the collapse in recovery rates: the extensively documented chronic underinvestment in replenishing the asset base, and instead "investing" in buybacks and dividends.
If that wasn't bad enough, it gets worse: "Given that HY companies have seen hardly any organic growth within last few years, it is of little surprise that recoveries today are so low. The bad news is that we think they are going to decline further." Contopoulos then analyzes various fundamental trends to determine the shape of the upcoming default cycle, and concludes with the following bleak assessment:
According to Contopoulos, investors are only slowly starting to appreciate just how bad the future will be for junk bond investors:
Welcome to the brave new world of massive default losses and record low recoveries.
Come to think of it, we almost prefer Adam Parker's incoherent ramblings about cockroaches better: at least it gave some sense that there could be a happy ending. If only for the cockroaches that is.... |
|||
| CRACKUP BOOM - ASSET BUBBLE | 12-31-15 | THEME | |
| SHADOW BANKING - LIQUIDITY / CREDIT ENGINE | M | THEME | |
| GENERAL INTEREST |
|
||
| STRATEGIC INVESTMENT INSIGHTS - Weekend Coverage | |||
 |
|||
|
SII |  |
|
US Retail Sales Tumble Into Recession Territory Driven By Auto Sales Plunge 04/13/2016 04/13/2016
After stumbling sideways around unch MoM for 3 months, US retail sales tumbled 0.3% in March (considerably worse than the 0.1% MoM gain expected) confirming BofA's credit card data as we warned. March's print is practically the weakest month since Feb 2015 and is unlikely to get much better given the dismally weak start to April, as we noted here. After 3 months of low-base bounce in YoY retail sales, March saw it collapse back to just 1.7% YoY - deep in recession territory.
|
04-16-16 | SII |  |
April Retail Sales Plunge Most Since 2005Something ugly this way comes. As we noted last week, despite proclamations that any weakness in US spending or economic data is merely seasonal or transitory, BofA's credit and debit card spending data revealed that sales were notably weak. Today we get further confirmation of what Retail ETF investors have been seeing for a while as Johnson-Redbook reported a 2.8% plunge in Same-Store-Sales - the worst start to an April since 2005. Which confirms the chart below shows the seasonally adjusted retail sales ex-autos measure from the BAC aggregate card data was unchanged SA in March, leaving the 3-month moving average to decline 0.2%. While a part of this weakness owes to a continued decline in gasoline prices. We find that retail sales ex-autos and gasoline was up 0.3% mom SA, which continues to be in a downward trend. This confirms the downward revision to the Census Bureau data in January which made government data more consistent with the BAC internal data. According to Bank of America, "we therefore also look for only a slight improvement in March Census Bureau sales, in a similar pattern as the BAC internal data" which means that Q1 GDP is weak for a very specific reason: consumer spending remains anemic. And as Credit Suisse notes, Retail stocks remain under pressure... XRT has seen shares outstanding drop by 65% since July 2015 and by 25% in the last week hitting a 52 week low. Investors redeeming positions in the ETF on the back of GAP same store sales of -6% for March (leading to a 13.84% pullback on Friday and 20% over the past 5 days). L Brands also disappointed on Friday falling 4.34% after announcing a restructure (GS downgraded them today and was negative on the space). The XRT has fallen around 4% in the last week, breaking the 200 day moving average recently. FL, NKE, UA, and LULU weakness appears to be driven by concerns around 1. Women’s athletic apparel slowing concerns and 2. Basketball footwear slowing concerns (MSCO cautious on UA yesterday) And Luxury retail hit on LVMH #s... and even Prada is under pressure - Prada Yields to Lower Asia Demand With Lower-Priced Bags In the words of Prada SpA Chairman Carlo Mazzi, value for money is the way ahead. After posting its lowest profit in five years on slowing Asian demand, the Italian leather-goods maker on Monday announced a turnaround plan that includes offering more lower-priced handbags in the 1,200-to-1,400 euro range ($1,370-to-$1,600). If you’re still priced out, there’s always Prada stock, trading at a discount to its peers, and down nearly 50 percent in the past year in Hong Kong. |
|||
US Retail Sales Tumble Into Recession Territory Driven By Auto Sales PlungeAfter stumbling sideways around unch MoM for 3 months, US retail sales tumbled 0.3% in March (considerably worse than the 0.1% MoM gain expected) confirming BofA's credit card data as we warned. March's print is practically the weakest month since Feb 2015 and is unlikely to get much better given the dismally weak start to April, as we noted here. After 3 months of low-base bounce in YoY retail sales, March saw it collapse back to just 1.7% YoY - deep in recession territory. March Retail Sales plunge... The string of misses for Control Group Retail Sales continues... As Auto Sales collapse 2.1% MoM... which should not surprise since US Auto Sales (SAAR), via WARD's Automative Group, tumbled 3.5% YoY to end March - the biggest YoY plunge since July 2009 (pre-Cash-for-Clunkers)...
and perhaps just as problematic, Restaurants tumbled 0.8% - where all the hiring has been. and if you are hopeful about April, Johnson-Redbook reported a 2.8% plunge in Same-Store-Sales - the worst start to an April since 2005. Finally, as Goldman notes, weakness in auto sales and production could be an unwelcome headache for the manufacturing sector. Growth in auto output has accounted for 40% of the increase in manufacturing production since January 2012, not including spillovers to related sectors (Exhibit 4). The total effect is likely bigger, as spillovers from auto manufacturing can be significant:
Although prospects for the manufacturing sector have started to look brighter, a pullback in motor vehicle activity could limit the extent of any rebound. |
|||
|
SII |  |
|
|
SII |  |
|
|
SII |  |
|
Doha Is Done: Saudi Prince Drops Bomb - "No Deal Without Iran...We Are Selling At Every Opportunity"04/15/2016In what appears to be a Doha party-pooping statement, Saudi deputy crown prince Mohammed bin Salman stated unequivocally that The Kingdom won’t restrain its oil production unless other producers, including Iran, agree to freeze output at a meeting this weekend in Doha. This a major problem because - if you remember - this week's melt-up in oil (and thus stocks) was predicated on an anonymous diplomat cited by Interfax saying a deal will get done without Iran (which the Russians refused to confirm). All that hope crushed by a reality that has been painfully obvious that no side will be given in the Iran-Saudi tete-a-tete... and now, as Citi warned "expect a sharp sell-off."
|
04-15-16 | SII |  |
Crude Loses Key Technical Support As BNP Sees Oil - Revisiting The Year's Lows
|
|||
| TO TOP | |||
Read More - OUR RESEARCH - Articles Below
Tipping Points Life Cycle - Explained
Click on image to enlarge
TO TOP
�
TO TOP
