|
JOHN RUBINO'SLATEST BOOK |
||||||||||||||||||||||||||||||||||||||||||||||||||||||||||||||||||||||||||||||||||||||||||||||||||||||||||||||||||||||||||||||||||||||||||||||||||||||||||||||||||||||||||||||||||||||||||||||||||||||||||||||||||||||||||||||||||||||||||||||||||||||||||||||||||||||||||||||||||||||||||||||||||||||||||||||||||||||||||||||
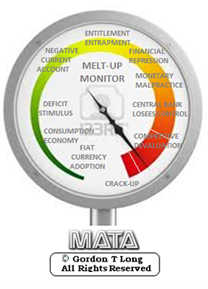
"MELT-UP MONITOR "
Meltup Monitor: FLOWS - The Currency Cartel Carry Cycle - 09 Dec 2013 Meltup Monitor: FLOWS - Liquidity, Credit & Debt - 04 Dec 2013 Meltup Monitor: Euro Pressure Going Critical - 28- Nov 2013 Meltup Monitor: A Regression-to-the-Exponential Mean Required - 25 Nov 2013
|

![]()
"DOW 20,000 "
Lance Roberts Charles Hugh Smith John Rubino Bert Dohman & Ty Andros
|

HELD OVER
Currency Wars
Euro Experiment
Sultans of Swap
Extend & Pretend
Preserve & Protect
Innovation
Showings Below
"Currency Wars "
|


"SULTANS OF SWAP" archives open ACT II ACT III
ALSO Sultans of Swap: Fearing the Gearing! Sultans of Swap: BP Potentially More Devistating than Lehman! |

"EURO EXPERIMENT"
archives open EURO EXPERIMENT : ECB's LTRO Won't Stop Collateral Contagion!
EURO EXPERIMENT: |

![]()
"INNOVATION"
archives open |

"PRESERVE & PROTE CT"
archives open |

Weekend Apr. 2nd , 2016
Follow Our Updates
on TWITTER
https://twitter.com/GordonTLong
AND FOR EVEN MORE TWITTER COVERAGE
![]()
| MARCH | ||||||
| S | M | T | W | T | F | S |
| 1 | 2 | 3 | 4 | 5 | ||
| 6 | 7 | 8 | 9 | 10 | 11 | 12 |
| 13 | 14 | 15 | 16 | 17 | 18 | 19 |
| 20 | 21 | 22 | 23 | 24 | 25 | 26 |
| 27 | 28 | 29 | 30 | 31 | 1 | 2 |
KEY TO TIPPING POINTS |
| 1- Bond Bubble |
| 2 - Risk Reversal |
| 3 - Geo-Political Event |
| 4 - China Hard Landing |
| 5 - Japan Debt Deflation Spiral |
| 6- EU Banking Crisis |
| 7- Sovereign Debt Crisis |
| 8 - Shrinking Revenue Growth Rate |
| 9 - Chronic Unemployment |
| 10 - US Stock Market Valuations |
| 11 - Global Governance Failure |
| 12 - Chronic Global Fiscal ImBalances |
| 13 - Growing Social Unrest |
| 14 - Residential Real Estate - Phase II |
| 15 - Commercial Real Estate |
| 16 - Credit Contraction II |
| 17- State & Local Government |
| 18 - Slowing Retail & Consumer Sales |
| 19 - US Reserve Currency |
| 20 - US Dollar |
| 21 - Financial Crisis Programs Expiration |
| 22 - US Banking Crisis II |
| 23 - China - Japan Regional Conflict |
| 24 - Corruption |
| 25 - Public Sentiment & Confidence |
| 26 - Food Price Pressures |
| 27 - Global Output Gap |
| 28 - Pension - Entitlement Crisis |
| 29 - Central & Eastern Europe |
| 30 - Terrorist Event |
| 31 - Pandemic / Epidemic |
| 32 - Rising Inflation Pressures & Interest Pressures |
| 33 - Resource Shortage |
| 34 - Cyber Attack or Complexity Failure |
| 35 - Corporate Bankruptcies |
| 36 - Iran Nuclear Threat |
| 37- Finance & Insurance Balance Sheet Write-Offs |
| 38- Government Backstop Insurance |
| 39 - Oil Price Pressures |
| 40 - Natural Physical Disaster |
Reading the right books?
No Time?

We have analyzed & included
these in our latest research papers Macro videos!
![]()
OUR MACRO ANALYTIC
CO-HOSTS
John Rubino's Just Released Book
![]()
Charles Hugh Smith's Latest Books
![]()
![]()
Our Macro Watch Partner
Richard Duncan Latest Books

MACRO ANALYTIC
GUESTS
F William Engdahl

![]()
![]()

![]()

![]()

![]()
OTHERS OF NOTE
![]()
![]()

![]()


![]()
Book Review- Five Thumbs Up
for Steve Greenhut's
Plunder!

![]()
|
Have your own site? Offer free content to your visitors with TRIGGER$ Public Edition!
Sell TRIGGER$ from your site and grow a monthly recurring income!
Contact [email protected] for more information - (free ad space for participating affiliates).
HOTTEST TIPPING POINTS |
Theme Groupings |
||
We post throughout the day as we do our Investment Research for: LONGWave - UnderTheLens - Macro
|
|||
|
MOST CRITICAL TIPPING POINT ARTICLES TODAY
|
|
||
 |
|||
|
04-02-16 | SII | |
It gets surreal when looking at the forward energy sector P/E (as defined by Bloomberg) charted over time.
What is beyond strange is that while forward earnings have imploded in just the past three months, prices of energy companies have actually gone up. In other words, the market's discounting mechanism is not only broken but is now going in reverse, where the worse the projected earnings, the better for stock prices?
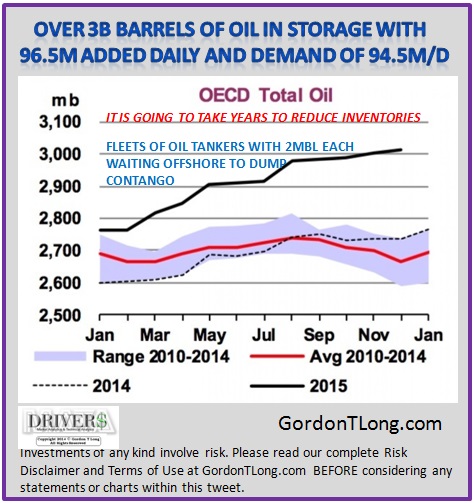
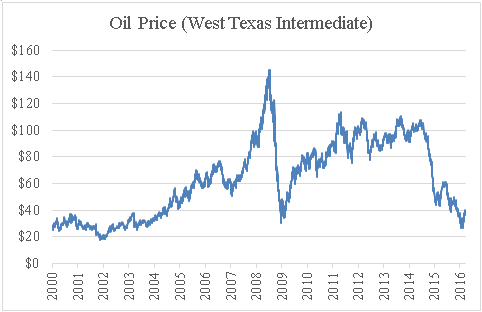
IMBALANCES HAVE BEEN IMPROVED A PARABOLIC STOP-AND-REVERSE Crude oil futures flashed a sell signal — based on a technical indicator called the parabolic stop-and-reverse — for the first time since early February as prices fell below the $40 threshold. Further declines look likely.
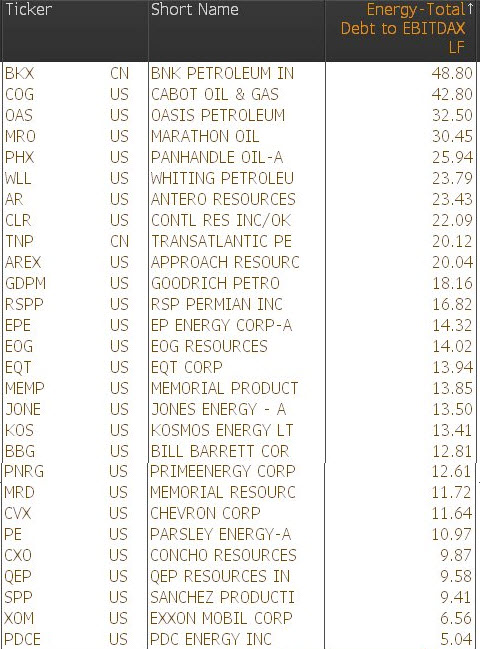
TRADERS NOW EXPECTING 1- Russian / OPEC Negotitations to Splinter 2- US$ To Strengthen 3- Increased Supply from "Contango" Cargo Fleets 4-Credit Withdrawal of +30% by Banks to Energy Lenders with Debt > 4X EBITDA
Submitted by Nick Cunningham via OilPrice.com,
CHRIS CASEY: WindRock Wealth Management
EFFECT OF LOWER OIL PRICES
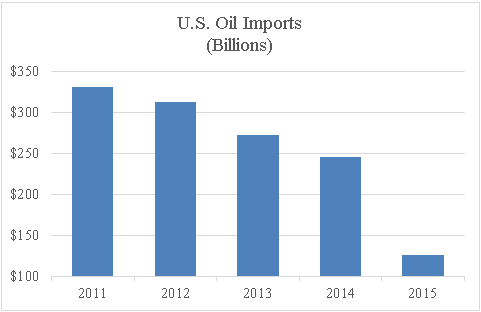
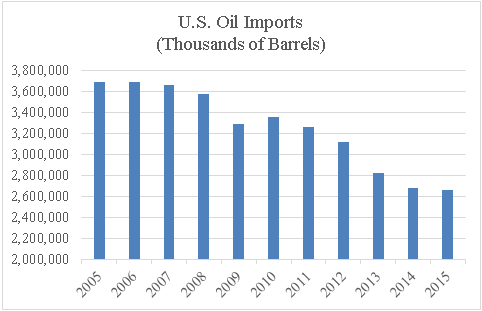
STATE OF THE OIL MARKETS Lower energy prices used to be considered good for the economy, since people have more money to spend. But that’s going toward servicing debt; it’s not actually consumption, it’s going toward debt payments. There are also some real dangers that aren’t being discussed by mainstream media. Oil production has increased about 85% since 2008, but what isn’t mentioned is how oil imports have decreased. It’s down from approximately 12% of total imports to 5% today, not just in Dollar terms but overall volume.
SAUDIA ARABIA PEG The Riyadh is pegged to the US Dollar at 3.75 Riyadh to the US Dollar, but their economy is under strain and their deficit is staggering. In any fixed exchange rate, the only way to keep it is through manipulation of the currency market by active buying and selling of Riyadh and US Dollars, but that is only making them go bankrupt faster. This could ultimately affect US interest rates as well. OIL SUPPLY & DEMAND
FEDERAL RESERVE’S MISCONCEPTIONS Regarding the nature of growth, history shows that the key is a high level of savings and decreasing government intervention. Another is the idea of deflation being bad; for example, the US experienced experienced two 30-40 year periods where the price level fell by half, but it was also the greatest period of growth in US history. The Federal Reserve also has misconceptions about inflation’s impact on unemployment, and interest rates, which could cause a banking crisis. ADVICE FOR INVESTORS If people believe that the oil market will create a banking crisis in the future, then they need to look at assets outside of the banking system. Gold and silver should absolutely be considered as part of their portfolio since it’s much safer than a number of currencies, as it has alternative value. Farmland is also an excellent inflation hedge and pays a dividend, unlike precious metals.
|
|||
TIPPING POINTS, STUDIES, THESIS, THEMES & SII COVERAGE THIS WEEK PREVIOUSLY POSTED - (BELOW) |
|||
| MOST CRITICAL TIPPING POINT ARTICLES THIS WEEK - Mar 27th, 2016 to April 2nd, 2016 | |||
| TIPPING POINTS - This Week - Normally a Tuesday Focus | |||
| BOND BUBBLE | 1 | ||
| RISK REVERSAL - WOULD BE MARKED BY: Slowing Momentum, Weakening Earnings, Falling Estimates | 2 | ||
| GEO-POLITICAL EVENT | 3 | ||
| CHINA BUBBLE | 4 | ||
| JAPAN - DEBT DEFLATION | 5 | ||
EU BANKING CRISIS |
6 |
||
20 - US Dollar |
03-29-16 | 20 |
|
TRADING THE SHANGHAI ACCORD The YEN & EURO Will be Increased in Value Together => Flat
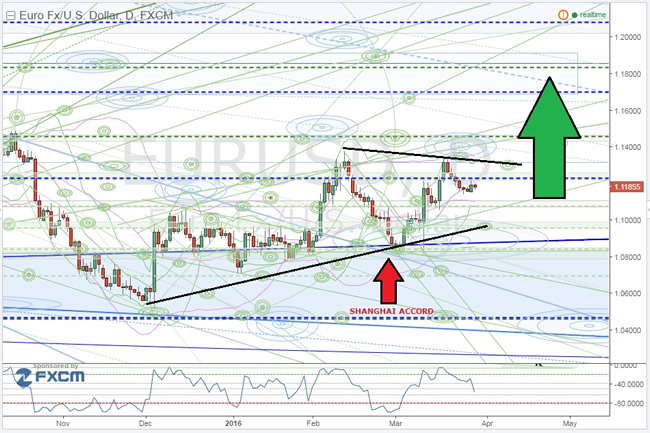
The USD WILL WEAKEN Against the Euro => EURUSD Will Rise
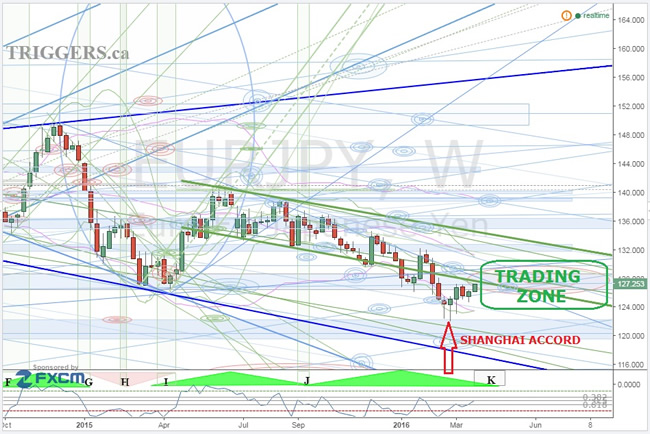
The USD WILL WEAKEN Against the Yen => USDJPY Will Fall |
|||
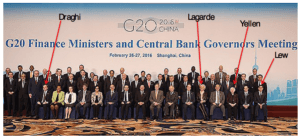
The Dollar Has Been ShanghaiedThe U.S. dollar has just been knocked down and forced to serve the interests of the world against the will of the American people. The dollar has been Shanghaied! The term “Shanghaied” refers to the 19th-century practice of sailors forced to serve against their will on vessels bound for Shanghai and other ports in China. Victims were often from West Coast port cities such as San Francisco, Portland and Seattle. Tactics used included kidnapping, beatings and forms of trickery. In the 19th century, trade between the U.S. and China was booming. But there were persistent shortages of able-bodied seamen to sail the cargo vessels. Each vessel had a boarding officer whose job it was to find the crews. Boarding officers were paid by the number of bodies they could round up before the vessel set sail. This pay was called “blood money” for good reason. The law at the time said the once a seamen “signed on” with a vessel, it was illegal to leave the ship until the journey was complete. Jumping ship at any point in the journey would result in imprisonment. A common tactic was to confront a seaman in a dark alley, knock him unconscious, forge his signature on the manifest and drag him aboard. The seamen would regain consciousness after the vessel left port. At that point, there was no choice but to finish the journey or jump ship when he could. Most finished the journey. Next stop — Shanghai! Based on the best information we’ve been able to obtain: It looks like the dollar has just been Shanghaied by the G-20 (the unelected, unaccountable group of 20 nations that collectively control the world monetary system) on Feb 26th, 2016 at the G-20 Meeting In Shanghai, China. This could be the most important financial development of 2016, with enormous implications for you and your portfolio. Once again, the city of Shanghai is the center of attention. This new effort to knock out the dollar was contrived in a secret meeting in Shanghai on Feb. 26. Who attended the meeting? The list of names reads like a rogues’ gallery of central planners and currency manipulators. Janet Yellen from the Fed, Christine Lagarde from the IMF, Mario Draghi from the ECB and U.S. Secretary of the Treasury Jack Lew were all there, along with their central bank and finance ministry counterparts from Japan, China and the other BRICS. Here’s the “class picture” of those who attended the G-20 conclave, with some of the main players identified. The main meeting of the G-20 finance ministers and central bank governors was no secret. It was conducted with much fanfare and publicity. Thousands of reporters descended on Shanghai to cover the proceedings. A side meeting of a core group consisting of the U.S., Europe, Japan, China and the IMF was a secret. This group really calls the shots. The U.S., Europe, Japan and China together represent over 70% of global GDP. The IMF acts as a kind of facilitator for these secret meetings, and an “enforcer” for whatever agreements are reached behind closed doors. The outcome of this secret side meeting was the biggest dollar take-down operation since the famous Plaza Accord of 1985. The Plaza Accord was orchestrated by James Baker, who was Ronald Reagan’s secretary of the Treasury at the time. The dollar had increased almost 50% between 1980–1985, and reached an all-time high that year. The strong dollar was hurting U.S. exports and jobs. The Plaza Accord was a coordinated effort by the U.S., France, West Germany, Japan and the U.K. to weaken the dollar. It worked. The dollar fell 30% over the next three years. The U.S. economy got a second wind, and the long Reagan-Bush expansion continued. Now the dollar is at a 10-year high on major indexes. It’s time to trash the dollar again. But the U.S. does not have the same skillful leadership we had in James Baker. This time, the big winner won’t be the U.S.; it will be China. The losers will be the same — Japan and Europe. Understanding these backroom machinations of the power elite requires some history and analysis. Here’s what you need to know: BERNANKE'S "ENRICH THY NEIGHBOR" DOCTRINE Currency manipulations are negative-sum games. One country can get a small temporary boost from devaluation, but trading partners are worse off, and the world is worse off. Ultimately, even the country that devalued first is worse off after others retaliate. However, a new theory of currency manipulation was created by Ben Bernanke. This theory says that if every country eases at the same time, everyone gets the benefit of easing, but exchange rates don’t change much because of the coordinated timing. Bernanke called this “enrich thy neighbor,” in contrast to the original “beggar thy neighbor” name given to currency wars in the 1930s. The concept of cooperation and coordination among the central banks can be carried several steps further. Several countries can ease or tighten at the same time in order to give one country some relative benefit by design. Central banks can give targeted relief to one country if they all cooperate in a secret plan. Central bank policy changes work through expectations as much as actions. In traditional policy, a central bank eases by cutting rates or tightens by raising rates. But it can also ease by raising expectations about a rate increase and then doing nothing. If markets price in a rate increase and the central bank does nothing, markets can rally on the news. This is like an invisible rate cut, based solely on changed expectations. Having multiple central banks manipulate expectations and coordinate policy behind the scenes is complex. These efforts are doomed to fail because of unintended consequences and exogenous shocks. But that won’t stop the big brains from trying. CHINESE "DESTABILIZING" DEVALUATION This brings us to China’s shock devaluation of the yuan last August. Because China had not managed expectations, this shock destabilized the global financial system. The IMF and the Fed were quite upset that China was not playing by the rules of the game. On the other hand, China did not care much about the rules, because their economy was sinking under bad debts and capital outflows. China acted in its best interests regardless of the global impact. With this background and the recent yuan shock in mind, the global financial powers descended on Shanghai in late February. The G-20 central bankers and finance ministers agreed that China needed help. It’s the world’s second-largest economy and it was falling fast. There was some danger it could take the world down with it. But further yuan devaluation was not possible (in the short run) because it was too destabilizing to markets. SHANGHAI ACCORD The solution is to weaken the yuan on a relative basis by strengthening the currencies of China’s major trading partners, Japan and Europe. In other words, if the yen and euro get stronger, that’s the same as making the yuan weaker, but without the shock of Chinese devaluation. Since this secret deal was worked out on Feb. 26, the first chance the central bankers had to put their plan into action was mid-March.
Yet how could Japan and Europe tighten without explicitly raising rates? They did it by raising expectations. Markets thought Draghi’s ECB “bazooka” would be long lasting. Markets expected Kuroda of the Bank of Japan to do more aggressive QE.
Both decisions acted like tightening relative to expectations. The euro and yen went up against the dollar immediately. Comparatively, the yuan went down with no explicit devaluation by China. This was the new Shanghai Accord in action. The dollar declined 30% after the coordinated action at the Plaza Accord in 1985. The dollar’s recent strength since the all-time low in 2011 is also shown. This is the period leading up to the new Shanghai Accord, also shown. Will the dollar now plunge 30%, as it did after 1985? It might. If that happens, the shock waves will be felt in every market in the world.
The Shanghai Accord will be a game changer depending on how hard the insiders push their new playbook. The Fed took a slightly different tack in this plan. Markets pay most attention to the yuan/dollar cross-rate; that’s the one the Chinese government manipulates. The yuan/euro and yuan/yen cross-rates just go where they go based on the euro/dollar and yen/dollar crosses. The dollar cross-rates are the ones markets pay most attention to. So the Fed weakened the dollar with their dovish comments at the March 16 meeting. (Again, by doing nothing and signaling slower tightening, they changed expectations, which is a form of ease.) With Europe and Japan tightening and the U.S. easing at the same time, nobody noticed that China effectively devalued, because the yuan/dollar cross-rate was unchanged. Neat! Europe is a larger trading partner to China than the U.S., so the yuan/euro cross-rate is actually more important to the Chinese economy. What happened under the Shanghai Accord was a coordinated devaluation that went unnoticed because China took no official action and the yuan/dollar cross-rate was unchanged. It was an invisible devaluation of the yuan. Japan and Europe were the losers in this round of currency manipulations. Japan was the winner in 2013 with Abenomics. Europe was the winner in 2014 with negative rates and Euro QE. Now it was the turn of China and the U.S. to get a lift. The U.S. and China are the world’s two largest economies. If they go down, the whole world goes down with them. Both economies were showing signs of weakness. It was time for Europe and Japan to give it up to China and the U.S. That’s the legacy of the Shanghai Accord. What’s next? There’s another secret G-20 meeting on April 16, 2016. This will take place on the sidelines of the IMF spring meeting in Washington, D.C. I’ll be in Washington then reporting from the front lines. At the April conclave, I expect the Big Four (Japan, U.S., the eurozone and China) to leave exchange rates alone for the time being. They’ll want time to evaluate their work following the Shanghai Accord before taking next steps. The Big Four may later want to run the Shanghai playbook again just to give China more breathing room. The Shanghai Accord seems like a success for the central banks. This means the Big Four will want to try it again to ease financial conditions in the U.S. and China. They won’t push it too far, because Japan and Europe are fragile. We’ll wait to see the indications and warnings before the April meeting. For now, a stronger yen and stronger euro are both in the cards. The consequences for Asia of a stronger yen and weaker yuan are not difficult to discern. Japanese corporate profits will be hurt two ways. Japanese exporters will be hurt because their products will be more expensive for foreign buyers. Japanese multinationals will be hurt when their overseas earnings are translated back into yen. It’s a double-whammy for the Japanese stock market. The Shanghai Accord happened in stealth, but it will go down in history as a major turning point in the international monetary system. |
|||
| TO TOP | |||
| MACRO News Items of Importance - This Week | |||
GLOBAL MACRO REPORTS & ANALYSIS |
|||
US ECONOMIC REPORTS & ANALYSIS |
|||
| CENTRAL BANKING MONETARY POLICIES, ACTIONS & ACTIVITIES | |||
| Market - WEDNESDAY STUDIES | |||
| STUDIES - MACRO pdf | |||
TECHNICALS & MARKET |
|
||
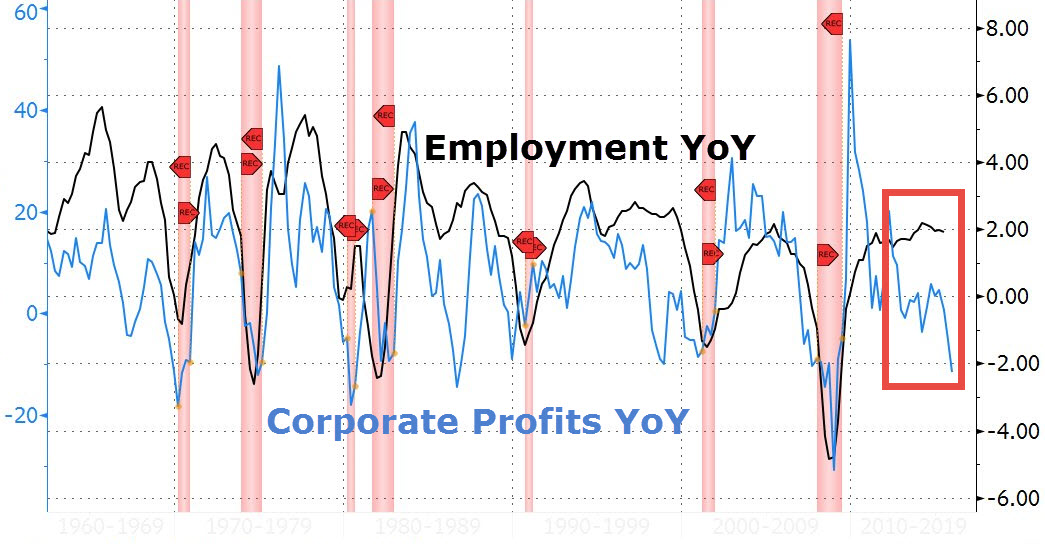
This (Crashing) Trend Is Not Your FriendDespite Yellen's best efforts today to basically dismiss any and all data as irrelevant going forward in The Fed's decision-making process, we suspect all eyes (and algos) will be firmly glued to this week's payrolls' data. Will it be another record month for Obama to crow about? Will Mark Zandi do the "told you so dance" to all the trump supporters who seem less exuberant about the recovery? One look at this chart - and the disastrous trend - and we suspect, sooner-rather-than-later, the fecal matter will be striking the rotating object in America... As Bloomberg notes, a growing gap is developing between corporate profits and job growth in the U.S. Company earnings, a key driver of business spending and employment, tumbled in the fourth quarter and history shows that when they retreat, the economy often follows.
So we wonder just what kind of seasonal-adjustments are being used to ensure this gap remains. Notice the "gap" in 1999... that did not end well. BofAML's Michael Contopoulos adds that it is no surprise that falling corporate earnings is a leading indicator for economic recessions – when corporates struggle to grow their bottom lines, they are forced to source liquidity through either the capital markets or cost cutting methods. And when funding either becomes unavailable or too expensive, companies must scale back through capex and/or personnel reductions. Although a US recession is not a necessary precondition for a turn in the credit cycle, but matters only so much as its influence on the shape of the next wave of defaults, we still look closely at how macroeconomic factors could affect corporate health. And it becomes concerning to us that after a 2nd consecutive decline in year over year corporate earnings, coupled with a lack of worker productivity and higher wages, that soon the very rosy jobs numbers may begin to disappoint. With personal spending increasing by a paltry 0.1% for each of the past 3 months, we believe consumer spending habits are already more conservative than they should be given low gasoline prices and currently favorable employment statistics. Should jobs numbers begin to disappoint, in our opinion consumers would be quick to pull back and save more of their income. Even a marginally weaker spender could have a substantial impact on the most vulnerable companies, forcing these weakest links to liquidate, fire and default. The potential for this added labor slack could lead to a further pullback in consumer spending and produce stress within the next weakest links in the chain. This self-perpetuating cycle, should it continue, could create a rolling blackout as defaults migrate from one sector to the next. And while Energy and Materials are currently in the crosshairs, we could envision a number of sectors that could come into focus and prove unable to withstand the added stress of a weaker consumer. To this end, we believe more attention should be paid to the current fundamentals of US corporates and the vulnerability of what are now considered ‘healthy’ high yield sectors to a wave of defaults that has the potential to spread into all industries. Although technicals are currently keeping the market afloat, we are not buyers of the market at current levels and believe fundamentals will ultimately force spreads wider.
|
|||
| COMMODITY CORNER - AGRI-COMPLEX | |||
| THESIS - Mondays Posts on Financial Repression & Posts on Thursday as Key Updates Occur | |||
|
2016 | THESIS 2016 |  |
| 2015 - FIDUCIARY FAILURE | 2015 | THESIS 2015 |  |
| 2014 - GLOBALIZATION TRAP | 2014 |  |
|
 |
|||
|
2013 2014 |
 |
||
Michael Pento: “Price discovery is essential, it is the nucleus of capitalism and we haven’t had it in decades!”FRA Co-founder Gordon T. Long is joined by Michael Pento in discussing topics from the government debt problem, the current boom in gold and the outlook of the dollar. Mr. Pento is the President and Founder of Pento Portfolio Strategies (PPS). PPS is a Registered Investment Advisory Firm that provides money management services and research for individual and institutional clients. Mr. Pento is a well-established specialist in the Austrian School of economics and a regular guest on CNBC, Bloomberg, FOX Business News and other national media outlets. His market analysis can also be read in most major financial publications, including the Wall Street Journal. He also acts as a Financial Columnist for Forbes, Contributor to thestreet.com and is a blogger at the Huffington Post. Prior to starting PPS, Mr. Pento served as a senior economist and vice president of the managed products division of another financial firm. There, he also led an external sales division that marketed their managed products to outside broker-dealers and registered investment advisors. Additionally, Mr. Pento has worked for an investment advisory firm where he helped create ETFs and UITs that were sold throughout Wall Street. Earlier in his career Mr. Pento spent two years on the floor of the New York Stock Exchange. He has carried series 7, 63, 65, 55 and Life and Health Insurance Licenses. Mr. Pento graduated from Rowan University in 1991. KEYNESIAN INTEREST RATE MANIPULATION “You cannot take interest rates down to zero percent and then into the negative territory, constantly increase the amount of something I like to call ‘quantitative counterfeiting’ and ultimately hope for a good ending. It’s just not possible.” They’re constantly pushing interest rates lower and lower and now to the point where if you’re going to loan money to somebody, you’re going to pay them to do it. The reason their doing this as a method to make their debt serviceable; they need to make ends-meat so they borrow at lower cost. We know there is going to be a collapse because markets have been aggravated and not allowed to function for years. “30% of all the worlds sovereign debt now has a negative sign in front of it, that’s $7 trillion.” Here’s the main issue, let’s consider Japan: There is -0.1% for the Japanese 10yr note, an all-time record low. You’re loaning money to Japan, a nation that has 250% debt-GDP and you’re loaning this money going out for 10 years. All for the deal that you’re going to lose money each and every year in nominal terms, and then they have an inflation target and assuming they meet it, Japanese authorities will eventually step in and all of a sudden begin fighting inflation. The only thing this can lead to is an enormous implosion. “Price discovery is essential, it is the nucleus of capitalism and we haven’t had it in decades.” SUSTAINING GOVERNMENT DEBT “As debt has increased, interest rates have gone lower; it is all that they can do.” When you base a nation’s growth, not on productivity and the size of the labour force, rather on market bubbles, furthermore when you consider there is 19-20 trillion in the US of outstanding debt; there is just no tax base that can finance this. Look what Draghi had to do, it was not enough to buy $60 billion euros a month, they went to 80 billion, and why just buy government debt when you can buy corporate debt? These practise make no sense, seemingly there is no rationally thinking individual that enforces decisions. We are stuck until we are hit with an inevitable implosion. The trigger will be when they reach their inflation targets and then become inflation fighters. There will be a period of time following this where you will see bond yield completely unravel, they will soar, and consequently stock prices and economic growth will plummet. CENTRAL BANK PATTERNS Local banks have their excess reserves at the central bank, and now the central banks rather than paying to keep the reserves, they are charging for the reserves. They are doing this so banks can go out looking for someone who cannot pay back in taking out a loan, else they will simply go buy more sovereign debt. “Have we become such children in this world where grown men and women cannot just come forth and admit they have made a mistake and admit there will be a year or two of a recession or depression followed by prosperity?” If you have so much debt which you cannot pay back, something has to change; the debt needs to be restructured. Debt is not fixed by artificially taking out interest rates and forcing individuals to take out more debt. We are not adjusting we just keep rolling the debt over and over. “Capitalist systems do not work unless you have a cleansing at some point of excess debt. It is a healthy and necessary part of growth.” THE GOLD BOOM Well now in a time where if you stick your money in a sovereign note in a bank, you either get nothing from it or even charged for doing so, gold is definitely lucrative now more than ever. Additionally the ratio between gold miners and gold has never been lower than it is now. As interest rates go more and more negative across the globe, more and more money will be put into gold because for every ounce of gold you’ll pull out just that, an ounce of gold. “The only escape is a deflationary depression on a global scale from the likes of which the world has never seen.” ADVICE FOR INVESTORS “Gold is going to be a winner no matter what happens, there is no losing scenario for gold.” To have 20-25% of my portfolio in mining shares which is high as far as Wall Street is concerned. So have gold, short in the market, and the only place being long is with energy. being long with energy as of late has proven to show great results. Forget base metals and in terms of energy it’s a great hedge in being short in the market. THE FUTURE OF THE DOLLAR “As I predicted, I have been on record in December of 2015 in saying the dollar will fall hard and it did. I knew it was going to happen because I knew the economic data wasn’t supportive of floor rate hikes and this is what the dollar was priced in. It is important to question not what the dollar is going to do against the Yen and Euro, but moreover intrinsically against gold. I believe all the currencies out there are going to lose their value, the reason being that the real money out there and it has been for thousands of years, is none other than gold. “ Abstract written by, Karan Singh [email protected] Video Editor: Min Jung Kim [email protected]
|
|||
2011 2012 2013 2014 |
 |
||
I - POLITICAL |
|||
CENTRAL PLANNING - SHIFTING ECONOMIC POWER - STATISM
MACRO MAP - EVOLVING ERA OF CENTRAL PLANNING
|
G | THEME | |
| - - CRISIS OF TRUST - Era of Uncertainty | G | THEME | |
CORRUPTION & MALFEASANCE - MORAL DECAY - DESPERATION - RESENTMENT. |
US | THEME PAGE |  |
| - - SECURITY-SURVEILLANCE COMPLEX - STATISM | G | THEME | |
| - - CATALYSTS - FEAR (POLITICALLY) & GREED (FINANCIALLY) | G | THEME | |
II-ECONOMIC |
|||
| GLOBAL RISK | |||
| - GLOBAL FINANCIAL IMBALANCE - FRAGILITY, COMPLEXITY & INSTABILITY | G | THEME | |
| - - SOCIAL UNREST - INEQUALITY & A BROKEN SOCIAL CONTRACT | US | THEME | |
| - - ECHO BOOM - PERIPHERAL PROBLEM | M | THEME | |
| - -GLOBAL GROWTH & JOBS CRISIS | |||
| - - - PRODUCTIVITY PARADOX - NATURE OF WORK | THEME | MA w/ CHS |
|
| 01-08-16 | THEME | MA w/ CHS |
|
| - - - STANDARD OF LIVING - EMPLOYMENT CRISIS, SUB-PRIME ECONOMY | US | THEME | MA w/ CHS |
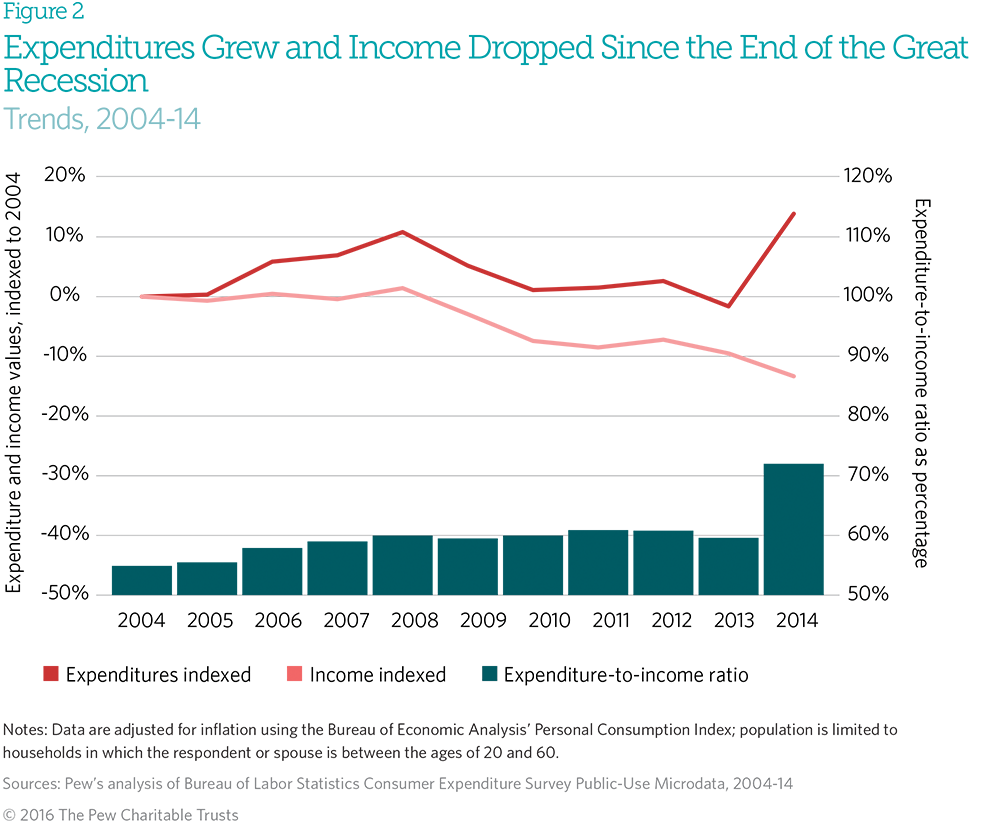
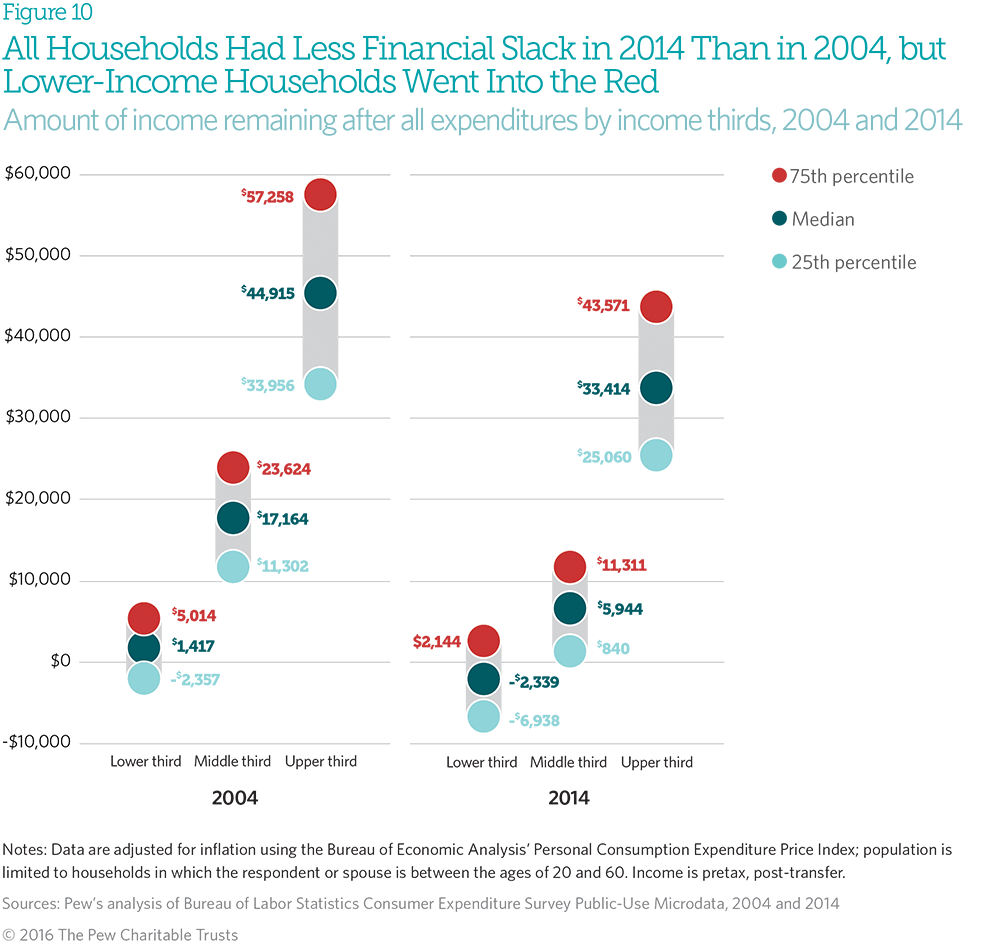
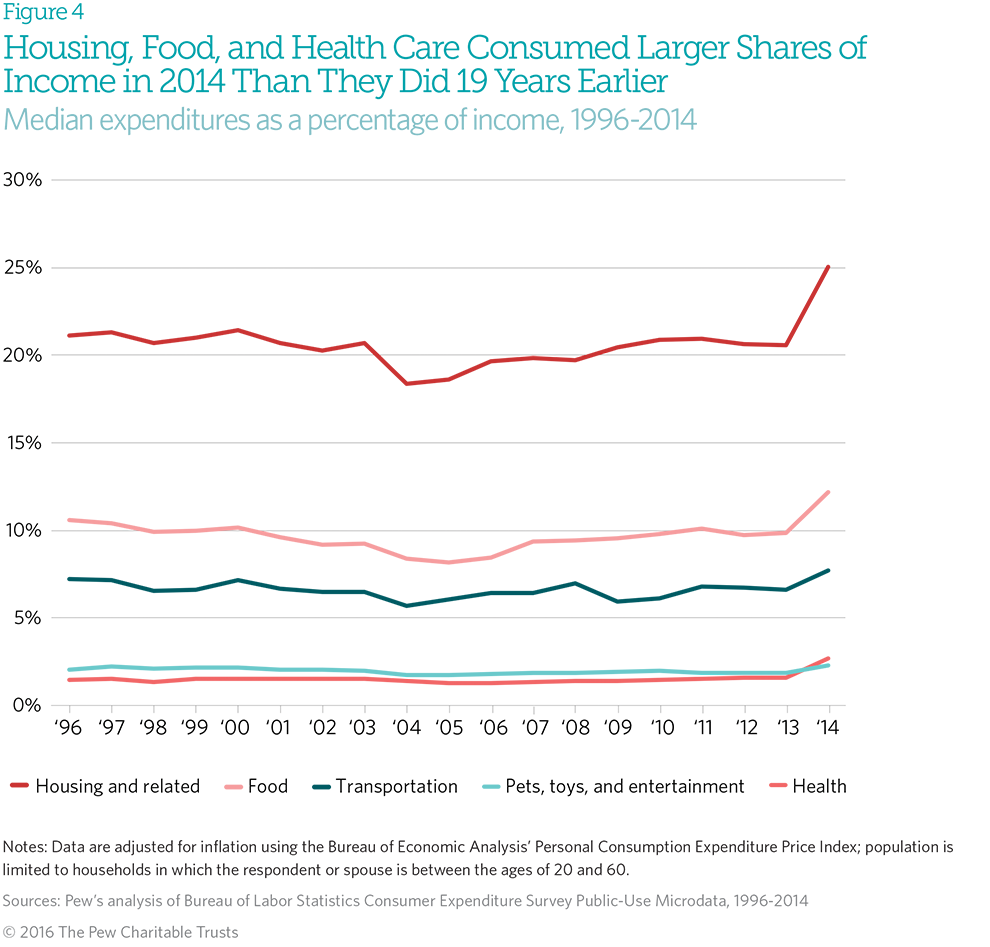
One Third Of U.S. Households Can No Longer Afford Food, Rent And Transportation30 Mar 2016While the Fed has long been focusing on the revenue part of the household income statement (which unfortunately has not been rising nearly fast enough to stimulate benign inflation in the form of nominal wages rising at the Fed's preferred clip of 3.5% or higher), one largely ignored aspect of said balance sheet has been the expense side: after all, for any money to be left over and saved, income has to surpass expenses. However, according to a striking new Pew study while household spending has returned to pre-recession levels (the average household spent $36,800 in 2014) incomes have not. Specifically, while the median income had fallen by 13% from 2004 levels over the next decade, expenditures had increased by nearly 14%. But nobody was more impacted than the one-third of households which the study defines as "low-income." Pew finds that while all households had less slack in their budgets in 2014 than in 2004, lower-income households went into the red by over $2,300. In other words, approximately one third of American households were no longer able to cover the core necessities - food, housing and transportation - with average income. According to Pew, households spent more in 2014 than they did in 1996, after adjusting for inflation; this holds whether the figures are based on averages (means) or medians. The typical household saw its expenditures grow by more than 25 percent, from $29,400 in 1996 to $36,800 in 2014. Mean expenditures grew 27 percent since 1996, rising from $43,200 to $54,800.
The problem is that incomes have not kept up: from 2004 to 2008, median household income grew by only 1.5 percent, while median expenditures increased by about 11 percent. During that period, the expenditure-to-income ratio (the percentage of a household’s budget used for spending) jumped by 9 percent. As the recovery began, median household expenditures returned to pre-crisis levels, but median household income continued to contract. By 2014, median income had fallen by 13 percent from 2004 levels, while expenditures had increased by nearly 14 percent. This change in the expenditure-to-income ratio in the years following the financial crisis is a clear indication of why and how households feel financially strained.
Worse, as the chart below shows, in 2004, typical households at the bottom had $1,500 of income left over after expenses. By 2014, this figure had decreased by $3,800, putting them $2,300 in the red. As Pew notes, "the lack of financial flexibility threatens low-income households’ financial security in the short term and their economic mobility in the long term", and as we would add, this makes them effective wards of the state to be manipulated by demagogue politicians with promises of free handouts. But perhaps worst of all is that typical U.S. households in the center of the income distribution range, aka America's true middle class, have seen their income after meeting all expenses (aka leftover savings) plunge from $17,000 in real terms a decade ago to a paltry $6,000 as of 2014, a plunge of 65%!
What was the reason for this big drop in residual income and jump in expenses? According to Erin Currier, project director at Pew Charitable Trusts, "over time, [lower-income groups] consistently spend more on transportation and considerably more on housing." However, the biggest culprit by far, are soaring rental costs: "Lower income renters are spending nearly half their income on rent, while upper-income groups spend about 15% on rent. The disparity really shows that lower income families don’t have much slack in their budgets for mobility-enhancing investments like savings and wealth building."
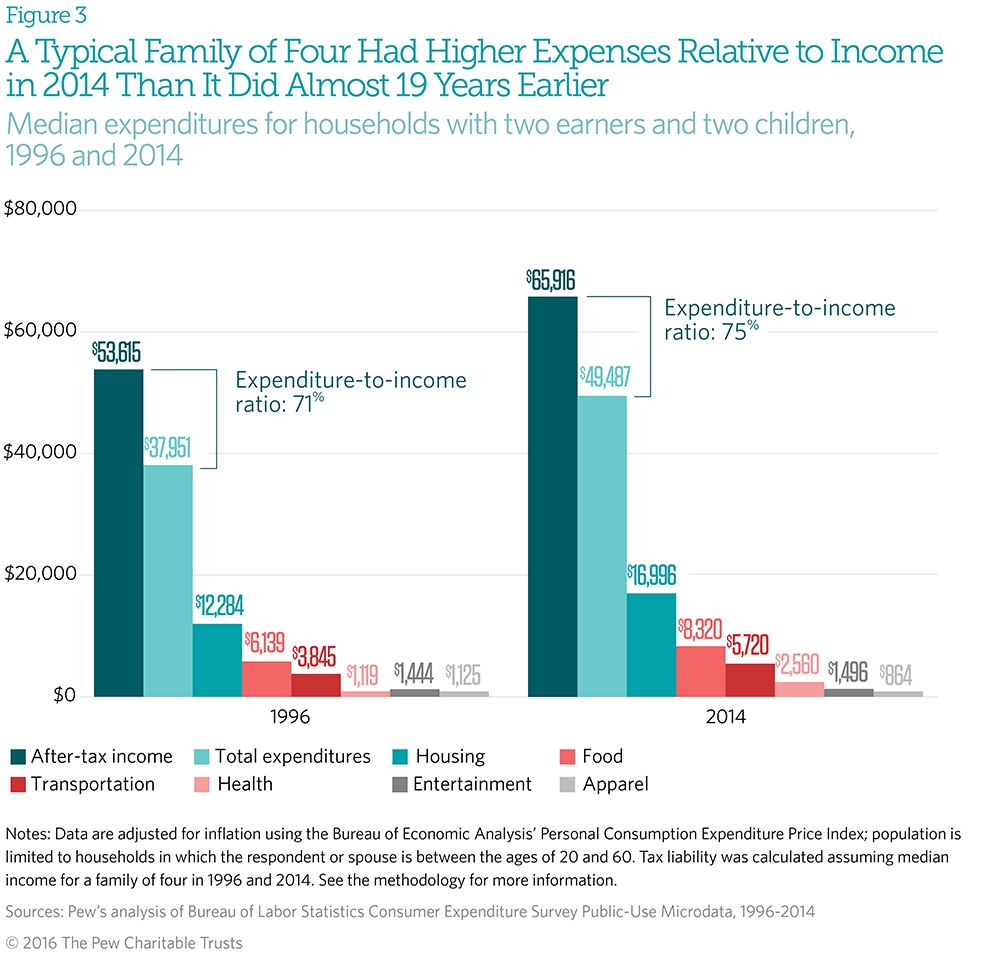
What is particularly notable is the substantial jump in median expenditures in just 2014. This was mostly due to an odd spike in rents: For a typical family of four (two earners and two children), while median household income increased by about $10,000 between 1996 and 2014, annual expenditures also increased by about the same amount, driven largely by higher spending for core needs: housing, food, and transportation. Although the absolute change in income and expenditures was similar, this family had less slack in its budget in 2014 than in 1996, as its expenditure-to-income ratio grew from 71 percent to 75 percent.
The reason for record high asking rents has been extensively covered here before; here is Pew's take:
This, together with our previous report that increasingly more US households are unable to afford to purchase a home, should put to rest any speculation whether those who point out the chronic deterioration of the economy for everyone, not just the 1% who truly are doing better than ever, are "peddling fiction." Pew's conclusion confirms just that.
One final note: in the paragraph above replace "slack" with "savings" for an accurate description of what is going on. Source: Pew Trusts |
|||
III-FINANCIAL |
|||
|
FLOWS - Capital, Liqudity & Credit Flows
|
MATA RISK ON-OFF |
THEME |
w/ R Duncan |
| CRACKUP BOOM - ASSET BUBBLE | 12-31-15 | THEME | |
| SHADOW BANKING - LIQUIDITY / CREDIT ENGINE | M | THEME | |
| GENERAL INTEREST |
|
||
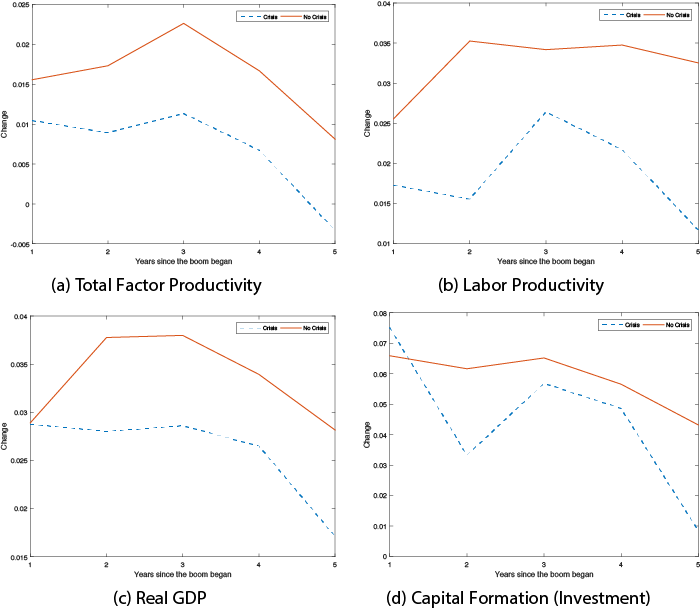
Good booms, bad booms: Why only some credit booms end in a crisis Gary B. Gorton, Guillermo L. Ordoñez 27 March 2016 Credit booms are not rare and usually precede financial crises. However, some end in a crisis while others do not. This column argues that credit booms start with an increase in productivity, which subsequently falls much faster during ‘bad booms’. When this decline is severe enough, it changes the informational regime in credit markets, leading to a drying up of credit. A crisis may be the result of an exhausted credit boom and not necessarily of a negative productivity shock. Financial crises pose challenges for macroeconomists. Schularick and Taylor (2012) show that credit booms precede crises. Mendoza and Terrones (2008) claim that not all credit booms end in crises. Herrera et al. (2014) argue that crises are not necessarily the result of large negative shocks, but also of political considerations. There is a need for models displaying financial crises that are preceded by credit booms and that are not necessarily the result of large negative shocks. In a recent paper (Gorton and Ordonez 2016), we show that credit booms are indeed not rare, that some end in crises (bad booms) but others do not (good booms). Are these two types of booms intrinsically different in their evolution, or do they just differ in how they end? We show that all credit booms start with a positive shock to productivity on average ten years before the end of the boom, but that in bad booms this increase dies off rather quickly while this is not the case for good booms. This suggests that a crisis is the result of an exhausted credit boom. We then develop a simple framework that rationalises these empirical findings and highlight several shortcomings of standard macroeconomic models that tend to neglect the interplay between macroeconomic and financial variables. Our finding: Productivity dies off faster during bad boomsWe study a sample of 34 countries (17 advanced countries and 17 emerging markets) over a 50-year time span (1960-2010). We define a credit boom as starting whenever a country experiences at least three consecutive years of positive growth in credit over GDP that averages more than 5%, and ending whenever the country experiences at least two years of no credit growth. Once we have identified credit booms, we classify them into bad (or good) depending on whether or not they are accompanied by a financial crisis (defined as in Laeven and Valencia 2012) in a neighbourhood of two years of the end of the boom. We identify 87 credit booms in our sample, 34 of which are bad booms. To study whether these two types of boom are fundamentally different we compare the evolution that total factor productivity and labour productivity experience. Figure 1 shows the average growth of these two productivity variables during the first five years of good booms (solid red) and bad booms (dashed blue). While on average all credit booms start with a positive shock to productivity, in bad booms this shock is smaller and tends to die off faster. Figure 1. Average productivity over good and bad booms
We show with a regression analysis that the different patterns between good booms and bad booms that are evident in Figure 1 are both statistically and economically significant. We find that, conditional on being in a boom, an increase of one standard deviation in total factor productivity reduces the probability of being in a bad boom (a boom that will end in a crisis) by 6%. We also show that, as is consistent with previous literature, a lagged increase in credit growth predicts crises but a lagged productivity decline does not. These results suggest that the evolution of productivity at the beginnings of the credit boom that precedes a crisis is more relevant that the evolution of productivity just prior to the crisis. Our definition of a boom is purposefully agnostic as we do not want to impose any structure on booms, since there is no theory to guide us. We prefer to let the data inform us. When we follow the standard practice of de-trending credit growth before defining the boom, we find fewer and shorter booms because most of a boom arbitrarily is pushed into the trend. A regression analysis based on this ‘more standard’ definition of booms shows no difference in productivity between good booms and bad booms, confirming that we are losing relevant information by de-trending. While macroeconomics is plagued with models that explain financial crises as the result of large negative productivity shocks, our results suggest that crises should be studied at lower frequency than usual and that we need a comprehensive model that combines the endogenous evolution of macroeconomic variables with the generation of crises without resorting necessarily on large contemporaneous shocks. Financial crises are not (necessarily) triggered by contemporaneous shocksWe propose a model, motivated by an earlier paper of ours (Gorton and Ordonez 2014), in which financial crises are defined by credit markets operating under a different information regime. Firms finance projects with short-term collateralised debt. Lenders can, at a cost, privately learn the quality of the collateral, but it is not always optimal to do this, in particular when the loan is financing projects that are productive and not very likely to default. If collateral is not examined for a while there is a depreciation of information about its quality such that more and more assets can be successfully used as collateral over time. This induces a credit boom in which more and more firms obtain financing and gradually adopt new projects. If there are decreasing returns such that the quality of the marginal project that is financed declines with the total level of economic activity, there is a link between the credit boom and productivity in the economy. As credit booms evolve, the average productivity in the economy declines and lenders have more and more incentives to acquire information about the collateral backing the loan. If at some point the average productivity of the economy decays enough, there is a change of the information regime in credit markets that leads to the examination of the collateral; some firms that used to obtain loans cannot obtain them anymore and output goes down, i.e. a crisis. Immediately after the crash happens, fewer firms operate, average productivity improves and the process restarts, i.e. an endogenous credit cycle, with a series of bad booms that are not triggered by any contemporaneous fundamental shock. In our model it is the trend of productivity and not its cyclical component that determines the cyclical properties of the economy. This is in contrast with most of the standard literature on real business cycles, a low frequency theory of crises. We also show that if the new technology keeps improving over time, as the credit boom evolves, the endogenous decline in average productivity may be compensated for by an exogenous improvement in the quality of projects such that the change of the information regime is never triggered. If this is the case, the credit boom would end, but not in a crisis, i.e. a good boom. In our setting productivity has two components: the probability that a project succeeds, and the productivity conditional on success. While most of the macroeconomic literature implicitly assumes that firms always succeed and focuses on the second component, we explicitly differentiate between the two. We show that the first component critically affects debt markets, while the second is more relevant for equity markets. While the macroeconomic literature has focused exclusively on the later, we show the relevance of the former to understand crises Concluding remarksOur empirical findings suggest that viewing aggregate fluctuations as deviations from a trend is too stark (see Lucas 1977). As far as fluctuations that involve financial crises are concerned, changes in the trend of technological change, credit booms and crises are intimately related. Financial crises are not necessarily the result of negative productivity shocks around the trend, but the trend itself determines the likelihood of crises and the cyclical properties of the economy. Cyclical dynamics originate at a lower frequency than typically understood. ReferencesGorton, G, and G Ordonez (2014), “Collateral Crises”, American Economic Review 104 (2): 343–378. Gorton, G, and G Ordonez (2016), “Good Booms, Bad Booms”, NBER Working Paper 22008. Herrera, H, G Ordonez and C Trebesch (2014), “Political Booms, Financial Crises”, NBER Working Paper 20346. Lucas, R E (1977), “Understanding Business Cycles”, in K Brunner and A Meltzer (eds.) Stabilization of the Domestic and International Economy volume 5, 7–29, Amsterdam: North-Holland. Mendoza, E, and M Terrones (2008), “An Anatomy of Credit Booms: Evidence from Macro Aggregates and Micro Data”, NBER Working Paper 14049. Schularick, M, and A Taylor (2012), “Credit Booms Gone Bust: Monetary Policy, Leverage Cycles and Financial Cycles, 1870-2008”, American Economic Review 102 (2): 1029–1061. |
|||
Weak Productivity Growth:Don’t Blame The StatisticiansMarch 30, 2016 by bca research
There is little evidence to suggest that the decline in productivity growth in the U.S. and many other countries in recent years is the result of measurement error. While the mismeasurement problem in the IT hardware industry has likely intensified over the past 10 years, this has been offset by the relative decline in the size of that sector. The unmeasured utility accruing from free internet services is large, but so was the unmeasured utility from antibiotics, indoor plumbing, and air conditioning. The real reason that productivity growth has slowed is that businesses have plucked many of the low-hanging fruits made possible by the IT revolution. Cyclical factors stemming from the Great Recession have also weighed on productivity.B Businesses have plucked many of the low-hanging fruits made possible by the IT revolution Low productivity growth tends to be deflationary in the short run, but inflationary in the long run. For now, this is good news for bonds, but is likely to become bad news by the end of the decade. Subpar productivity gains could dampen investor sentiment and reduce the growth of economy-wide business profits. However, to the extent that the productivity slowdown is due to diminished “creative destruction”, this could favor firms that already dominate stock market indices. A Decline In Productivity Growth Is Deflationary In The Short Run,But Inflationary In The Long Run To access the Special Report entitled “Weak Productivity Growth: Don’t Blame The Statisticians”, please click here. |
|||
| STRATEGIC INVESTMENT INSIGHTS - Weekend Coverage | |||
|
|||
|
SII | ||
|
SII | ||
|
SII | ||
|
SII | ||
| TO TOP | |||


Read More - OUR RESEARCH - Articles Below

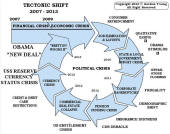
Tipping Points Life Cycle - Explained
Click on image to enlarge
TO TOP
 |
YOUR SOURCE FOR THE LATEST THINKING & RESEARCH
|
�
TO TOP