|
JOHN RUBINO'SLATEST BOOK |
||||||||||||||||||||||||||||||||||||||||||||||||||||||||||||||||||||||||||||||||||||||||||||||||||||||||||||||||||||||||||||||||||||||||||||||||||||||||||||||||||||||||||||||||||||||||||||||||||||||||||||||||||||||||||||||||||||||||||||||||||||||||||||||||||||||||||||||||||||||
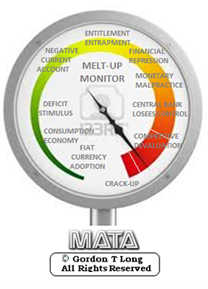
"MELT-UP MONITOR "
Meltup Monitor: FLOWS - The Currency Cartel Carry Cycle - 09 Dec 2013 Meltup Monitor: FLOWS - Liquidity, Credit & Debt - 04 Dec 2013 Meltup Monitor: Euro Pressure Going Critical - 28- Nov 2013 Meltup Monitor: A Regression-to-the-Exponential Mean Required - 25 Nov 2013
|

![]()
"DOW 20,000 "
Lance Roberts Charles Hugh Smith John Rubino Bert Dohman & Ty Andros
|

HELD OVER
Currency Wars
Euro Experiment
Sultans of Swap
Extend & Pretend
Preserve & Protect
Innovation
Showings Below
"Currency Wars "
|


"SULTANS OF SWAP" archives open ACT II ACT III
ALSO Sultans of Swap: Fearing the Gearing! Sultans of Swap: BP Potentially More Devistating than Lehman! |

"EURO EXPERIMENT"
archives open EURO EXPERIMENT : ECB's LTRO Won't Stop Collateral Contagion!
EURO EXPERIMENT: |

![]()
"INNOVATION"
archives open |

"PRESERVE & PROTE CT"
archives open |

Wed. Nov 4th, 2015
Follow Our Updates
onTWITTER
https://twitter.com/GordonTLong
AND FOR EVEN MORE TWITTER COVERAGE
ARCHIVES
| OCTOBER | ||||||
| S | M | T | W | T | F | S |
| 1 | 2 | 3 | ||||
| 4 | 5 | 6 | 7 | 8 | 9 | 10 |
| 11 | 12 | 13 | 14 | 15 | 16 | 17 |
| 18 | 19 | 20 | 21 | 22 | 23 | 24 |
| 25 | 26 | 27 | 28 | 29 | 30 | 31 |
| 1 | 2 | 3 | 4 | 5 | 6 | 7 |
KEY TO TIPPING POINTS |
| 1- Bond Bubble |
| 2 - Risk Reversal |
| 3 - Geo-Political Event |
| 4 - China Hard Landing |
| 5 - Japan Debt Deflation Spiral |
| 6- EU Banking Crisis |
| 7- Sovereign Debt Crisis |
| 8 - Shrinking Revenue Growth Rate |
| 9 - Chronic Unemployment |
| 10 - US Stock Market Valuations |
| 11 - Global Governance Failure |
| 12 - Chronic Global Fiscal ImBalances |
| 13 - Growing Social Unrest |
| 14 - Residential Real Estate - Phase II |
| 15 - Commercial Real Estate |
| 16 - Credit Contraction II |
| 17- State & Local Government |
| 18 - Slowing Retail & Consumer Sales |
| 19 - US Reserve Currency |
| 20 - US Dollar Weakness |
| 21 - Financial Crisis Programs Expiration |
| 22 - US Banking Crisis II |
| 23 - China - Japan Regional Conflict |
| 24 - Corruption |
| 25 - Public Sentiment & Confidence |
| 26 - Food Price Pressures |
| 27 - Global Output Gap |
| 28 - Pension - Entitlement Crisis |
| 29 - Central & Eastern Europe |
| 30 - Terrorist Event |
| 31 - Pandemic / Epidemic |
| 32 - Rising Inflation Pressures & Interest Pressures |
| 33 - Resource Shortage |
| 34 - Cyber Attack or Complexity Failure |
| 35 - Corporate Bankruptcies |
| 36 - Iran Nuclear Threat |
| 37- Finance & Insurance Balance Sheet Write-Offs |
| 38- Government Backstop Insurance |
| 39 - Oil Price Pressures |
| 40 - Natural Physical Disaster |
Reading the right books?
No Time?
We have analyzed & included
these in our latest research papers Macro videos!
OUR MACRO ANALYTIC
CO-HOSTS
John Rubino's Just Released Book
Charles Hugh Smith's Latest Books


Our Macro Watch Partner
Richard Duncan Latest Books
MACRO ANALYTIC
GUESTS
F William Engdahl


OTHERS OF NOTE
Book Review- Five Thumbs Up
for Steve Greenhut's Plunder!


![]()
TODAY'S TIPPING POINTS
|
Have your own site? Offer free content to your visitors with TRIGGER$ Public Edition!
Sell TRIGGER$ from your site and grow a monthly recurring income!
Contact [email protected] for more information - (free ad space for participating affiliates).
HOTTEST TIPPING POINTS |
Theme Groupings |
||
We post throughout the day as we do our Investment Research for: LONGWave - UnderTheLens - Macro
|
|||
|
MOST CRITICAL TIPPING POINT ARTICLES TODAY
|
|
||
| Market - WEDNESDAY STUDIES | |||
| TECHNICALS & MARKET |
|
||
| STUDIES - MACRO pdf | |||
Q3 EARNINGS SEASON |
11-04-15 | STUDIES | |
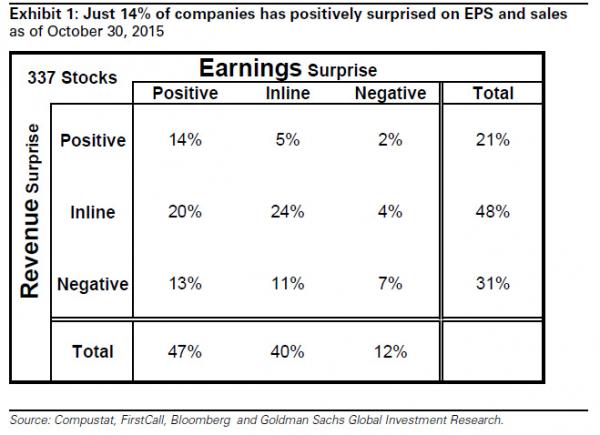
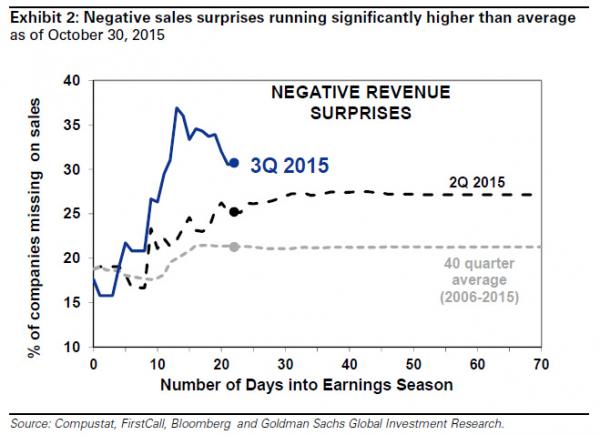
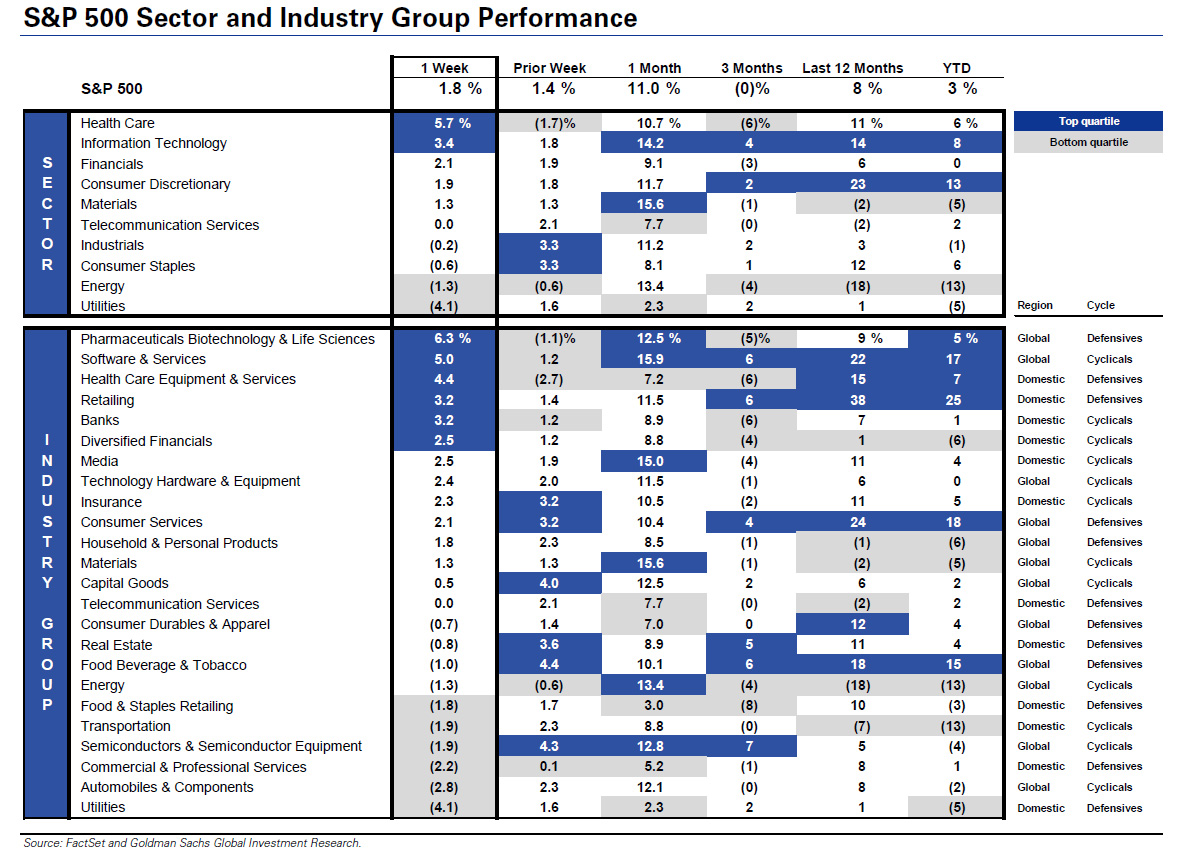
Submitted by Tyler Durden on 10/31/2015 Goldman's 4 Word Summary Of Q3 Earnings Season: "Adequate Earnings, Dismal Sales"Haven't bothered to check in on the third quarter earnings season (which at this rate will mark the first two back-to-back quarters of earnings declines since 2009, aka an earnings recession)? Then here is the 4 word summary from Goldman Sachs: "adequate earnings, dismal sales."
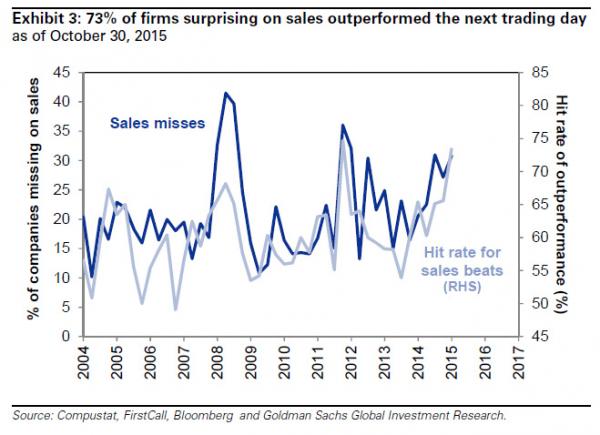
If companies beat on earnings do they also beat on revenues?
So as corporate teams seek to push margins even higher in the coming quarters, there will be even more layoffs in the coming quarters, and even more disappointing employment numbers... which is great news for a "lower for longer" addicted market. What is the cause of the ongoing revenue slowdown, aside from lack of capital investment of course? The strong dollar is the biggest culprit, a dollar which keeps getting stronger.
For those wondering if the weak top line number means a slowing economy, the answer is yes.
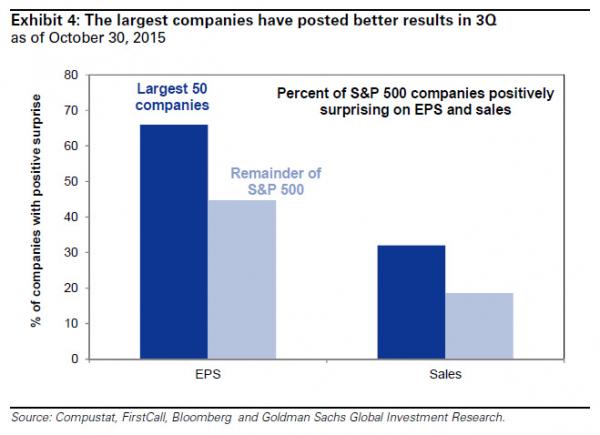
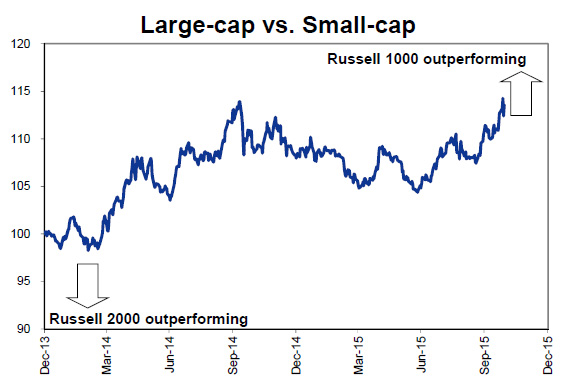
It's not bad news for all though: the biggest companies will survive and will likely get even bigger.
... something the market has noticed and rewarded.
Finally here is the full sector and industry performance broken down in various periods:
* * * Finally, this is where Goldman sees the S&P trading in 1 year: "We expect the S&P 500 will likely trade at 2075 in 12 months (-0.7%).
|
|||
| MOST CRITICAL TIPPING POINT ARTICLES THIS WEEK - Nov. 1st, 2015 - Nov 7th, 2015 | |||
| BOND BUBBLE | 1 | ||
| RISK REVERSAL - WOULD BE MARKED BY: Slowing Momentum, Weakening Earnings, Falling Estimates | 2 | ||
| RISK REVERSAL - WOULD BE MARKED BY: Slowing Momentum, Weakening Earnings, Falling Estimates | 10-29-15 | GLOBAL RISK SIGNALS | 2 |
| GEO-POLITICAL EVENT | 3 | ||
| CHINA BUBBLE | 4 | ||
| CHINA BUBBLE | 4 | ||
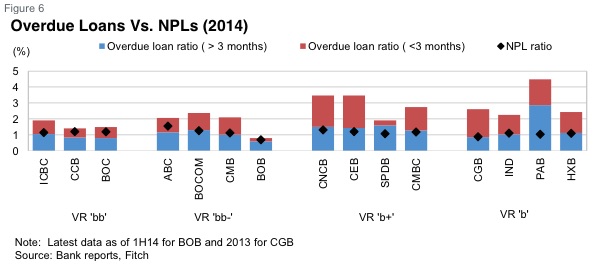
One Analyst Says China's Banking Sector Is Sitting On A $3 Trillion Neutron BombTue, 03 Nov 2015To be sure, we’ve long contended that official data on bad loans at Chinese banks is even less reliable than NBS GDP prints. Indeed, the lengths Beijing goes to in order to obscure the extent to which banks’ balance sheets are in peril is truly something to behold and much like the deficient deflator math which may be causing the country to habitually overstate GDP growth, it’s not even clear that China could report the real numbers if it wanted to. We took an in-depth look at the problem in “How China's Banks Hide Trillions In Credit Risk: Full Frontal”, and we’ve revisited the issue on a number of occasions noting in August that according to a transcript of an internal meeting of the China Banking Regulatory Commission, bad loans jumped CNY322.2 billion in H1 to CNY1.8 trillion, a 36% increase. Of course that’s just the tip of the iceberg. In other words, that comes from a government agency and although the scope of the increase sounds serious, it still translates into an NPL ratio of just 1.82%. Here’s a look at the “official” numbers (note that when one includes doubtful accounts, the ratio jumps to somewhere in the neighborhood of 3-4%):
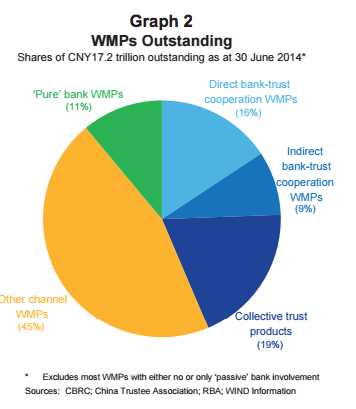
Source: Fitch There are any number of reasons why those figures don’t even come close to approximating reality. For instance, there’s Beijing’s habit of compelling banks to roll over bad loans, and then there’s China’s massive (and by “massive” we mean CNY17 trillion) wealth management product industry which, when coupled with some creative accounting, allows Chinese banks to hold some 40% of credit risk off balance sheet.
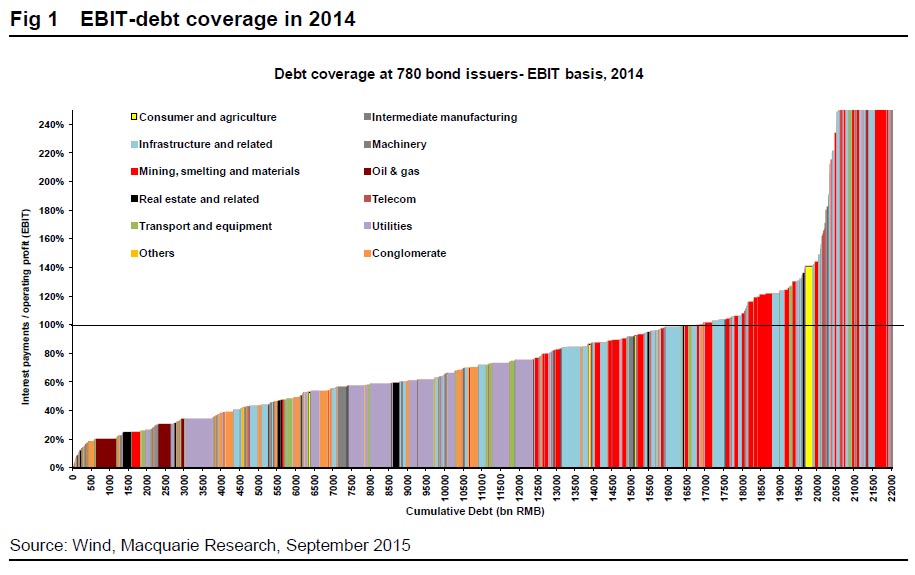
Well as time goes on, and as market participants scrutinize the data coming out of the world’s second most important economy, quite a few analysts are beginning to take a closer look at the NPL data for Chinese banks. Indeed, if Beijing continues to move toward “allowing” defaults to occur (even at SOEs) and if China’s transition from smokestack economy to a consumption and services-driven model continues to put pressure on borrowers from the manufacturing sector, the situation is likely to deteriorate quickly. If you needed evidence of just how precarious things truly are, look no further than a recent report from Macquarie which showed that a quarter of Chinese firms with debt are currently unable to cover their annual interest expense (as you might imagine, it's even worse for commodities firms).
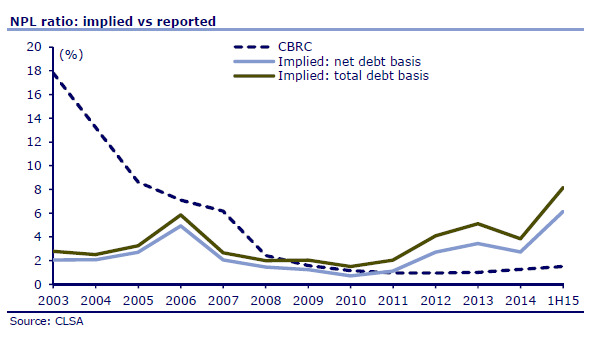
Just two weeks after we highighted the Macquarie report, we took a look at research conducted by Hong-Kong based CLSA. Unsurprisingly, it turns out that Chinese banks' bad debts ratio could be as high 8.1%, a whopping 6 times higher than the official 1.5% NPL level reported by China's banking regulator.
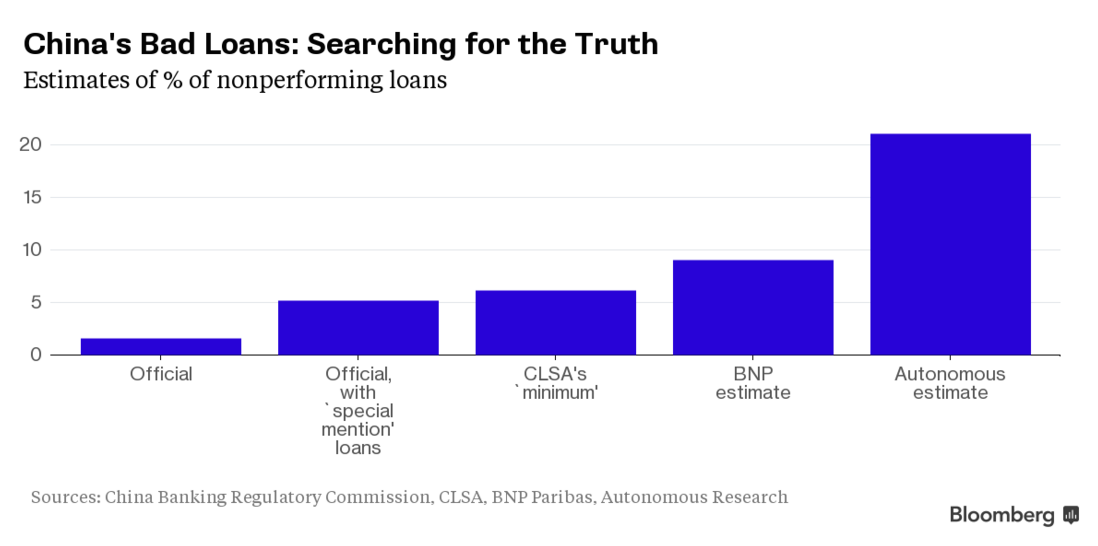
We called that revelation China's "neutron bomb" but it turns out we may have jumped the gun. According to Hong Kong-based "Autonomous Research", the real figure may be closer to 21% when one takes into account the aforementioned shadow banking sector. Here's more from Bloomberg:
As a reminder, here's a look at the scope of the "problem" Chu is describing:
And here's a bit more on special mention loans and the ubiquitous practice of "evergreening":
So let's just be clear: if 8% is a "neutron bomb", a 21% NPL ratio in China is the asteroid that killed the dinosaurs. Here's why:
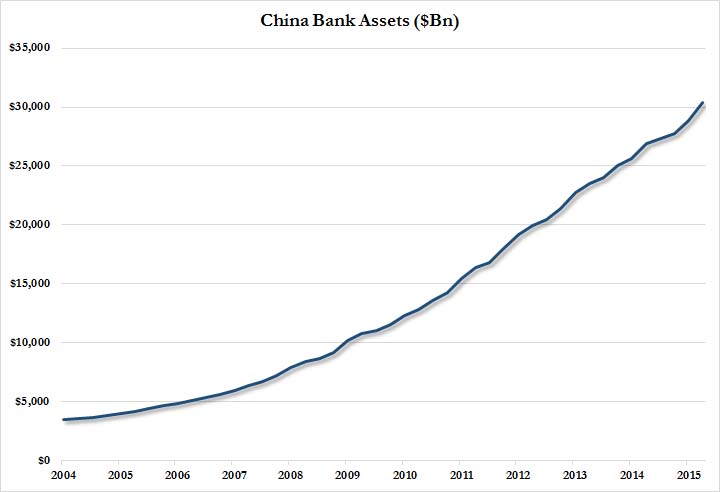
If one very conservatively assumes that loans are about half of the total asset base (realistically 60-70%), and applies an 20% NPL to this number instead of the official 1.5% NPL estimate, the capital shortfall is a staggering $3 trillion. That, as we suggested three weeks ago, may help to explain why round after round of liquidity injections (via RRR cuts, LTROs, and various short- and medium-term financing ops) haven't done much to boost the credit impulse. In short, banks may be quietly soaking up the funds not to lend them out, but to plug a giant, $3 trillion, solvency shortfall. In the end, we would actually venture to suggest that the real figure is probably far higher than 20%. There's no way to get a read on how the country's vast shadow banking complex plays into this but when you look at the numbers, it's almost inconceivable to imagine that banks aren't staring down sour loans at least on the order of a couple of trillion. To the PBoC we say, "good luck plugging that gap" and to the rest of the world we say "beware, the engine of global growth and trade may be facing a pile of bad loans the size of Germany's GDP." We close with the following from Kroll's senior managing director in Hong Kong Violet Ho (quoted above):
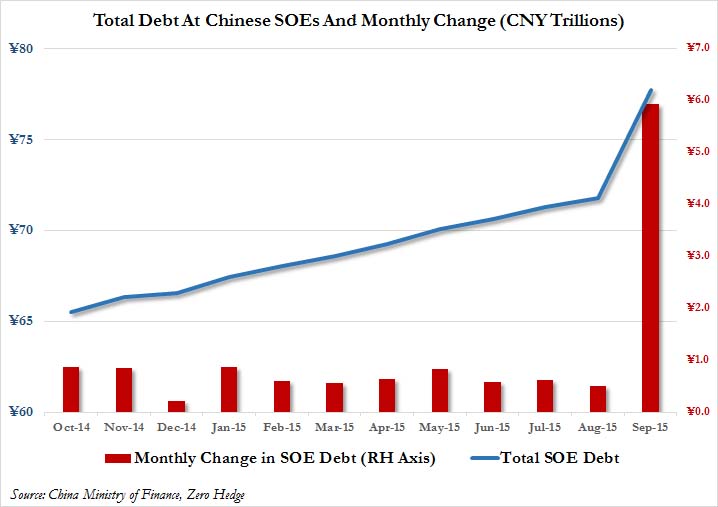
Did Something Just Snap In China: Total SOE Debt Rises By $1 Trillion In One MonthTue, 03 Nov 2015We found something unexpected when skimming through the website of China's finance ministry. While most China pundits keep close track of China's monthly loan creation and, especially these days, its Total Social Financing number to get a sense of what, if any, credit is being created outside of conventional lending channels within China's shadow banking system, one just as critical please to keep track of Chinese credit is the monthly report on national state-owned and state holding enterprises. Such as this one from October 22, which reports that as of September 30, total liabilities of state-owned enterprises had risen to 77.7 trillion yuan. Why is this notable? Because the monthly update just preceding it,reported a total debt figure of "only" 71.8 trillion yuan: a whopping increase of almost CNY 6 trillion, or USD $1 trillion, in just one month. This is the biggest monthly increase by a massive margin among China's SOE by orders of magnitude, and yet just to get a sense of the magnitude of debt held at China's SOEs, even this record monthly increase is not even 10% of the total debt held by China's state-owned enterprises which stood at CNY78 trillion or USD $12 trillion at the end of September, more than the total Chinese GDP.
What can explain this snap? There has been very little commentary on this particular surge aside from a report posted on Wall Street.cn, and translated by Chiecon, which reports the following:
Ironically, "shifting" the debt - no matter how troubling - would be by far the more palatable explanation. Because if somehow China had quietly "created" $1 trillion in debt out of thin air parked subsequently on SOE balance sheets, that would suggest that things in China are orders of magnitude worse than anyone can possibly imagine. Still, if China did not create this debt now, it will eventually:
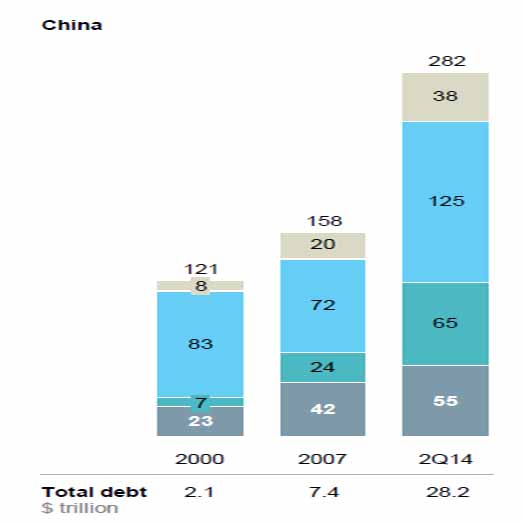
It's low? Really? Because according to the following McKinsey chart total Chinese debt was $28.2 trillion as of Q2 2014 (it has since risen well over $30 trillion), and represents nearly 300% debt/GDP.
But there is another implication. If China's is indeed merely stuffing government debt on SOE balance sheets as the report suggests...
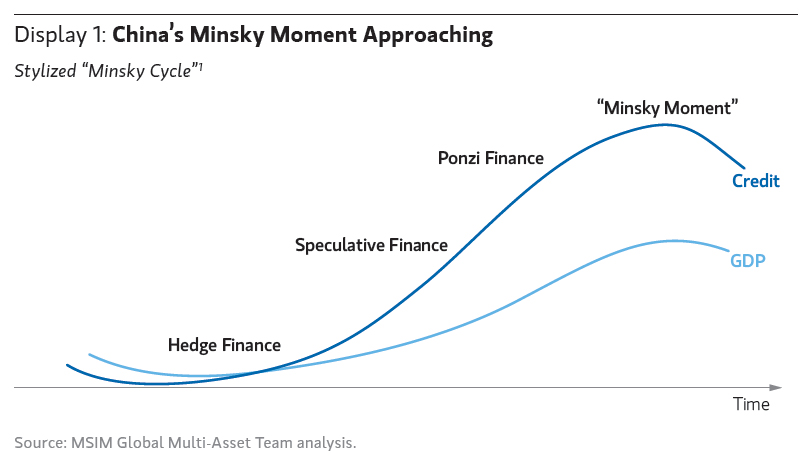
... then China, while ultimately having to engage in QE, will last out the current regime as long as possible, offloading government debt in ever greater amounts to SOE until finally their debt capacity is maxed out. Then, and only then, will China unleash the world's last remaining debt monetization episode, whereby the PBOC will proceed to openly monetize the roughly $3-4 trillion in total debt China creates every year. At that point the "Minsky Moment" of not only China, but the entire world, will have arrived.
|
|||
| JAPAN - DEBT DEFLATION | 5 | ||
EU BANKING CRISIS |
6 |
||
| TO TOP | |||
| MACRO News Items of Importance - This Week | |||
GLOBAL MACRO REPORTS & ANALYSIS |
|||
US ECONOMIC REPORTS & ANALYSIS |
|||
| CENTRAL BANKING MONETARY POLICIES, ACTIONS & ACTIVITIES | |||
| Market | |||
| TECHNICALS & MARKET |
|
||
| COMMODITY CORNER - AGRI-COMPLEX | PORTFOLIO | ||
| SECURITY-SURVEILANCE COMPLEX | PORTFOLIO | ||
| THESIS - Mondays Posts on Financial Repression & Posts on Thursday as Key Updates Occur | |||
| 2015 - FIDUCIARY FAILURE | 2015 | THESIS 2015 |  |
| 2014 - GLOBALIZATION TRAP | 2014 |  |
|
 |
|||
|
2013 2014 |
 |
||
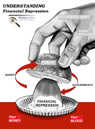
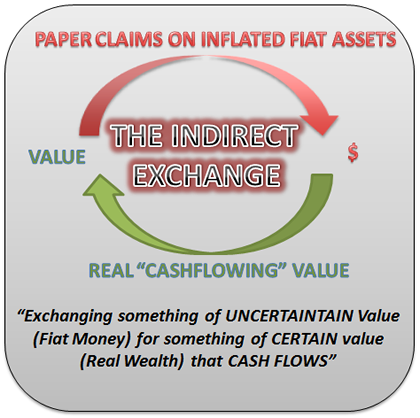
FINANCIAL REPRESSION THE AUSTRIAN SCHOOL OF ECONOMICS USES THE "INDIRECT EXCHANGE" TO CAPTURE REAL WEALTH Ty Andros, Editor of Tedbits and Austrianism Purist FRA Co-Founder Gordon T. Long deliberates the Austrian School of Economics with Ty Andros of Tedbits Newsletter. Ty Andros began his commodity career in the early 1980's and became a managed futures specialist beginning in 1985.Mr. Andros attended the University of San Diego, and the University of Miami, majoring in Marketing, Economics and Business Administration. Mr. Andros is active in Economic analysis and brings this information and analysis to his clients on a regular basis. WHAT IS AUSTRIAN ECONOMICS? “Austrian economics is just human behaviour, and common sense, and history.” “But what’s happening is human behaviour, nonsense, and history. We are at a period where people have forgotten history and are doomed to repeat it. “ “Austrian school and capitalism are one in the same.” “Austrian Economics is production of wealth, producing more than you consume. Meeting people’s needs and doing it in a superior manner; in other words, capitalism.” The historical school, had argued that economic science is incapable of generating universal principles and that scientific research should instead be focused on detailed historical examination. The school thought the English classical economists mistaken in believing in economic laws that transcended time and national boundaries. APPLYING AUSTRIANISM TO INVESTING “You have to prey on paper.” “The only real way the middle class will get to success is going out serving others and getting rewarded for it.” “Austrian school is just history, common sense, and the production of wealth; everything else will flow from there. The reason middle classes cannot rise is somehow the public has gotten the idea that they are going to raise their lifestyle through the stroke of a pen at a central bank or other government bodies.” THE INDIRECT EXCHANGE “In today’s world economic growth is a function of a printing press; consumption presented as production.”
It is a situation in which goods, services, etc. are traded between two countries using the currency of a third country. Real wealth can only be created by growing it, mining it, building it, manufacturing it; being rewarded for providing more goods and services for less to consumers. What we have now is phony capitalism, which is more money for less goods and services, while consumer demand is being mandated by government planning and controlled by central banking. EVENTS TO UNFOLD IN THE UPCOMING YEARS “We are in a death event.” “If you date interest rates going back 600-600 years, we have never once had a scenario where they were kept at zero for 6 years. What we have is a flat line; just like in any medical monitor a flat line is fatal.” “The system is dead, we are just sitting there on the fumes and they can’t relight it because they have outlawed free enterprise capitalism, and wealth creation. Look at the health care system right now, it is just a leviathan. They went in there and wrote Obama Care for themselves and that’s how they became supporters. It was government sanctioned.” “Just look at Japan, we are headed right there.” “The long term the yield curve is going to invert, but it is going to invert near zero. There is no growth, the only growth there is, is just credit creation. To spurt credit creation they have to make it easier for people to borrow so people can miscalculate their returns.” CURRENCY EXTINCTION “Currencies expire when people wake up, the value that currencies hold are only values within people’s minds.” There is absolutely no value in them. As long as they are perceived as having real worth, you can purchase real things; this is the indirect exchange. Money is a store of value because it is not pegged to anything, as long as this allusion is there; we are substituting it to grab a hold of real cash flowing assets. THE LEVERAGE COLLAPSE “The dollar is going down, and it is going to die; but it will be the last to die.” “They really have people thinking that the dollar is a risk free asset, and it is not. It is a worthless junk bond. Currencies don’t float, they just sink at different rates, and the sinking is managed by the BIS and the ECB, Bank of England, Bank of Japan etc. and they all mange the theft of remaining value with their printing presses.” “The financial systems were given the keys to the castle. These economies are not run for the benefit of the entrepreneur; they are run for the benefit of the financiers. It is a game that the central banks have been playing since the 1600’s when the Rothschild’s went after the Bank of England. We are in troubling times and we need to be well informed. If you are an investor and you do it right, it will be the greatest time in history.” “A Depression is incoming and this one will be nasty, in fact it will be the worst one ever.”
Abstract written by Karan Singh [email protected]
|
11-02-15 | THESIS | |
2011 2012 2013 2014 |
 |
||
| THEMES - Normally a Thursday Themes Post & a Friday Flows Post | |||
I - POLITICAL |
|||
| CENTRAL PLANNING - SHIFTING ECONOMIC POWER - STATISM | THEME | ||
- - CORRUPTION & MALFEASANCE - MORAL DECAY - DESPERATION, SHORTAGES. |
THEME |  |
|
| - - SECURITY-SURVEILLANCE COMPLEX - STATISM | M | THEME | |
| - - CATALYSTS - FEAR (POLITICALLY) & GREED (FINANCIALLY) | G | THEME | |
II-ECONOMIC |
|||
| GLOBAL RISK | |||
| - GLOBAL FINANCIAL IMBALANCE - FRAGILITY, COMPLEXITY & INSTABILITY | G | THEME | |
| - - SOCIAL UNREST - INEQUALITY & A BROKEN SOCIAL CONTRACT | US | THEME | |
| - - ECHO BOOM - PERIPHERAL PROBLEM | M | THEME | |
| - -GLOBAL GROWTH & JOBS CRISIS | |||
| - - - PRODUCTIVITY PARADOX - NATURE OF WORK | THEME | MACRO w/ CHS |
|
| - - - STANDARD OF LIVING - EMPLOYMENT CRISIS, SUB-PRIME ECONOMY | US | THEME | MACRO w/ CHS |
| STANDARD OF LIVING - SUB-PRIME ECONOMY | US | THEME | MACRO w/ CHS |
III-FINANCIAL |
|||
| FLOWS -FRIDAY FLOWS | MATA RISK ON-OFF |
THEME |  |
| CRACKUP BOOM - ASSET BUBBLE | THEME | ||
| SHADOW BANKING - LIQUIDITY / CREDIT ENGINE | M | THEME | |
| GENERAL INTEREST |
|
||
| STRATEGIC INVESTMENT INSIGHTS - Weekend Coverage | |||
|
SII | ||
|
SII | ||
|
SII | ||
|
SII | ||
| 10-31-15 | SII | ||
| TO TOP | |||


Read More - OUR RESEARCH - Articles Below

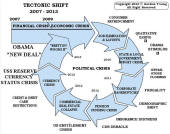
Tipping Points Life Cycle - Explained
Click on image to enlarge
TO TOP
 |
YOUR SOURCE FOR THE LATEST THINKING & RESEARCH
|
�
TO TOP