|
JOHN RUBINO'SLATEST BOOK |
||||||||||||||||||||||||||||||||||||||||||||||||||||||||||||||||||||||||||||||||||||||||||||||||||||||||||||||||||||||||||||||||||||||||||||||||||||||||||||||||||||||||||||||||||||||||||||||||||||||||||||||||||||||||||||||||||||||||||||||||||||||||||||||||||||||||||||||||||||||||||||||||||||||||||||||||||||||||||||||||||||||||||||||||||
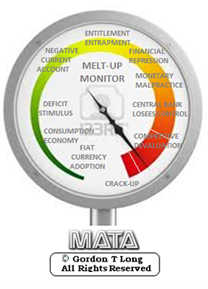
"MELT-UP MONITOR "
Meltup Monitor: FLOWS - The Currency Cartel Carry Cycle - 09 Dec 2013 Meltup Monitor: FLOWS - Liquidity, Credit & Debt - 04 Dec 2013 Meltup Monitor: Euro Pressure Going Critical - 28- Nov 2013 Meltup Monitor: A Regression-to-the-Exponential Mean Required - 25 Nov 2013
|

![]()
"DOW 20,000 "
Lance Roberts Charles Hugh Smith John Rubino Bert Dohman & Ty Andros
|

HELD OVER
Currency Wars
Euro Experiment
Sultans of Swap
Extend & Pretend
Preserve & Protect
Innovation
Showings Below
"Currency Wars "
|


"SULTANS OF SWAP" archives open ACT II ACT III
ALSO Sultans of Swap: Fearing the Gearing! Sultans of Swap: BP Potentially More Devistating than Lehman! |

"EURO EXPERIMENT"
archives open EURO EXPERIMENT : ECB's LTRO Won't Stop Collateral Contagion!
EURO EXPERIMENT: |

![]()
"INNOVATION"
archives open |

"PRESERVE & PROTE CT"
archives open |

Fri. July 3rd, 2015
Follow Our Updates
on TWITTER
https://twitter.com/GordonTLong
AND FOR EVEN MORE TWITTER COVERAGE
![]()
| JUNE | ||||||
| S | M | T | W | T | F | S |
| 1 | 2 | 3 | 4 | 5 | 6 | |
| 7 | 8 | 9 | 10 | 11 | 12 | 13 |
| 14 | 15 | 16 | 17 | 18 | 19 | 20 |
| 21 | 22 | 23 | 24 | 25 | 26 | 27 |
| 28 | 29 | 30 | 1 | 2 | 3 | 4 |
KEY TO TIPPING POINTS |
| 1- Bond Bubble |
| 2 - Risk Reversal |
| 3 - Geo-Political Event |
| 4 - China Hard Landing |
| 5 - Japan Debt Deflation Spiral |
| 6- EU Banking Crisis |
| 7- Sovereign Debt Crisis |
| 8 - Shrinking Revenue Growth Rate |
| 9 - Chronic Unemployment |
| 10 - US Stock Market Valuations |
| 11 - Global Governance Failure |
| 12 - Chronic Global Fiscal ImBalances |
| 13 - Growing Social Unrest |
| 14 - Residential Real Estate - Phase II |
| 15 - Commercial Real Estate |
| 16 - Credit Contraction II |
| 17- State & Local Government |
| 18 - Slowing Retail & Consumer Sales |
| 19 - US Reserve Currency |
| 20 - US Dollar Weakness |
| 21 - Financial Crisis Programs Expiration |
| 22 - US Banking Crisis II |
| 23 - China - Japan Regional Conflict |
| 24 - Corruption |
| 25 - Public Sentiment & Confidence |
| 26 - Food Price Pressures |
| 27 - Global Output Gap |
| 28 - Pension - Entitlement Crisis |
| 29 - Central & Eastern Europe |
| 30 - Terrorist Event |
| 31 - Pandemic / Epidemic |
| 32 - Rising Inflation Pressures & Interest Pressures |
| 33 - Resource Shortage |
| 34 - Cyber Attack or Complexity Failure |
| 35 - Corporate Bankruptcies |
| 36 - Iran Nuclear Threat |
| 37- Finance & Insurance Balance Sheet Write-Offs |
| 38- Government Backstop Insurance |
| 39 - Oil Price Pressures |
| 40 - Natural Physical Disaster |
Reading the right books?
No Time?

We have analyzed & included
these in our latest research papers Macro videos!
![]()
OUR MACRO ANALYTIC
CO-HOSTS
John Rubino's Just Released Book
![]()
Charles Hugh Smith's Latest Books
![]()
![]()
Our Macro Watch Partner
Richard Duncan Latest Books

MACRO ANALYTIC
GUESTS
F William Engdahl

![]()

![]()

![]()

![]()

![]()
OTHERS OF NOTE
![]()
![]()

![]()


![]()
Book Review- Five Thumbs Up
for Steve Greenhut's
Plunder!

![]()
![]()
TODAY'S TIPPING POINTS
|
Have your own site? Offer free content to your visitors with TRIGGER$ Public Edition!
Sell TRIGGER$ from your site and grow a monthly recurring income!
Contact [email protected] for more information - (free ad space for participating affiliates).
HOTTEST TIPPING POINTS |
Theme Groupings |
||
We post throughout the day as we do our Investment Research for: LONGWave - UnderTheLens - Macro
|
|||
TIPPING POINTS |
|||
|
|||
FLOWS - Liquidity, Credit & Debt |
07-03-15 | THEMES | FLOWS |
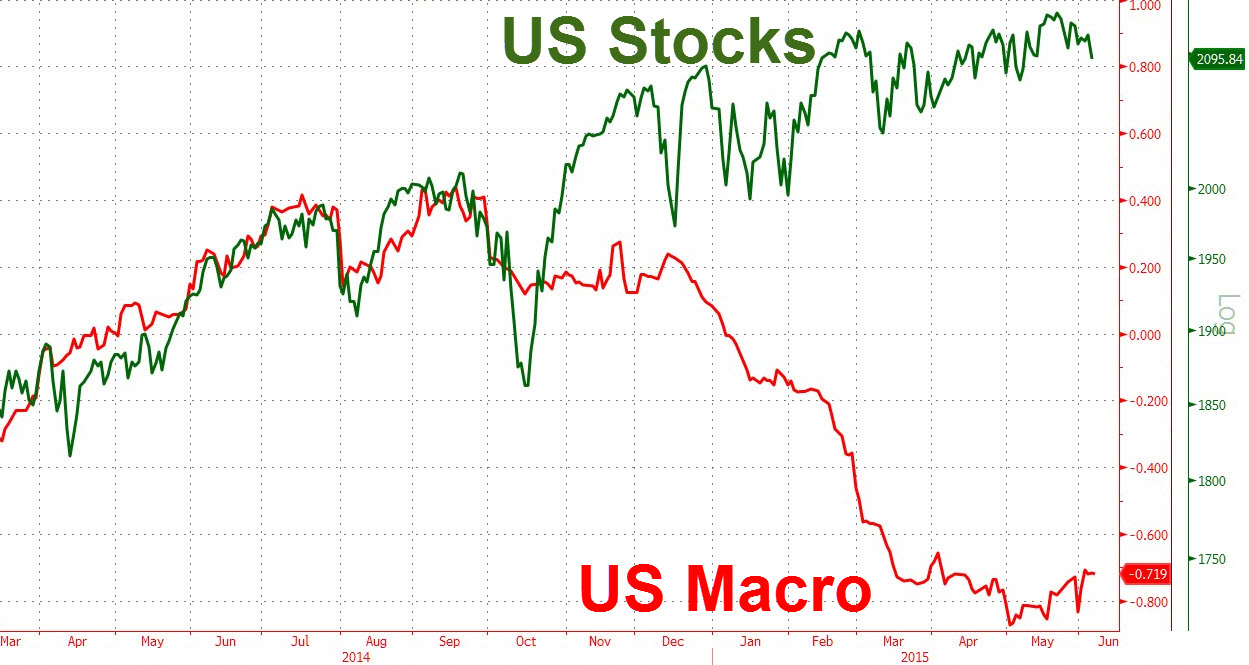
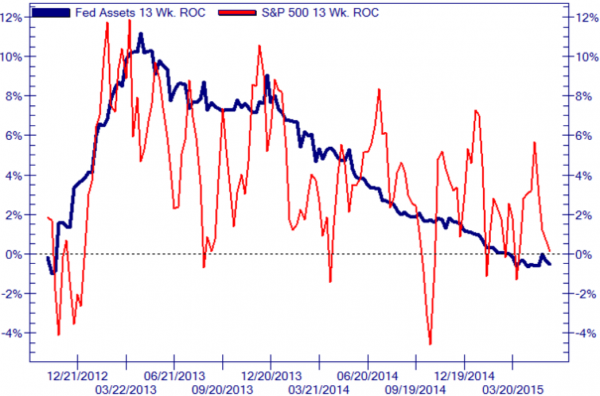
Submitted by Tyler Durden on 06/05/2015 13:35 -0400 It's Not The Economy, Stupid, It's The FlowBy now it should be clear, without the flow of Federal Reserve funny money, the wedge between the reality of collapsing macro- and micro-fundamentals and ever-expanding valuation hope-based stock prices is bound to close... and that is why the following 2 charts must be scary for Janet (and every asset-gathering commission-taking talking head out there). The Wedge: (the Fed-engineered gap between reality and unicorns)
And the flow: (the rate of change of The Fed balance sheet - as opposed to the level or 'stock' of The Fed balance sheet - is what matters after all, via NJC)
So once again we'll ask, as we have ever since 2014: is the Fed simply rising rates just so it badly crashes the economy and has the cover to launch QE4, the same way Russian sanctions crippled Germany's economy and led to the ECB's very first episode of bond monetization? |
|||
Submitted by Tyler Durden on 06/21/2015 21:36 -0400
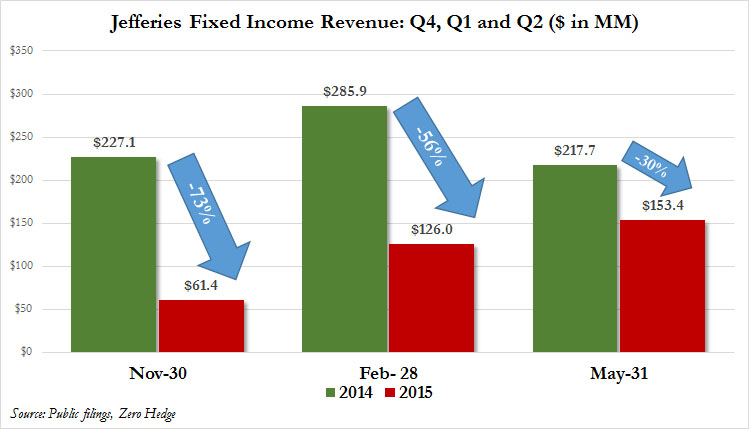
Bond Trading Revenues Are Plunging On Wall Street, And Why It Is Going To Get WorseAmong the renewed Greek drama, many missed a key development in the past week, namely Jefferies Q2 earnings, and particularly the company's fixed income revenue: traditionally a harbinger of profitability for Wall Street's biggest source of profit (or at least biggest source of profit in the Old Normal). And while not as abysmal as the 56% collapse in the first quarter, in the three months ended May 31 what has traditionally been the bread and butter of Dick Handler's operation generated just $153 million in revenue. CEO Handler blamed that decline on a lack of trading in the market and fewer companies selling junk bonds. To be sure, Q2 was better than the paltry $126 million in the previous quarter, however, the streak of year-over-year declines is now becoming very disturbing for a bank for which an ongoing collapse in fixed income trading will spell certain doom for any ambitious expanion plans, and most likely will result in dramatic headcount reductions to the point where not even fired UBS bankers will be able to find a job at what has long been known as Wall Street's "safety bank."
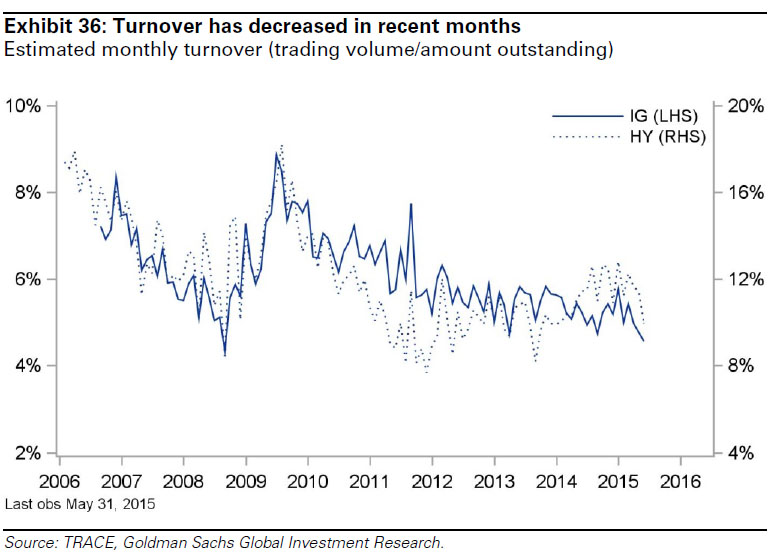
Unfortunately for both Jefferies and all of its other FICC-reliant peers, we have bad news: the drought in fixed income profits is only going to get worse for two main reasons: turnover, as a function of collapsing liquidity in all markets not just debt, has plunged to match the lowest levels in history, and while junk bond turnover is not quite record low yet, it is rapidly approaching its lowest print as well.
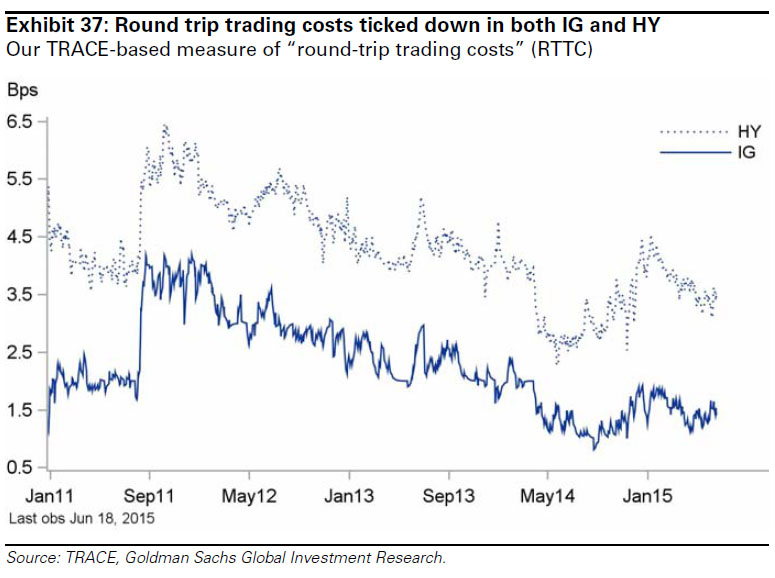
But it is not just turnover that is cratering. Even worse is that as electronic trading is increasingly penetrating this final frontier for Virtu (which recently fully took over FX trading leading to now weekly if not daily USD flash crashes following a headline overload), in addition to lack of trading interest (because in a centrally-planned market nobody sells until everybody sells... into a bidless market), the bid/ask spreads are collapsing as every broker fights tooth and nail for those last remaining pennies.
In short: anyone hoping that the Goldmans of the world will fare any better than Jefferies (which unlike the aforementioned hedge fund has far less revenue diversification and is thus forced to extract every possible dollar from the product line) in the fixed income trading drought, will be disappointed, and as a result very soon even that business which until the mid-2000s was Wall Street's quiet goldmine will become commoditized to the point where Virtu algos make flash crashing junk debt a daily routine. Ironically, the only thing that can "save" this once-most profitable product line for Wall Street is the full-blown return of risk and volatility, resulting in a surge in trading i.e., selling. Just as ironic: the only thing which can save market cheerleading CNBC's sinking ratings is a market crash. Well, CNBC may be too late for saving, but if Wall Street one day realizes that it will be best suited should another crash take place, then one can be certain that that is precisely what will happen. The only question is who will be the sacrificial lamb that unleashes the next risk tsunami in the post-Lehman world.
|
|||
Submitted by Tyler Durden on 06/04/2015 21:58 -0400 The Real Reason Why There Is No Bond Market Liquidity LeftBack in the summer of 2013, we first commented on what we called "Phantom Markets" - displayed quotes and prices, in not only equities, FX and commodities but increasingly in government bonds, without any underlying liquidity. The problem, which we first addressed in 2012, had gotten so bad, even the all important Treasury Borrowing Advisory Committee to the US Treasury had just sounded an alarm on the topic. Since then we have sat back and watched as our prediction was borne out, as bond market liquidity slowly devolved then sharply and dramatically collapsed recently to a level that is so unprecedented, not even we though possible, leading first to the October 15 bond flash crash and countless "VaR shock" events ever since. And while we urge those few carbon-based life forms who still trade for a living to catch up on our numerous posts on market "liquidity" and lack thereof, here is a quick and dirty primer on just why there is virtually no bond market left, courtesy of the man who, weeks ahead of the Lehman collapse when nobody had any idea what is going on, laid out precisely what happens in 2008 and onward in his seminal note "Are the Brokers Broken?", Citigroup's Matt King. Here is the gist of his recent note on the liquidity paradox which is a must read for everyone who trades anything and certainly bonds, while for the TL/DR crowd here is the 5 word summary: blame central bankers and HFTs. * * * The more liquidity central banks add, the less there is in markets
How Bad Is Liquidity Reall? From the BIS to BlackRock, and Jamie Dimon to Jose Vinals, everyone seems to be talking about market liquidity. Chiefly they seem to be fretting about a lack of it. Primary markets might be wide open, thanks in large part to the largesse of central banks, but the very same investors who are buying today seem deeply concerned about their ability to get out tomorrow. Liquidity as a concept is notoriously difficult to pin down. It has a reputation for being very much in evidence when not required, and then disappearing without trace the moment you need it. For strategists – and regulators – this represents a challenge: conventional metrics like bid-offer and traded volume can go only so far towards capturing what investors mean by liquidity. And yet because investors’ concept of liquidity tends very much to be focused on tail events, by definition, data to help monitor it are scarce. This paper tries to assess the evidence across markets, and evaluate what is driving it. Some observers have argued that even if liquidity is disappearing from some markets, it is being maintained – or even concentrated – in others. We argue in contrast that the risk of illiquidity is spreading from markets where it is a traditionally a problem, like credit, to traditionally more liquid ones like rates, equities, and FX. There is a bifurcation – but it is between decent liquidity much of the time and then sudden vacuums when it is really required, not across markets. We likewise take issue with the widespread notion that the problem is solely due to regulators having raised the cost of dealer balance sheet, and could be ameliorated if only there were greater investment in e-trading or a rise in non-dealer-to-non dealer activity. To be sure, we see the growth in regulation – leverage ratio and net stable funding ratio (NSFR) in particular – as one of the main reasons why rates markets are now starting to be afflicted, and indeed we expect further declines in repo volumes to add to such pressures. But illiquidity is a growing concern even in markets like equities and FX, which use barely any balance sheet at all, and where e-trading is the already the norm rather than the exception. Instead, we argue that in addition to bank regulations, there is a broad-based problem insofar as the investor base across markets has developed a greater tendency to crowd into the same trades, to be the same way round at the same time. This “herding” effect leads to markets which trend strongly, often with low day-to-day volatility, but are prone to air pockets, and ultimately to abrupt corrections. Etrading if anything reinforces this tendency, by creating the illusion of lliquidity which Such herding implies a reduction in the heterogeneity of the investor base. One potential cause is the way steadily more investor types having become subject to procyclical accounting and capital requirements in recent years, most obviously for insurance companies and pension funds. But the tendency towards illiquidity pockets even in markets where insurance and pension money is not dominant suggests a deeper cause. We think the most likely candidate is central banks’ increasing hold over markets. Over the past four years, it is expectations of central bank liquidity, not economic or corporate fundamentals, which have become the main driver of everything from €/$ to credit spreads to BTP yields. While central banks have always been significant market participants, their role has obviously grown since 2008. Most obviously, their global asset purchases have drastically reduced the net supply of securities available to be bought by investors. At the same time, we have seen a breakdown in a number of fundamental relationships which had previously correlated well with markets – and their replacement with metrics directly linked to central bank QE. Because the herding is not directly backed by leverage, it is unlikely to be reduced by macroprudential regulation. To date, the air pockets and flash crashes represent little more than a curiosity, having mostly been resolved very quickly, and having had little or no obvious feedthrough to longer-term market dynamics, never mind to the real economy. But we think ignoring them would be a mistake. Each has occurred against a largely benign economic backdrop, with little by way of a fundamental driver. And yet with each one, investors’ nervousness about the risk of illiquidity is likely to have been reinforced. When the time comes that investors do see a fundamental reason all to sell – most obviously because they start to doubt the extent of central banks’ support – their desire to be first through the exit is liable to be even greater. There when it’s not needed First, let us consider the evidence that all the fuss about liquidity is much ado about nothing. In many markets, under normal conditions, it is now possible to trade on more platforms, with more counterparties, and with tighter bid-offer, than ever before. While some market developments may perhaps point to the potential for problems, day-to-day liquidity remains remarkably good. Plenty of notional volume, with tight bid-offer The most obvious data point in this respect is that notional traded volumes in many markets are at or close to all-time highs.
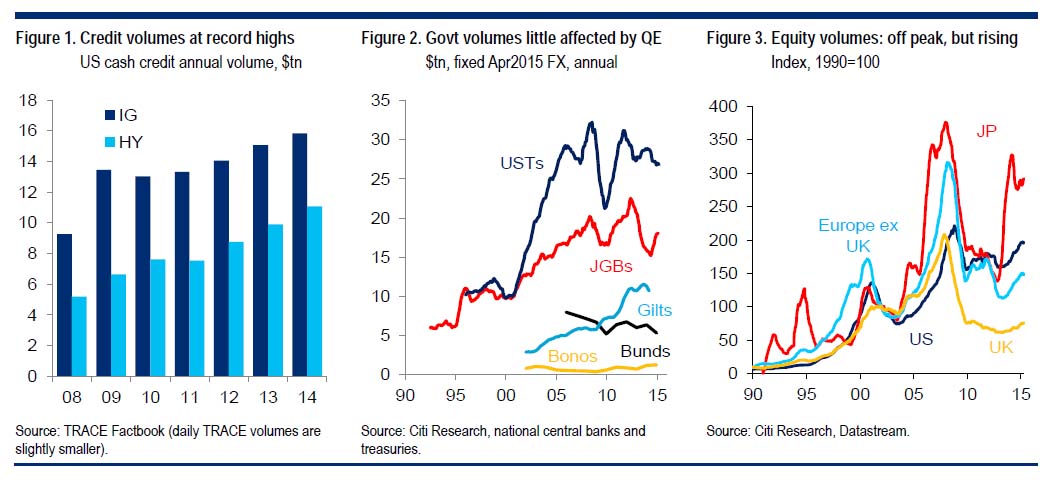
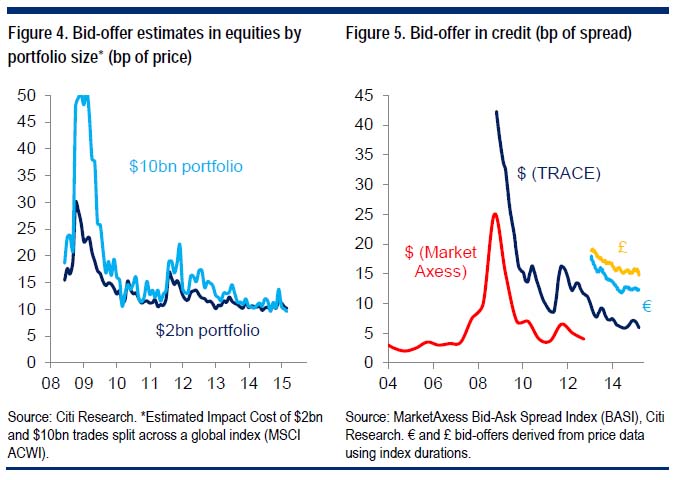
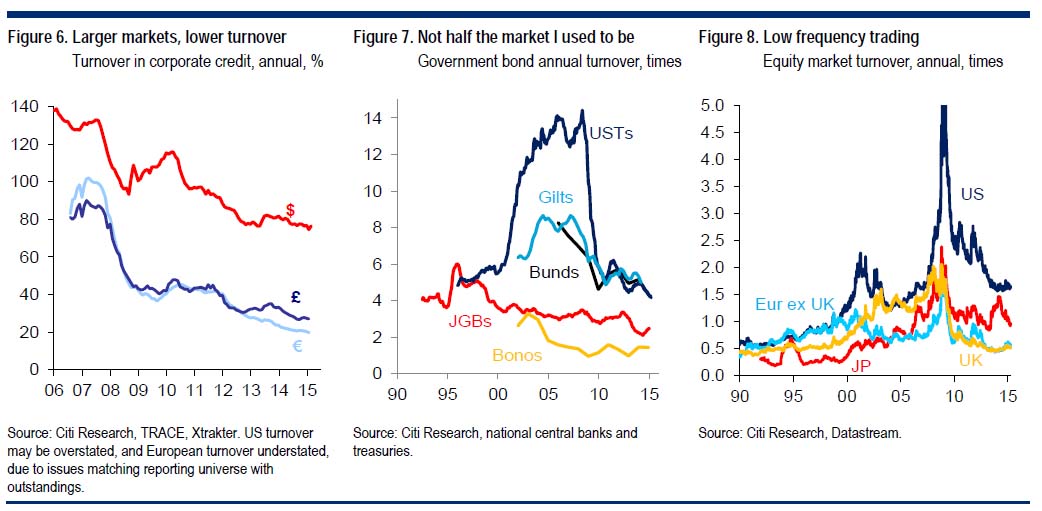
US credit, for example, saw nearly $27 trillion in secondary trading last year; HY volumes have doubled since the crisis (Figure 1). In government bonds, the increase was typically pre-crisis, but volumes have typically remained flat even in the face of a growing proportion of bonds being absorbed by the central banks (Figure 2). German Bunds are a notable exception. Notional volumes in equities have fallen from precrisis peaks, but remain close to them in the US and Japan (Figure 3). Likewise, data on bid-offer across markets mostly paints a healthy picture. The BIS shows that bid-offer in govies has largely fallen back towards pre-crisis levels. Equity bid-offer is likewise close to pre-crisis lows, and seems to suggest that even quite large portfolios could be transacted at tight spread levels – provided volumes were split quite broadly across a large number of stocks (Figure 4). Bid-offer in credit remains wide to pre-crisis levels, as far as we can tell4, but is the tightest it has been since then (Figure 5). For small investors not correlated with the broader herd, these gains in notional volume and tight bid-offers will represent a very real ability to transact.
Turnover in decline Admittedly, the positive message in these notional data is considerably mitigated when the growth in many markets – and in many investors’ portfolios, especially in rates and credit – is taken into consideration. Once transaction volumes are adjusted to show the difficulty an investor is likely to have moving a given percentage of the market, a very different picture emerges – and one which is much more consistent across markets. In credit, rates, and equities alike, turnover relative to market outstandings has fallen considerably. Corporate turnover has almost halved since the crisis (Figure 6). The decline in government bond turnover has been more protracted, but is just as drastic, especially in US Treasuries (Figure 7). Equity turnover is more obviously influenced by the rise and fall in outstandings with market movements, but has also suffered a post-crisis decline (Figure 8).
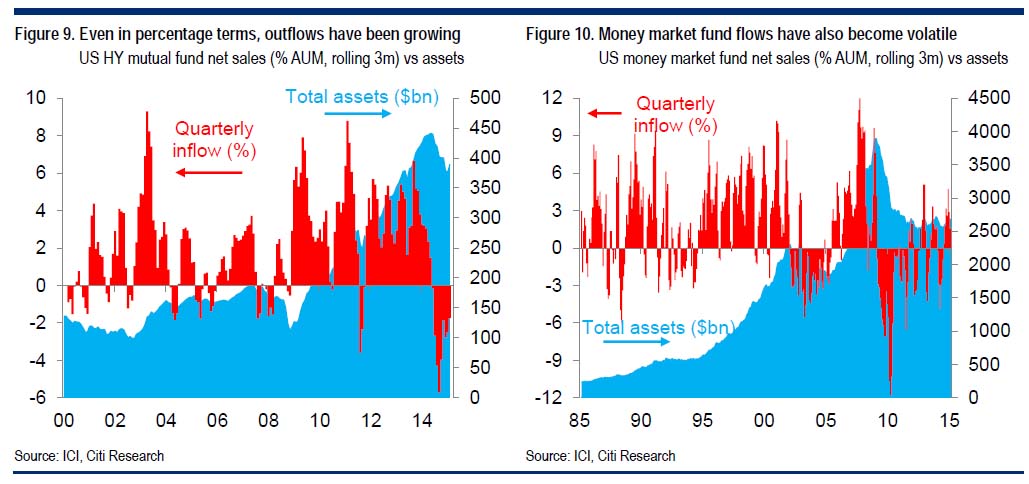
For most investors, turnover is probably a more useful metric than straight traded volume. Monthly mutual fund inflows and outflows have generally grown as fund sizes have increased; for high-yield bond funds, net outflows seem to have been growing even in percentage terms, never mind in notional ones (Figure 9). Given that their share of the market has also been growing, the capacity to move a given percentage of the market is a much better guide than the ability to move a given notional volume. The same tendency is not quite as pronounced in other long-term fund types, but seems also to be true for money market funds (Figure 10).
And yet despite declining turnover, the fact remains that outflows to date have not led to obvious liquidity problems. ETFs, futures and indices – can they be more liquid than their underlying? If the mutual funds’ role in contributing to market liquidity risks has been exaggerated, then we think ETFs have been more maligned still. They may well be responsible for some of the reason “day-to-day” liquidity has held up so well, but we struggle to see that they can be blamed for any increase in its tendency to disappear under stress. The rise in ETFs has certainly been striking; in equities, in particular, net ETF sales have outstripped regular mutual fund sales in recent years (Figure 16), though in fixed income their rise has been slower. More striking still is that ETF trading now constitutes just under 30% of all US equity dollar volume. The rise of ETFs is probably one reason why, also in Europe, a growing proportion of daily volume is shifting away from intraday trades and towards end-of-day auctions (Figure 17). There may well be a positive feedback loop in which other large trades are increasingly executed at end-of-day auctions, precisely because investors know that liquidity is becoming concentrated there, and to avoid being seen for reporting purposes to have dealt away from the daily closing price. But what is striking in Figure 17 is that non-auction equity volumes have also been rising in recent years. Rather than ETFs subtracting from cash traded volume, they seem to have added to it. The same might be said for the rise of traded volume in dark pools. In this respect, we see ETFs as very much akin to the CDS indices in credit, or futures in equities and rates. It is not that there is a fixed quantity of trading to be done, and that the arrival of a new instrument necessarily removes trades which would have been done elsewhere. If anything, we see the opposite phenomenon. Liquidity begets liquidity: when investors have new instruments with which to express views and refine their positions, it tends to encourage still more trading. In addition, in contrast with open-ended mutual funds, ETFs – like closed-end investment trusts – offer the possibility for prices to diverge from net asset values. This affords an additional cushion, especially during periods of market stress. The fact that ETF volumes have a tendency to increase relative to cash volumes during periods of stress – even though they then are likely to be trading at a discount – suggests that this cushion works well, and may even act to boost liquidity during stressed conditions. We have much sympathy for the way one ETF provider put it: “Everyone complains when they see our prices deviating from the underlying. But what they fail to realize is that at least people can and do actually trade at those prices: in troubled times, the prices shown on broker screens for underlying instruments are often a fiction.” So while we would agree with the statement that “no investment vehicle should promise greater liquidity than is afforded by its underlying assets”5, we think there is something for an exception for vehicles which are themselves tradable, and can trade with a basis relative to their underlyings. ETFs, CDS indices and futures can and do provide much more liquidity than their underlyings. This, though, is not so much because they “promise” more liquidity, as that they facilitate additional activity, much of which is crossed at the index level, and only a fraction of which is transmitted through to the underlying. While investors are periodically surprised and frustrated by these vehicles’ failure to perfectly track movements in their underlyings, this failure is in some ways the secret of their liquidity. Rather than stealing liquidity from the underlyings, we think their growth has added to it. Missing when required But if neither ETFs nor mutual funds can be held responsible for perceptions of reduced liquidity across markets, what can? The finger is most often pointed at the street. Many buysiders feel that dealers’ willingness to act as a liquidity provider even during good times has waned; might such reduced willingness also help explain an increased tendency of liquidity to evaporate altogether? We think this is much closer to the truth – but even so, we doubt it is the full story. Are the brokers broken? Such arguments have been voiced most persuasively in Jamie Dimon’s recent letter to JPM shareholders. He cited three factors: higher cost of balance sheet, explicit constraints for US banks as a result of the Volcker Rule, and in extremis the fact that the rescues of the likes of Bear Stearns, WaMu and Countrywide/Merrill have led not to gratitude but to heavy fines for JPMorgan and Bank of America, in at least one case following the abnegation of ex ante assurances otherwise. The effects of the latter two factors are hard to observe, and would probably become visible only in a proper crisis. Even then, they might in principle be offset by “Rainy Day” funds. These are pools of money being set up by asset managers precisely so as to take advantage of liquidity-related distortions. But it seems doubtful that these will ever reach the scale required to take 2008-style rescues, at least without large amounts of leverage. The effects of reduced dealer balance sheet, however, are visible already, and are contributing directly to the perception of illiquidity in fixed income. Unlike equities or FX, fixed income trading is fragmented across an extremely large number of outstanding securities. Only rarely can a willing buyer and seller of the same security be found at the same instant. As such, liquidity, particularly for larger trades, relies heavily on dealers’ ability to act as a warehouse, temporarily hedging a long position in one security with a short position in another. This requires both the availability of balance sheet, and the ability to borrow securities freely through repo. Both of these are now under threat from regulation.
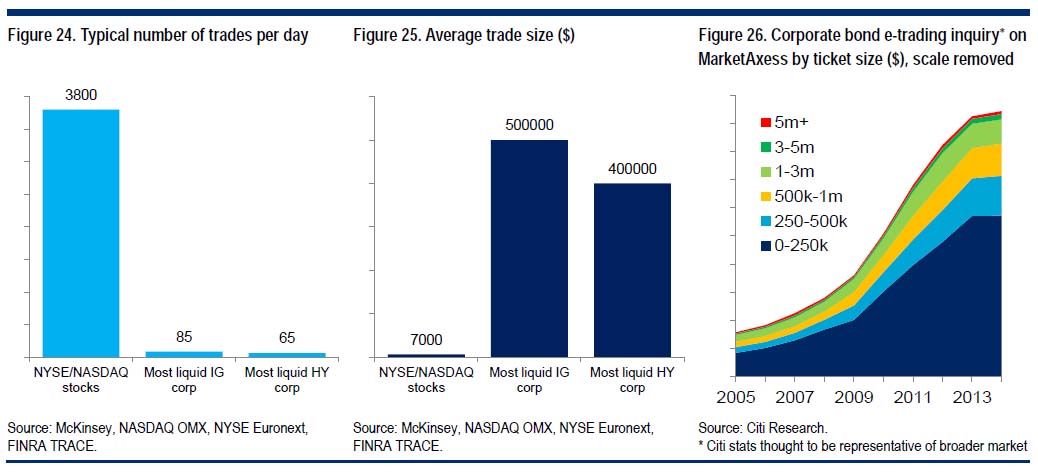
Why e-trading is no panacea E-trading works extremely well as an efficient means of uniting buyers and sellers of a given security – provided those buyers and sellers exist in the first place. That is, a buyer can probably find a seller faster now than they could a few years ago, when they had to rely solely on email and phone calls. In indices, in equities and in on-the-run govies, where many investors are ready and willing to trade the same security on either side of the market multiple times in an hour, this can bring about significant improvements (Figure 24). But in much of fixed income (and especially credit), liquidity is intrinsically fragmented. End investors’ willingness to buy and sell a large notional volume of a given security is simply not there in the first place (Figure 25). Even if investors could be persuaded to concentrate their positions in a given issuer on a smaller number of outstanding “benchmark” securities, as BlackRock has called for, issuers could never be persuaded to do so, since it would add to their refinancing risks. Issuers like the diversification that a multitude of outstanding securities brings.
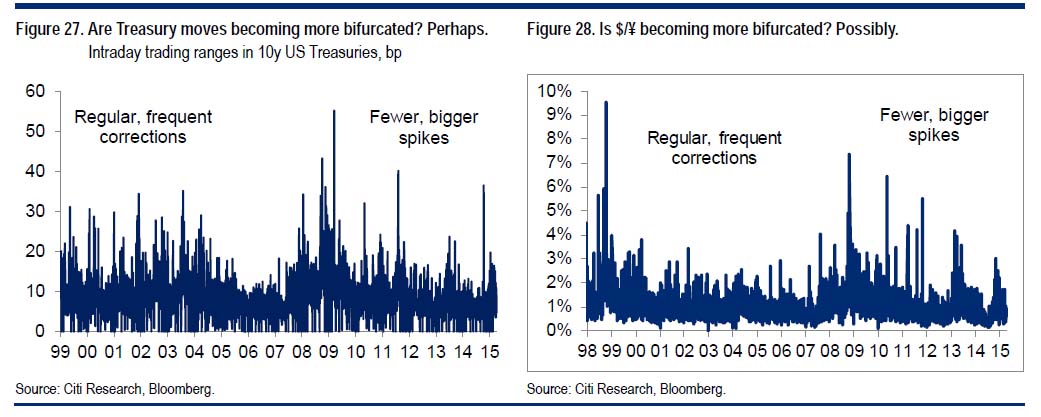
As such, it is no use efficiently putting together buyers and sellers when those buyers and sellers do not exist in the first place. This is why many traders report that – even when they have on occasions been able to offer ‘choice’ markets with zero bid-offer for a while, these have not necessarily resulted in any trading. End user liquidity remains fundamentally dependent on a counterparty’s willingness to act as a warehouse: to buy the security the seller wants to sell, to offer the security the buyer wants to buy, find a hedge of some sort and then move to unwind the position later. This is also why so many bond market participants – buyside and sellside – are opposed to efforts to copy-paste equity-inspired regulations into a fixed income framework in the interest of increased transparency. Nor is it obvious that there is an easy alternative to the existing broker-dealer model when it comes to warehouses. Bid-offers are tight enough that the market-making model relies upon leverage in order to generate a reasonable return on equity. Even if, say, asset managers or hedge funds are prepared to act as warehouses, for them to make money on the operation they will want to operate with leverage. But – as the clearing houses are now starting to find out, and banks discovered some time ago – such leverage represents precisely the sort of systemic risk that regulators are now keen to limit. As such, e-trading to date has done a great deal to boost what the IMF calls “flow”, or day-to-day liquidity, for small-sized trades. But when it comes to larger transactions, they can seldom be cleared (Figure 26). ‘Phantom liquidity’ – is the problem getting worse? There is an argument that the liquidity provided by e-trading seems to be more fleeting than that stemming from voice trades and personal relationships. When markets become volatile, e-trading operators tend to pull the plug – or, at best, reduce the size they are willing to trade. A recent IMF analysis concluded that it was precisely such a reduction in the depth of order books which seems to have led to the ‘flash rally’ in US Treasuries on October 15th 2014. A high dependence on electronic trading also seems to have contributed to the flash crash in equities on May 6th 2010. It is this phenomenon that is known as “phantom liquidity”, or the “liquidity illusion” – a tendency to evaporate when really needed. It does seem possible that e-trading may have added to such a tendency, by improving the appearance of liquidity under normal conditions, and then withdrawing it in periods of stress. This could help explain why some of the most obvious instances of recent illiquidity have occurred in markets which already have high proportions of trades conducted electronically. And yet beyond the anecdotal, quantitative data demonstrating an increased tendency towards “phantom liquidity” is extremely hard to pin down. After all, it makes predictions not about day-to-day circumstances but about tail events, which by definition are few and far between. The best evidence is probably some increase in bifurcation in day-to-day trading conditions, visible in daily volatility levels across markets. Rather than there being a steady stream of moderately volatile days (and liquidity conditions), volatility seems to be becoming more clustered than it used to be: there are many days with tight ranges and good liquidity, and then occasional days of extreme intraday volatility and reportedly poor liquidity – even though (as in the flash crash and flash rally) volumes on such days can actually remain quite high. Often, the volatility is thought to occur intraday, and therefore may not be captured by the net daily changes implicit in volatility metrics. Looking at intraday high-low ranges in markets paints a slightly clearer picture – but not decisively so. It does in general seem to us that intraday ranges have become more bifurcated since around 2005, most obviously with a period of low volatility prior to the financial crisis being followed by the extremely high ranges during the crisis itself, but also with post-crisis daily trading ranges being more bifurcated than prior to 2005.
Low day-to-day volatility, punctuated by occasional sharp corrections, are exactly what we might anticipate if markets were becoming less liquid. In credit, for example, they are one of the features which distinguishes the cash market relative to the continual bouncing around of the CDS indices. And we have argued previously that markets seem to be becoming more subject to positive feedback loops, which see them trending steadily upward only to fall back suddenly and often unexpectedly. And yet the limited number of observations, and the variations across markets, make it hard to make confident statistical statements about any change in the shape of distributions. We are left with the unsatisfying conclusion that evaporating liquidity is as much a feeling voiced by many market participants as to what might happen under stress, illustrated by a few idiosyncratic examples, as it is a statistically demonstrable phenomenon. The evidence of increased herding A recipe for a perfectly liquid market would be one with a small number of homogeneous securities being traded by a much larger number of heterogeneous participants. This would do a great deal to improve the likelihood of a buyer and seller both wanting to transact in the same security at the same time, and hence being able to agree upon an appropriate price. Indeed, it has even been suggested that we might quantify markets’ potential for liquidity along such lines, taking the number of distinct market participants and dividing by the number of securities traded.15 This is one reason why liquidity in indices and futures is often so good, as they concentrate a large amount of activity in a small place. One potential explanation for growing illiquidity is that markets have been evolving in an exactly opposite direction. Not only has the number of securities traded been growing (in credit in particular), but the heterogeneity of market participants seems to have been reducing as well. Here too, the regulations are partly to blame, with more and more investors being forced both to mark to market and to hold capital or cover pension deficits on the basis of such mark to market calculations. In addition, though, it feels to us as though market participants are increasingly looking at the same factors when they make their investment decisions. For the last few years, valuations in more and more markets seem to have stopped following traditional relationships and instead followed global QE. Likewise in meetings with investors, we have been struck by how little time anyone spends discussing fundamentals these days, and how much revolves around central banks. Record-high proportions of investors think fixed income is expensive and think equities are expensive. A growing number of property market participants seem to think real estate is expensive. And yet almost all have had to remain long, as each of these markets has rallied. Could it be that central bank liquidity has forced investors to be the same way round more so than previously, and that this is making markets prone to sudden corrections.
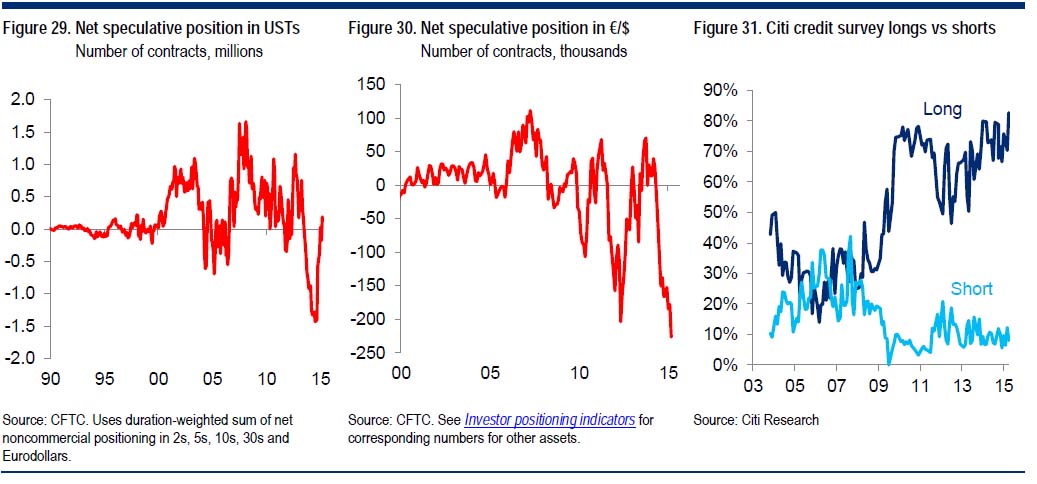
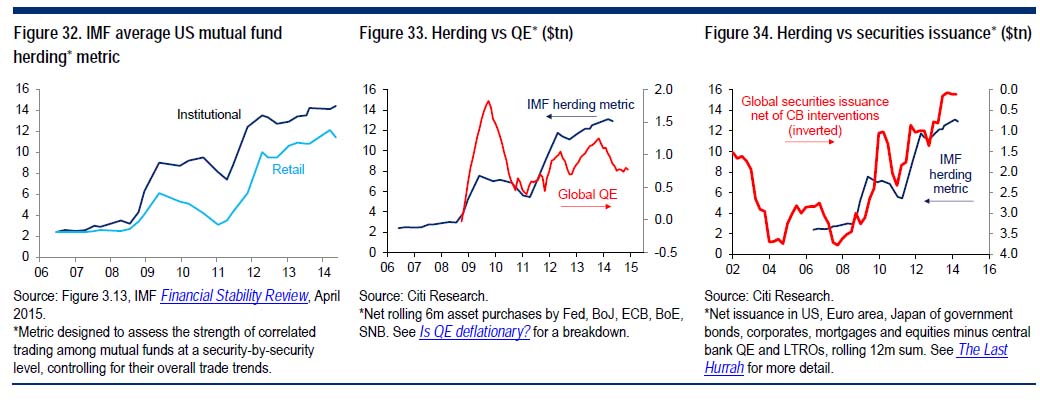
While it is hard to demonstrate conclusively, a growing weight of evidence would seem to point in such a direction. CFTC data on net speculative positioning in futures and options markets has become more extreme in recent years, and abrupt falls in net positioning have often coincided with sharp market movements. Net shorts in Treasuries reached record levels immediately prior to the flash rally, for example (Figure 29); net longs in commodities contracts preceded the sharp fall in commodities indices in the second half of last year, and record net euro shorts (Figure 30) and dollar longs are being squeezed at the moment. However, it could be argued that growth in notional contracts outstanding is a normal part of financial market deepening; normalizing by the net open interest would (at least in some cases) suggest recent positioning is not too far out of line with history. But other data also point to an increase in investor crowding. Our own credit survey shows that investors’ positions in credit since the crisis have not only been longer on average than ever previously, but also less mean reverting, and exhibiting less dispersion and less mean reversion (Figure 31). Fully 83% of those surveyed were long credit in December last year – a sizeable imbalance for any market. Similarly, the BAML global investor survey shows that investors have been long in equities for a longer period than would historically have been normal. Research specifically designed to detect investor herding has reached the same conclusion. An IMF analysis of the correlation between individual securities transactions by US mutual funds, using the vast CRSP database, shows a clear pickup in herding with the crisis, and then another one in late 2011. The herding seems to have occurred consistently across markets, but was more intense in credit and especially EM than in equities. It also occurred both among retail and among institutional investors. The IMF were unable to test for herding in government bonds and FX because of the much more limited number of securities. What we find striking about the herding numbers is the way they correlate with the metrics we use to track the scale of central bank interventions: rolling global asset purchases by DM central banks, and global net issuance of securities once central bank purchases (and, in this case, also LTROs) have been subtracted out. Over the past four years, we have had to use these metrics to help explain market movements when traditional fundamental relationships have broken down. Investors likewise agree on the dominance of central banks: in a survey of global credit derivatives investors we conducted in January this year, fully two thirds thought “central bank actions” would be the main driver of spreads this year, well ahead of “credit fundamentals”, “global growth trends” or “geopolitical risks”. Even if the central banks are only having to intervene because the systemic risks they are confronting have become bigger, the effect remains the same.
This, then, would seem to be the final piece of the puzzle as to what is making markets prone to pockets of illiquidity. Central bank distortions have forced investors into positions they would not have held otherwise, and forced them to be the ‘same way round’ to a much greater extent than previously. The post-crisis increase in correlations, which has been visible both within credit and equities and across asset classes (Figure 35), stems directly from the fact that investors now increasingly find themselves focused on the same thing: central bank liquidity. Every so often, when they start to doubt their convictions, they find that the clearing price for risk as they try to reverse positions is nowhere near where they’d expected. This explains why the air pockets have not just been in markets where the street acts as a warehouser of risk. It explains why they have occurred not only in the form of sell-offs which could have caused multiple market participants to suffer from procyclical capital squeezes. It also explains why the catalysts have often, while often trivially small, have nevertheless been macro in nature, since they have boosted expectations of a change in central banks’ support for markets. Unfortunately, it leads to a rather ominous conclusion. The bouts of illiquidity will continue until central banks stop distorting markets. If anything, they seem likely to intensify: unless fundamentals move so as to justify current valuations, when central banks move towards the exit, investors will too. Rather than dismissing recent episodes as relatively harmless, then, we are supposed to worry how much larger a move could occur in response to a more obvious stimulus. While financial sector leverage has fallen, debt across the nonfinancial sectors of almost every economy remains close to record highs, meaning that the potential for negative wealth effects in the real economy is very much there. In principle, markets could gap to a point where they went from being absurdly expensive to being absurdly cheap, and then – as investors stepped in again – gap tighter, perhaps even without very much trading. But the existence of the feedback loop to the real economy means that the fundamentals tend also to be affected by extreme market moves: “cheap” may be a moving target. This in turn could force central banks to step back in again. To sum up, we are left with a paradox. Markets are liquid when they work both ways. Market participants, though, find themselves increasingly needing to move the same way. This is not only because of procyclical regulation; it is also because central banks have become a far larger driver of markets than was true in the past. The more liquidity the central banks add, the more they disrupt the natural heterogeneity of the market. On the way in, it has mostly proved possible to accommodate this, as investors have moved gradually, and their purchases have been offset by new issuance. The way out may not prove so easy; indeed, we are not sure there is any way out at all. * * * To which all we can add is: Good luck with the "exit" |
|||
"BEST OF THE WEEK " MOST CRITICAL TIPPING POINT & THEMES ARTICLES THIS WEEK June 28th, 2015 - July 4th, 2015 |
|||
| BOND BUBBLE | 1 | ||
| RISK REVERSAL - WOULD BE MARKED BY: Slowing Momentum, Weakening Earnings, Falling Estimates | 2 | ||
| GEO-POLITICAL EVENT | 3 | ||
GEO-POLITICAL EVENT RISK - Greece, Puerto Rico, China and France Greece Will Default To IMF Tomorrow, Government Official SaysTyler Durden on 06/29/2015Earlier today, as the exchange between Greece and its creditors got increasingly belligerent, Estonian Prime Minister Taavi said that "Greece’s debt would still remain outstanding and creditors would expect this money back." So did this latest antagonism change the Greek mind? According to a flash headline by the WSJ released moments ago, not all. In fact, Greece just made it official that it would default to the IMF in just over 24 hours: "Greece won't pay IMF tranche due Tuesday, government official says"
Puerto Rico Announces Bond Payment "Moratorium" Tyler Durden on 06/29/2015 Tyler Durden on 06/29/2015
Having concluded last night that Puerto Rico debt is "unpayable," and that his government could not continue to borrow money to address budget deficits while asking its residents, already struggling with high rates of poverty and crime, to shoulder most of the burden through tax increases and pension cuts, Padilla confirmed tonight that: PUERTO RICO TO SEEK "NEGOTIATED MORATORIUM", 'YEARS' OF POSTPONEMENT IN DEBT PAYMENTS. Likening his state's situation to that of Detroit and New York City (though not Greece), Padilla concluded, the economic situation is "extremely difficult," which is odd because just a few years ago when they issued that bond - everything was awesome? Strap In! China Is Crashing Again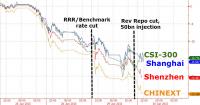 Tyler Durden on 06/29/2015 Tyler Durden on 06/29/2015
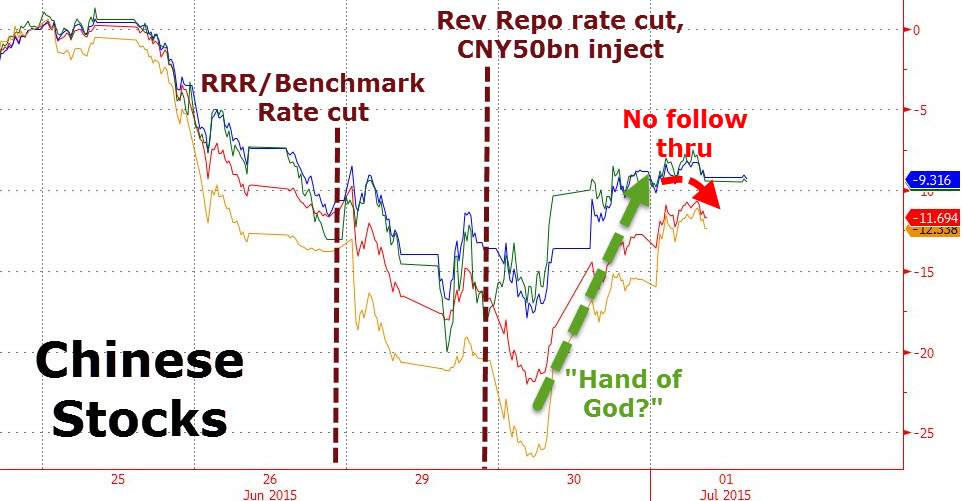
In the last 2 days, PBOC has thrown everything at the ponzi-fest they call a rational market. An RRR cut, a Benchmark rate cut, a rev repo rate cut, a CNY50 Bn rev repo injection, a stamp duty cut, IPO halts (cut supply), and last but not least permission to speculate with a reassurance that shares on a solid foundation. The outcome of all this policy-panic - CHINEXT (China's Nasdaq) is down another 6% today (down 25% in 3 days) and aside from CSI-300 futures, all other major Chinese indices are in free-fall. Add to that the fact that industrial metals are collapsing with steel rebar limit down and it appears Central Bank Omnipotence is under threat. French Economy In "Dire Straits", "Worse Than Anyone Can Imagine", Leaked NSA Cable Reveals Tyler Durden on 06/29/2015 Tyler Durden on 06/29/2015
Moscovici who served as French finance minister until 2014 and then became European commissioner for Economic and Financial Affairs, Taxation and Customs, used some very colorful language, i.e., the French economic situation was "worse than anyone [could] imagine and drastic measures [would] have to be taken in the next two years”. |
06-30-15 | GLOBAL RISK | 3 - Geo-Political Event |
| 06-30-15 | GLOBAL RISK | 3 - Geo-Political Event | |
| Posted by Cliff Küle at 6/30/2015 04:53:00 PM | |||
16 FactsThe Tremendous Financial Devastation That We Are Seeing All Over The World
1. On Monday, the Dow fell by 350 points. That was the biggest one day decline that we have seen in two years.
|
|||
| 06-30-15 | GLOBAL RISK | 3 - Geo-Political Event | |
| Posted by Cliff Küle at 6/30/2015 05:58:00 AM | |||
The Euro Crisis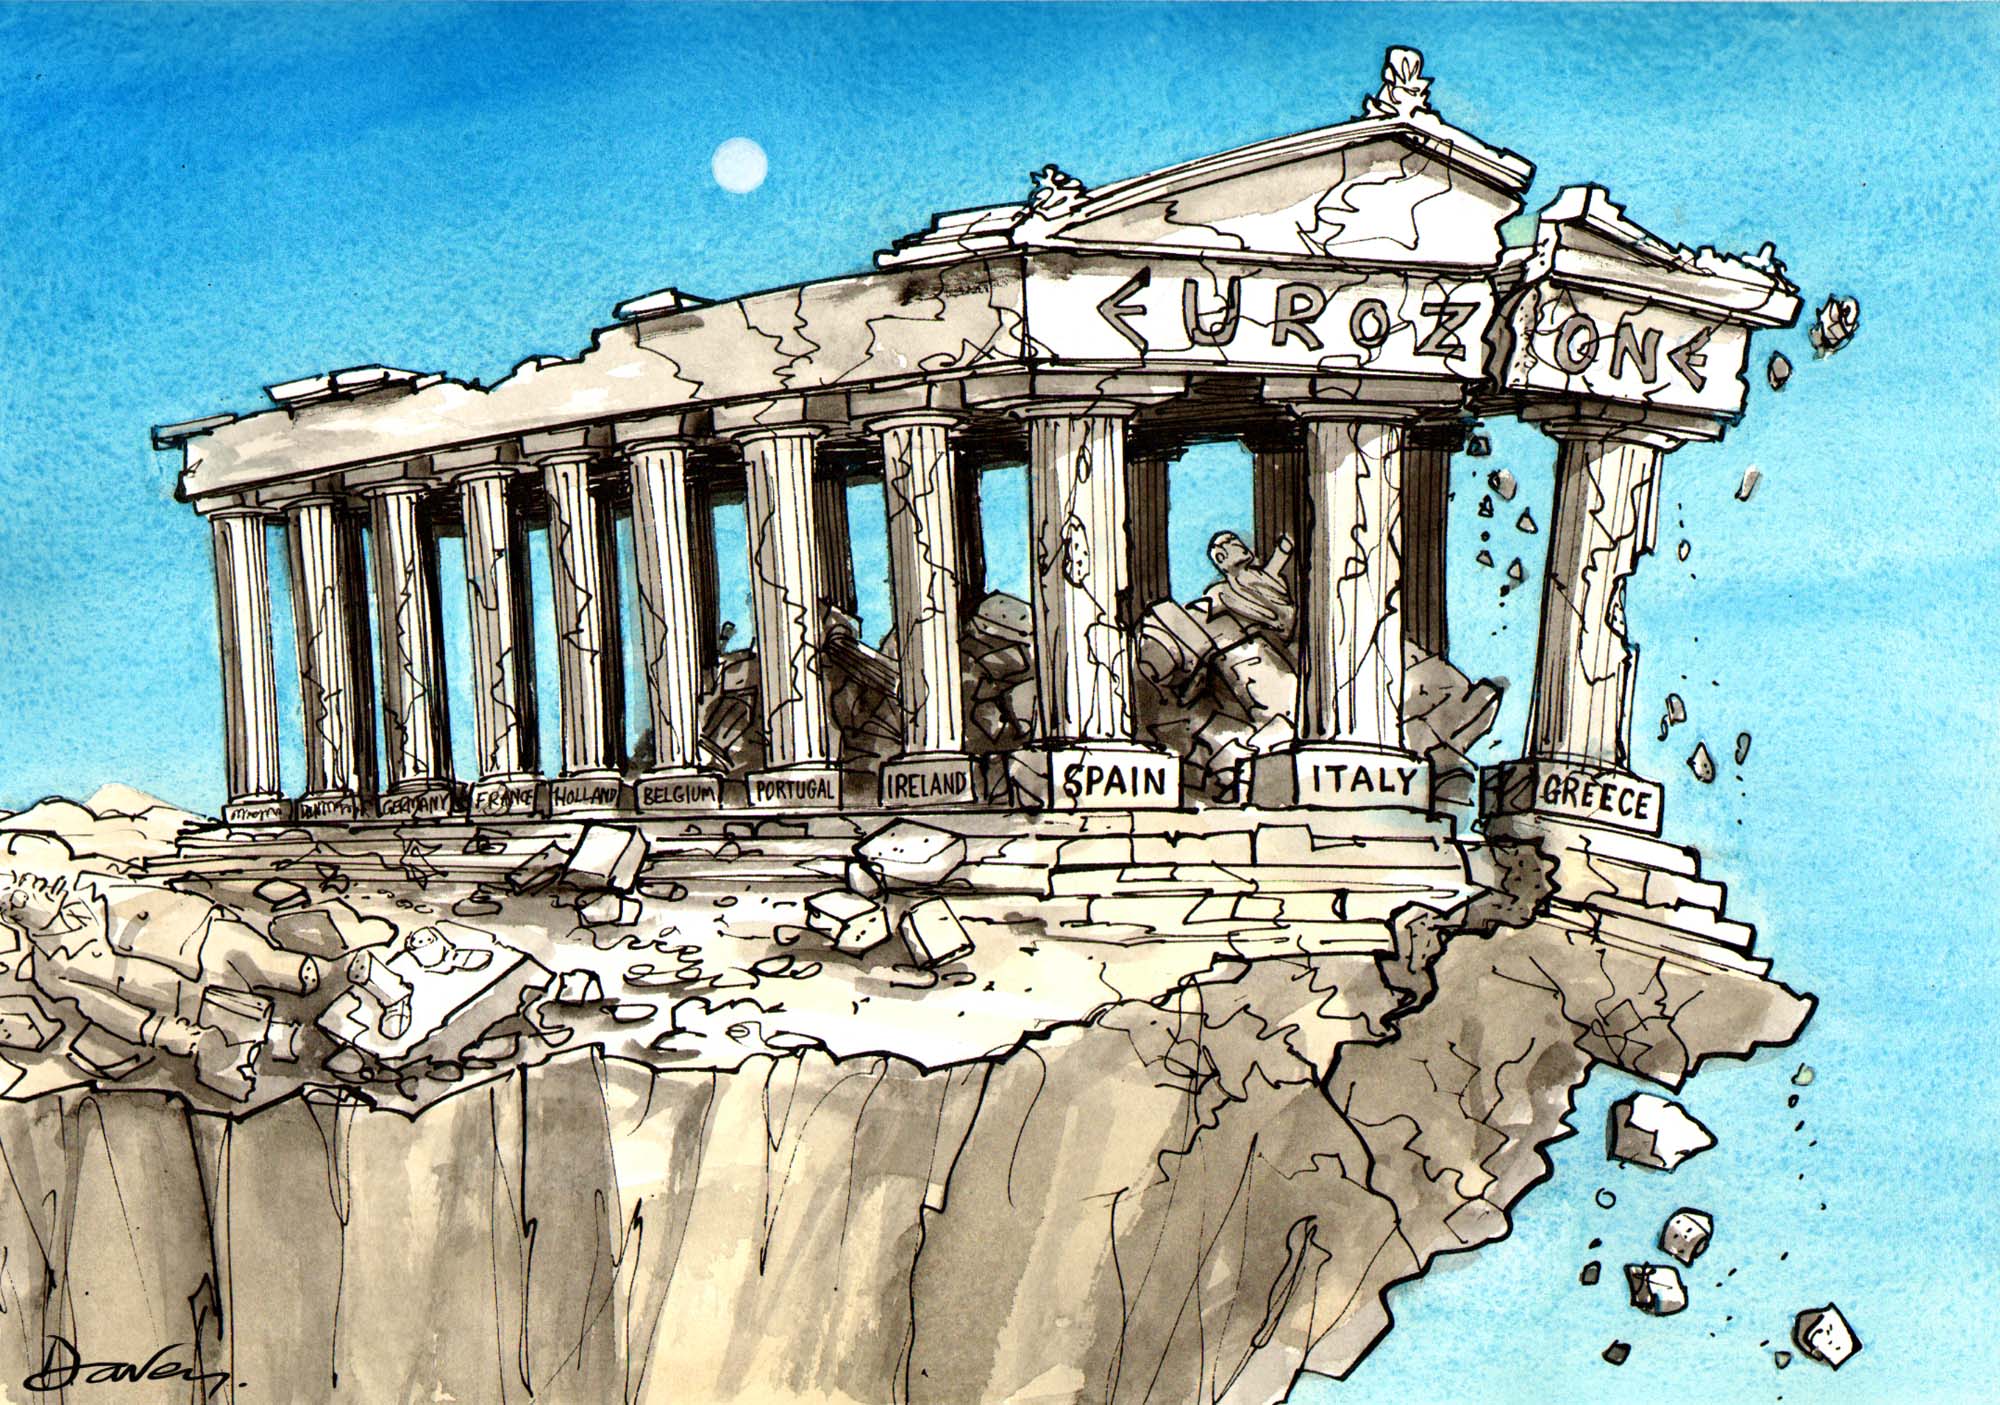 Alasdair Macleod sees the criticality of the Greek crisis as being central to the solvency of the European Central Bank (ECB) itself & therefore confidence in the euro currency .. "The ECB's balance sheet, which is heavily dependent on Eurozone bond prices not collapsing, is itself extremely vulnerable to the knock-on effects from Greece. As the situation at the ECB becomes clear to financial markets, the euro's legitimacy as a currency may be questioned, given it is no more than an artificial construct in circulation for only thirteen years. In conclusion, the upsetting of the Greek applecart risks destabilizing the euro itself, and a sub-par rate to the U.S. dollar beckons."
|
|||
| 06-30-15 | GLOBAL RISK | 3 - Geo-Political Event | |
| Posted by Cliff Küle at 6/30/2015 05:56:00 AM | |||
Europeans Rush to Gold Coins as Bank of Greece Stops Sales Bloomberg reports that European investors are increasing their purchases of gold as Greece's crisis intensifies .. "Investors are searching for a safe haven after Greece imposed capital controls, closed banks and stopped selling gold coins to the public until at least July 6."
|
|||
| CHINA BUBBLE | 4 | ||
Early China Strength Fades Fast As Margin Debt Plunges Most In 3 YearsWed, 01 Jul 2015 05:16:47 GMTFollowing the much-celebrated (and massive 13% swing low-to-high) bounce yesterday at the hands of a desperate PBOC, the morning session ended with an early boost fading. Shanghai margin debt has now suffered the longest streak of declines in 3 years and as BofAML warned they "doubt that this marks the end of the de-leveraging process in the stock market given that much of the leveraged positions are yet to unwind." With both Manufacturing and Services PMIs printing above 50, stimulus is now clearly aimed at maintaining the bubble but as BofAML concludes, "after this adverse experience, we expect many investors will be much more cautious before investing into the stock market, we will be surprised to see a return of the unbridled enthusiasm of investors any time soon."
Not the follow through everyone was hoping and praying for after Greece defaulted...
To summarize:
* * * Longer term, the psychological damage from the two-week long sharp market decline may linger for a while. This means that any market rebound will unlikely be strong in our view.
|
|||
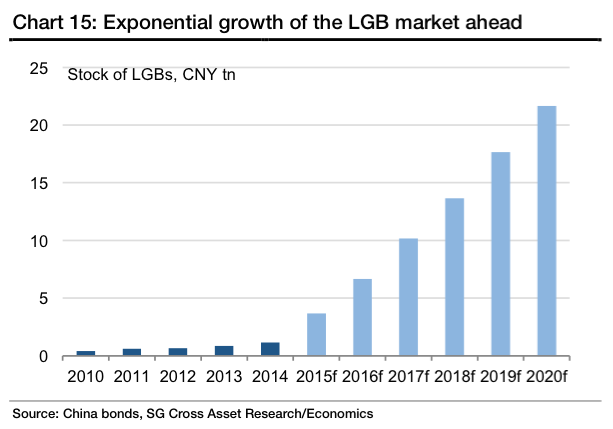
Chinese QE Calls Officially Begin: Bond Swap "Sucks Liquidity", "Contributes To Stock Slump", Broker ClaimsPosted:Wed, 01 Jul 2015 00:40:00 GMTOn Monday, we highlighted what we called an “insane” debt chart and explained what it means for the PBoC. Here’s a recap:
As a reminder, we've long said China's LGB refi initiative would eventually form the backbone of Chinese QE. Here is what we said in March when the program was in its infancy: "It seems as though one way to address the local government debt problem would be for the PBoC to simply purchase a portion of the local debt pile and we wonder if indeed this will ultimately be the form that QE will take in China." Similarly, UBS has suggested that when all is said and done, the PBoC will end up buying the new munis outright. From a March client note:
And so, here we are barely a month into the new LGB debt swap initiative (which, you're reminded, hasalready morphed into a Chinese LTRO program after the PBoC, recognizing that banks would be generally unwilling to take a 300bps hit in the swap, promised to allow participating banks to pledge the new munis for cash loans which can then be re-lent in the real economy at 6-7%) and the calls have begun for outright QE. Here's Bloomberg:
Note that this rather hyperbolic appeal for implementing full-on QE in China checks all the boxes: there's a reference to bond market illiquidy, an assertion about constraints on bank balance sheets (which, with credit creation stalling in China, is a big deal), and most importantly, a contention that somehow, the LGB debt swap program is contributing to the implosion of China's all-important equity bubble. A few more 'independent' assessments like these is likely all the PBoC will need to justify joining the global QE parade.
|
|||
How China Lost an Entire Spain in 17 DaysPosted:Tue, 30 Jun 2015 22:58:45 GMTBy EconMatters Concerned about a tumbling equity market, PBOC moved to cut both interest rates and the reserve requirement ratio for banks over the weekend. However, increasingly wary of a market bubble in China, investors still sent Shanghai Composite spiraling down another 3.3% on Monday after the dramatic 7.4% plunge last Friday despite the support from the central bank.
Investors are also unnerve by the latest development of Greece just days before a total default and Grexit out of EU, and the news that Puerto Rico could become another Greece of the U.S. facing a financial crisis and cannot pay back its $70 billion in municipal debt. Read: China's $370 Billion Margin Call VIX Spike MarketWatch reported that VIX spiked 33% to above 18, the highest since February, implying that investors are very nervous about the chaos going around. Beijing Targets Soft Landing? If you think U.S. stocks are lofty trading at an average of 16 times last year's earnings, the average Chinese stock is now trading at 30 times earnings. Analysts at HSBC think the China's central bank was trying to engineer a "soft landing" for stocks. But this could be a difficult balancing act trying to shore up investors' confidence while keeping a lid on the speculative fever among Chinese retailer investors (Remember those Chinese housewives who bought up 300 tons of gold and made Goldman Sachs swallow their gold selling recommendation?) Read: Is China Under The Skyscraper Curse? $1.3 trillion, an Entire Spain, in 17 Days
Size Does Matter Only time will tell if Beijing's able to turn the situation (i.e. slowing economy with a bubbling equity market) around. But if the world's biggest trading nation suddenly has a crisis of some sort, it would be a catastrophe of a different scale. Size does matter when it comes to financial collapse, and China could do far worse damage than any Grexit or PIIGS debt default. Chart Source: Quartz |
|||
| JAPAN - DEBT DEFLATION | 5 | ||
EU BANKING CRISIS |
6 |
||
| TO TOP | |||
| MACRO News Items of Importance - This Week | |||
GLOBAL MACRO REPORTS & ANALYSIS |
|||
US ECONOMIC REPORTS & ANALYSIS |
|||
| CENTRAL BANKING MONETARY POLICIES, ACTIONS & ACTIVITIES | |||
| Market | |||
| TECHNICALS & MARKET |
|
||
| STUDY - FUNDAMNENTALS | |||
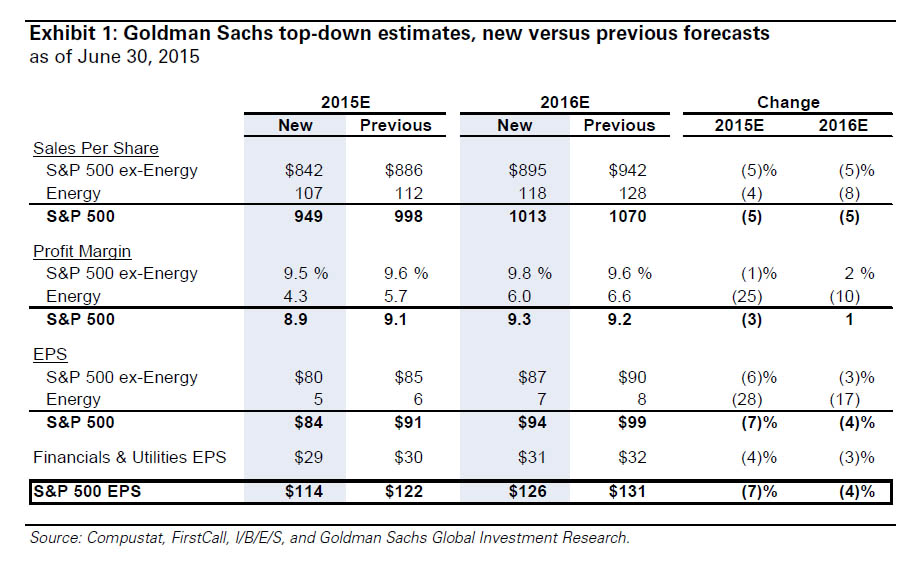
FUNDAMENTALS -The Truth "Slipped Out" Under Cover of Political Turmoil Goldman Just Crushed The "Strong Fundamentals" Lie; Cuts EPS, GDP, Revenue And Profit Forecasts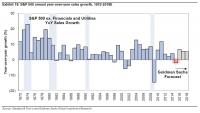 Tyler Durden on 06/30/2015 Tyler Durden on 06/30/2015
To summarize: the first revenue drop for the S&P in 5 years, a major downward revision in EPS now expecting just 1% increase in 2015 EPS, a 25% cut to GDP forecasts, a machete taken to corporate profits and 10 Yields, and not to mention double digit sales declines for some of the most prominent tech companies in the world. And that, in a nutshell, is the "strong fundamentals" that everyone's been talking about. SEE BELOW FOR EXPANDED ARTICLE DETAIL
Gross Says Hold Cash, Prepare For "Nightmare Panic Selling" Submitted by Tyler Durden on 06/30/2015 - 15:21 Submitted by Tyler Durden on 06/30/2015 - 15:21
That an ETF can satisfy redemption with underlying bonds or shares, only raises the nightmare possibility of a disillusioned and uninformed public throwing in the towel once again after they receive thousands of individual odd lot pieces under such circumstances.
|
07-01-15 | STUDY | |
| 07-01-15 | STUDY | ||
Goldman Just Crushed The "Strong Fundamentals" Lie; Cuts EPS, GDP, Revenue And Profit ForecastsPosted:Wed, 01 Jul 2015 02:15:06 GMTIn the past week, the one recurring theme among the permabullish parade on financial propaganda TV has been to ignore the closed stock market and banks in suddenly imploding Greece, the situation in Puerto Rico, the recent plunge in US stocks which are now unchanged for the year, and what may be the beginning of the end of the Chinese bubble and instead focus on the "strong" US fundamentals, especially among tech stocks - the only shiny spot an an otherwise dreary landscape (and definitely ignore the energy companies; nobody wants to talk about those). So we decided to take a look at just what this "strength" looks like. Well, we already saw the collapse in hedge fund hotel Micron Technology, which plunged 30% after it slashed its guidance last week. Alas that may be just the beginning. Here are the year-over-year revenue "growth" estimates for some of the biggest tech companies in Q2:
And that is the best sector among the "strong fundamentals" story. In fact, the only bright light in the entire tech space may well be AAPL whose sales are expected to grow 29%. We wish Tim Cook lot of strength if the recent Chinese market crash has dampened discretionary spending and demand for AAPL gizmoes in China. He will need it. But what's worse is that while reality will clearly be a disaster, there is always hype and always hope that the great rebound is just around the corner, if not in Q2 then Q3, or Q4, etc. This time even the hype is be over because none other than the most influential bank on Wall Street, the one all other sellside "strategists" religiously imitate, Goldman Sachs, just slashed its EPS and S&P500 year end price forecast for both 2015 and 2016. Here is Goldman with its explanation why it is lowering S&P 500 EPS:
However...
So earnings are bad and getting worse, but for Goldman that is not a reason to cut its S&P forecast simply because the economy is weaker than expected and also getting worse which means the rate hike originally forecast to take place in June is now set to take place in December, and thus boost P/E multiples (it won't of course but that will be Greece's fault).
So... the combination of deteriorating earnings and an even bigger slowdown in the economy ends up being a wash and keeping the S&P year end price target at 2100. Ah, the magic of financial Goldman's financial gibberish.
So aside from Goldman's 21x forward multiple (because 114 non-GAAP is about 100 GAAP which means Goldman is expecting a 21 Price to GAAP Earnings multiple) simply due to the Fed's hike delay from June to December, is there any good news? No. In fact, this is what Goldman's David Kostin has to say: "Macro headwinds diminish 2015 earnings growth prospects. S&P 500 sales will fall by 2% in 2015, the first annual decline in five years. Margins will slip to 8.9%. Energy is a drag on both sales and margins." Let's just focus on the "near-term" slip before we worry about the "long-term rebound." And before the intrepid questions of "this is only due to energy" arise, here is Goldman explaining that the weakness was broad, and impacted every single sector.
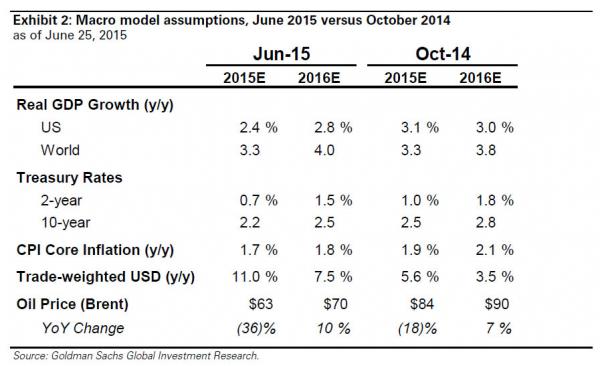
But wait, there's more: because in addition to its EPS forecast, Goldman also slashed its GDP and the 10Y yield forecast as well.
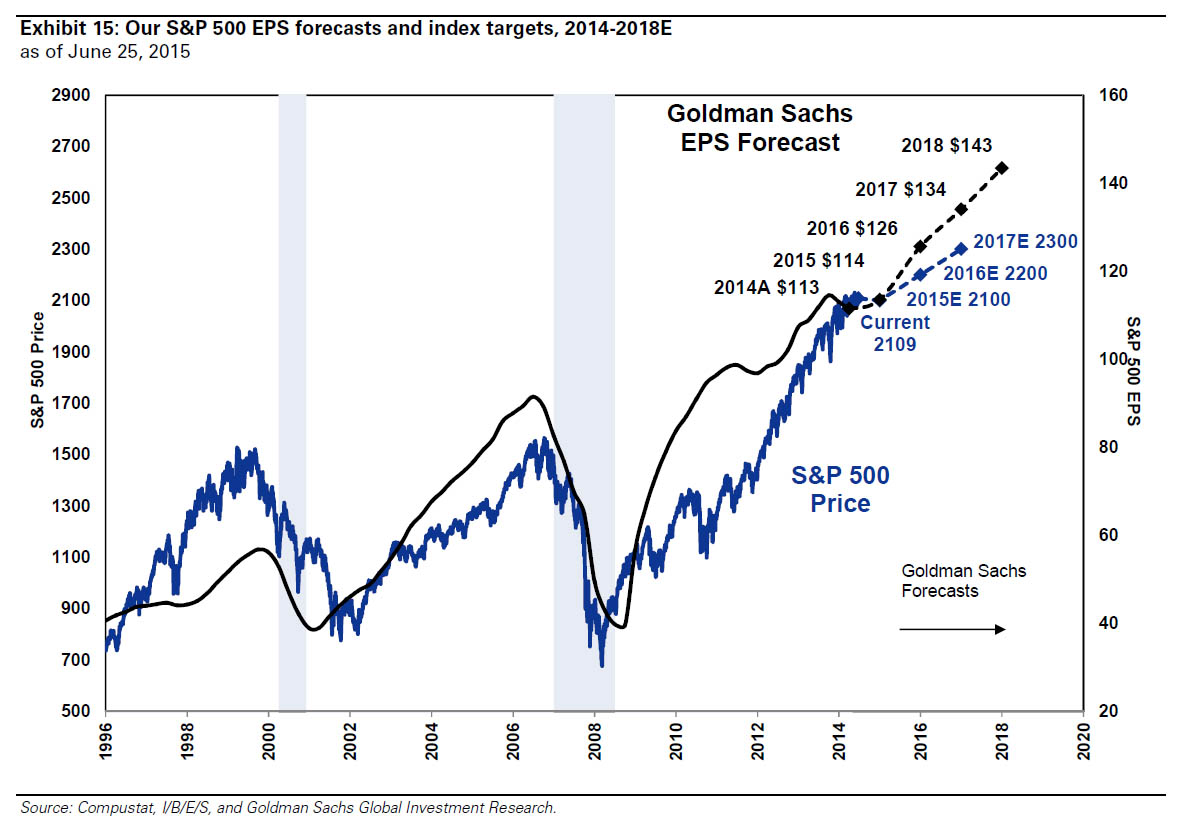
So ok, Goldman had a 25% error in its forecast in just under 9 months. Does that mean that the vampire squid is even remotely remorseful or concerned about the credibility of its 2017 and 2018 (yes, 2018) forecasts? Not at all: those are expected to remain completely unchanged on the back of some of the highest EPS gains in recent history. In fact, putting in context, Goldman now expects just 1% EPS growth in 2015 which will then magically soar to 11% in 2016 before "stabilizing" to a "modest" 7% annual EPS growth rate.
With just a little hyperbole, we can say that the only way S&P EPS will grow at that pace is if the S&P ends up buying back half its float. But while one can double seasonally adjust non-GAAP BS until a massive loss becomes a huge profit, one item can not be fabricated: sales. It is here that Goldman has far less to say for obvious reasons.
Yes you read that right "sales per share", because if buybacks can boost Non-GAAP earnings, why not revenues too. If there is a silver lining on the horizon it is one: "We forecast Health Care will grow sales faster than consensus expects." The corporations thank you Obamacare. * * * So to summarize: the first revenue drop for the S&P in 5 years, a major downward revision in EPS now expecting just 1% increase in 2015 EPS, a 25% cut to GDP forecasts, a machete taken to corporate profits and 10 Yields, and not to mention double digit sales declines for some of the most prominent tech companies in the world. And that, in a nutshell, is the "strong fundamentals" that everyone's been talking about.
|
|||
| COMMODITY CORNER - AGRI-COMPLEX | PORTFOLIO | ||
| SECURITY-SURVEILANCE COMPLEX | PORTFOLIO | ||
| THEMES | |||
| THESIS - Mondays Posts on Financial Repression & Posts on Thursday as Key Updates Occur | |||
| 2015 - FIDUCIARY FAILURE | 2015 | THESIS 2015 |  |
| 2014 - GLOBALIZATION TRAP | 2014 |  |
|
 |
|||
|
2013 2014 |
 |
||
FINANCIAL REPRESSION Is Financial Repression Here to Stay?
The First Chairman of the UK's Financial Services Authority Howard Davies writes an essay on financial repression .. "Maybe it is unreasonable for investors to expect positive rates on safe assets in the future. Perhaps we should expect to pay central banks and governments to keep our money safe, with positive returns offered only in return for some element of risk." .. Davies worries about the consequences of financial repression on the economy .. he sees distortions from the prudential regulation adopted in reaction to the financial crisis - "The question for regulators is whether, in responding to the financial crisis, they have created perverse incentives that are working against a recovery in long-term private-sector investment."
BCA Research Chief Economist Martin Barnes: "Financial Repression is Here to Stay" BCA Research's Chief Economist Martin Barnes sees financial repression as "here to stay" for the long-term, given the challenges of low economic growth & high debt globally .. Barnes has written a special report to explain why debt burdens are moe likely to rise than fall over the short & long run given demogaphic trends & the low odds of another economic boom .. BCA Research: "If governments cannot easily bring debt ratios down to more sustainable levels, then the obvious solution is to make high debt levels easier to live with. This can be done be keeping real borrowing costs down and by regulatory pressures that encourage financial institutions to hold more government securities. In other words, financial repression is the inevitable result of a world of low growth and stubbornly high debt. Martin argues that central banks are not overt supporters of financial repression, but they certainly are enablers because they have no other options other than to keep rates depressed if they cannot meet their growth and/or inflation targets. A world of financial repression is an uncomfortable world for investors as it implies continued distortions in asset prices, and it is bound to breed excesses that ultimately will threaten financial stability." LINK HERE to the Article & Link to Report
The Era of Financial Repression: Norway's Sovereign Wealth Fund says Monetary Policy is a Risk to Watch
“Monetary policy does affect pricing in today’s market to such an extent that monetary policy itself has been a risk you have to watch .. Investors are focused more on monetary policy changes than has been generally the case, than at any time, as far as I can remember .. As anything that moves prices is a risk that has to be monitored, here the effects of monetary policy affect prices dramatically .. It’s of course always been the case with long rates, and now more significantly with the currency. That’s just a fact of the current market." - Yngve Slyngstad, chief executive officer of Norway’s $890 billion sovereign-wealth fund "Financial repression is not a conspiracy theory, it is rather a collective set of macroprudential policies focused on controlling and reducing excessive government debt through 4 pillars - negative interest rates, inflation, ring-fencing regulations and obfuscation - to effectively transfer purchasing power from private savings." - The Financial Repression Authority
|
06-29-15 | ||
2011 2012 2013 2014 |
 |
||
| THEMES - Normally a Thursday Themes Post & a Friday Flows Post | |||
I - POLITICAL |
|||
| CENTRAL PLANNING - SHIFTING ECONOMIC POWER - STATISM | THEME | ||
- - CORRUPTION & MALFEASANCE - MORAL DECAY - DESPERATION, SHORTAGES. |
THEME |  |
|
| - - SECURITY-SURVEILLANCE COMPLEX - STATISM | M | THEME | |
| - - CATALYSTS - FEAR (POLITICALLY) & GREED (FINANCIALLY) | G | THEME | |
II-ECONOMIC |
|||
| GLOBAL RISK | |||
| - GLOBAL FINANCIAL IMBALANCE - FRAGILITY, COMPLEXITY & INSTABILITY | G | THEME | |
| - - SOCIAL UNREST - INEQUALITY & A BROKEN SOCIAL CONTRACT | US | THEME | |
| - - ECHO BOOM - PERIPHERAL PROBLEM | M | THEME | |
| - -GLOBAL GROWTH & JOBS CRISIS | |||
| - - - PRODUCTIVITY PARADOX - NATURE OF WORK | THEME | MACRO w/ CHS |
|
| - - - STANDARD OF LIVING - EMPLOYMENT CRISIS, SUB-PRIME ECONOMY | US | THEME |  |
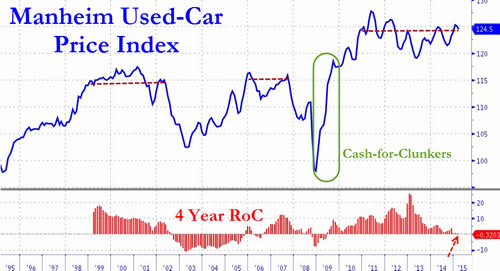
SUB-PRIME ECONOMY -Auto Loans Just as Used Car prices start to roll over again... (for the first time since the financial crisis, 4-year price changes - average term then - are now negative)
Worse yet, the most popular compact car prices are down 5.2% YoY and mid-size down 1.9% YoY. As Goldman notes,
|
07-02-15 |
SUB-PRIME ECONOMY |
|
| 07-02-15 |
SUB-PRIME ECONOMY |
|
|
Tyler Durden on 06/24/2015 20:30 -0400
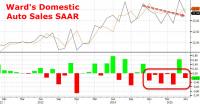
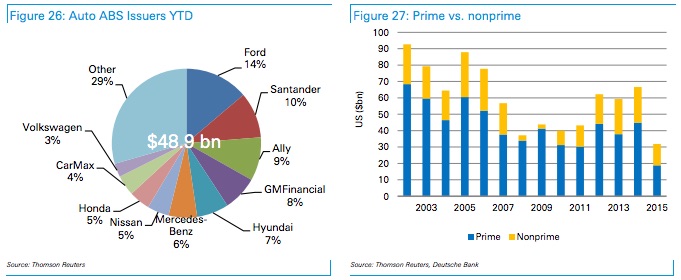
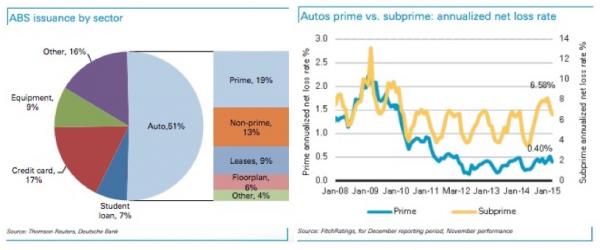
Auto Loans In "Untested" Territory Blackstone Warns As Subprime ABS Sales AccelerateEarlier this month, we gave readers a snapshot of the US auto market on the way to explaining why it was that car sales hit a 10-year high in May. To recap:
We went on to note that despite the worrying statistics shown above, optimists (like Experian) will likely point to the fact that the average FICO score for borrowers financing new cars fell only slighty from 714 to 713 Y/Y while the same Y/Y scores for those financing used vehicles actually rose from 641 in Q1 2014 to 643 in Q1 2015. While that's all well and good, there's every indication that those figures are likely to deteriorate significantly going forward. Why? Because Wall Street's securitization machine is involved. in the consumer ABS space (which encompasses paper backed by student loans, credit cards, equipment, auto loans, and other, more esoteric types of consumer credit), auto loan-backed issuance accounts for half of the market and a quarter of auto ABS is backed by loans to subprime borrowers. Put simply, those subprime borrowers are getting subprimey-er. In other words, the same dynamic that prevailed in the US housing market prior to the collapse is at play in the auto loan market. Lenders are competing for borrowers as lucrative securitization fees beckon, and this competition is directly responsible for loose underwriting standards. Bloomberg has more on the interplay between auto ABS issuance and “stretched” auto loan terms:
Here's a visual overview of the auto loan-backed ABS market (note the resurrgence of subprime as a percentage of total issuance post-2009 and the rising net loss rates):
* * * The takeaway here is simple: under pressure to keep the US auto sales miracle alive and feed Wall Street's securitization machine (which is itself driven by demand from yield-starved investors) along the way, lenders are lowering their underwriting standards and extending loans to underqualified borrowers. Particularly alarming is the fact that even as average loan terms hit record highs, average monthly payments are not only not falling, but are in fact also sitting at all-time highs. This cannot and will not end well. |
|||
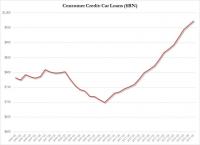
Submitted by Tyler Durden on 02/21/2015 20:14 -0400 Subprime Car Loan Bubble 2.0 Full FrontalWith the total balance of auto loans for new and used vehicles approaching $1 trillion in the U.S., the folks at Experian want you to know that no matter what the numbers say, there’s no speculative bubble forming in the industry. Just ask Melinda Zabritski, the group’s director of automotive finance, who is quick to dismiss the growing chorus of Chicken Littles who are concerned about subprime auto lending:
That would be great if it were true. Of course the reality is that, according to the NY Times, early delinquencies (i.e. borrowers who have missed a payment within 8 months of origination) are at their highest level since 2008:
Combine that with the fact that the percentage of total auto loan originations made to subprime borrowers surged to 27% in 2013 (the highest level since 2006), the same year that 1.1 million U.S. households took out auto title loans (i.e. the new home equity loan), and you’ve got a rather strong argument for the contention that anything we learned in 2008 about the perils of loose lending standards has now been completely forgotten. Reinforcing this point is Wells Fargo, who notes that things are now officially back to “normal,” where “normal” is amusingly defined by the conditions that prevailed in 2006:
Of course the bad news is that Americans are again overextended at just the wrong time:
The prudent thing to do, from a lender’s perspective, is to tighten standards when it appears borrowers are exhibiting a propensity to take on an undue amount of risk. Instead, standards are actually falling as risk-taking increases:
And, not surprisingly, recklessness is most prevalent in the two categories that have combined to underpin consumer credit growth post-crisis:
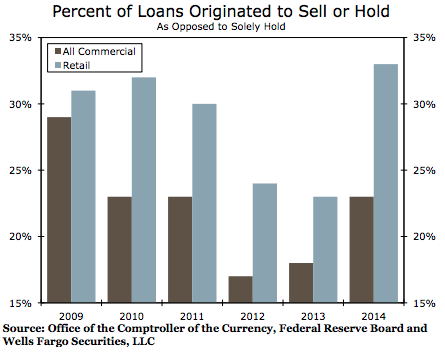
Most disturbing of all, lenders seem to have reverted to their pre-crisis mindset: “If we can sell the loan, who cares about the creditworthiness of the borrower?” In 2014, a third of all firms originated retail loans with the intent to sell or hold the loan (as opposed to the sole intention to hold the loan). This trend indicates that some firms could be extending loans that they consider less creditworthy and could be eager to get these higher-risk loans off of their balance sheets.
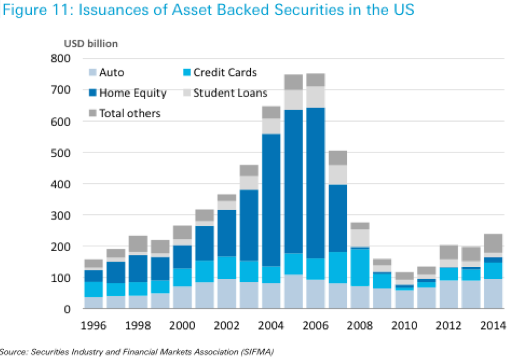
As a reminder, ABS issuance hit its highest level since the crisis last year with student and auto loans accounting for the lion’s share. That's no coincidence.
|
|||
III-FINANCIAL |
|||
| FLOWS -FRIDAY FLOWS | MATA RISK ON-OFF |
THEME |  |
| CRACKUP BOOM - ASSET BUBBLE | THEME | ||
| SHADOW BANKING - LIQUIDITY / CREDIT ENGINE | M | THEME | |
| GENERAL INTEREST |
|
||
| STRATEGIC INVESTMENT INSIGHTS - Weekend Coverage | |||
|
SII | ||
|
SII | ||
|
SII | ||
|
SII | ||
| TO TOP | |||


Read More - OUR RESEARCH - Articles Below

Tipping Points Life Cycle - Explained
Click on image to enlarge
TO TOP
 |
YOUR SOURCE FOR THE LATEST THINKING & RESEARCH
|
�
TO TOP