Submitted by Gail Tverberg via Our Finite World blog,
A person often reads that low oil prices–for example, $30 per barrel oil prices–will stimulate the economy, and the economy will soon bounce back. What is wrong with this story? A lot of things, as I see it:
1. Oil producers can’t really produce oil for $30 per barrel.
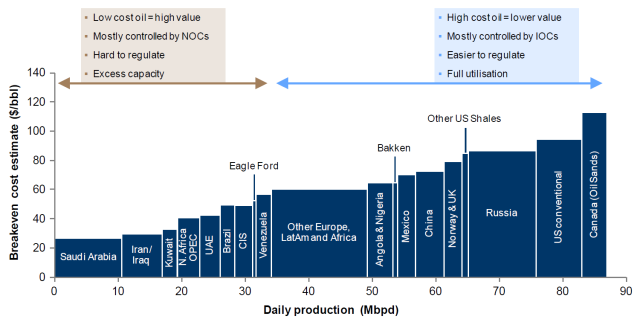
A few countries can get oil out of the ground for $30 per barrel. Figure 1 gives an approximation to technical extraction costs for various countries. Even on this basis, there aren’t many countries extracting oil for under $30 per barrel–only Saudi Arabia, Iran, and Iraq. We wouldn’t have much crude oil if only these countries produced oil.
Figure 1. Global breakeven prices (considering only technical extraction costs) versus production. Source: Alliance Bernstein, October 2014
2. Oil producers really need prices that are higher than the technical extraction costs shown in Figure 1, making the situation even worse.
Oil can only be extracted within a broader system. Companies need to pay taxes. These can be very high. Including these costs has historically brought total costs for many OPEC countries to over $100 per barrel.
Independent oil companies in non-OPEC countries also have costs other than technical extraction costs, including taxes and dividends to stockholders. Also, if companies are to avoid borrowing a huge amount of money, they need to have higher prices than simply the technical extraction costs. If they need to borrow, interest costs need to be considered as well.
3. When oil prices drop very low, producers generally don’t stop producing.
There are built-in delays in the oil production system. It takes several years to put a new oil extraction project in place. If companies have been working on a project, they generally won’t stop just because prices happen to be low. One reason for continuing on a project is the existence of debt that must be repaid with interest, whether or not the project continues.
Also, once an oil well is drilled, it can continue to produce for several years. Ongoing costs after the initial drilling are generally very low. These previously drilled wells will generally be kept operating, regardless of the current selling price for oil. In theory, these wells can be stopped and restarted, but the costs involved tend to deter this action.
Oil exporters will continue to drill new wells because their governments badly need tax revenue from oil sales to fund government programs. These countries tend to have low extraction costs; nearly the entire difference between the market price of oil and the price required to operate the oil company ends up being paid in taxes. Thus, there is an incentive to raise production to help generate additional tax revenue, if prices drop. This is the issue for Saudi Arabia and many other OPEC nations.
Very often, oil companies will purchase derivative contracts that protect themselves from the impact of a drop in market prices for a specified time period (typically a year or two). These companies will tend to ignore price drops for as long as these contracts are in place.
There is also the issue of employee retention. In a sense, a company’s greatest assets are its employees. Once these employees are lost, it will be hard to hire and retrain new employees. So employees are kept on as long as possible.
The US keeps raising its biofuel mandate, regardless of the price of oil. No one stops to realize that in the current over-supplied situation, the mandate adds to low price pressures.
One brake on the system should be the financial pain induced by low oil prices, but this braking effect doesn’t necessarily happen quickly. Oil exporters often have sovereign wealth funds that they can tap to offset low tax revenue. Because of the availability of these funds, some exporters can continue to finance governmental services for two or more years, even with very low oil prices.
Defaults on loans to oil companies should also act as a brake on the system. We know that during the Great Recession, regulators allowed commercial real estate loans to be extended, even when property valuations fell, thus keeping the problem hidden. There is a temptation for regulators to allow similar leniency regarding oil company loans. If this happens, the “braking effect” on the system is reduced, allowing the default problem to grow until it becomes very large and can no longer be hidden.
4. Oil demand doesn’t increase very rapidly after prices drop from a high level.
People often think that going from a low price to a high price is the opposite of going from a high price to a low price, in terms of the effect on the economy. This is not really the case.
4a. When oil prices rise from a low price to a high price, this generally means that production has been inadequate, with only the production that could be obtained at the prior lower price. The price must rise to a higher level in order to encourage additional production.
The reason that the cost of oil production tends to rise is because the cheapest-to-extract oil is removed first. Oil producers must thus keep adding production that is ever-more expensive for one reason or another: harder to reach location, more advanced technology, or needing additional steps that require additional human labor and more physical resources. Growing efficiencies can somewhat offset this trend, but the overall trend in the cost of oil production has been sharply upward since about 1999.
The rising price of oil has an adverse impact on affordability. The usual pattern is that after a rise in the price of oil, economies of oil importing nations go into recession. This happens because workers’ wages do not rise at the same time as oil prices. As a result, workers find that they cannot buy as many discretionary items and must cut back. These cutbacks in purchases create problems for businesses, because businesses generally have high fixed costs including mortgages and other debt payments. If these businesses are to continue to operate, they are forced to cut costs in one way or another. Cost reduction occurs in many ways, including reducing wages for workers, layoffs, automation, and outsourcing of manufacturing to cheaper locations.
For both employers and employees, the impact of these rapid changes often feels like a rug has been pulled out from under foot. It is very unpleasant and disconcerting.
4b. When prices fall, the situation that occurs is not the opposite of 4a. Employers find that thanks to lower oil prices, their costs are a little lower. Very often, they will try to keep some of these savings as higher profits. Governments may choose to raise tax rates on oil products when oil prices fall, because consumers will be less sensitive to such a change than otherwise would be the case. Businesses have no motivation to give up cost-saving techniques they have adopted, such as automation or outsourcing to a cheaper location.
Few businesses will construct new factories with the expectation that low oil prices will be available for a long time, because they realize that low prices are only temporary. They know that if oil prices don’t go back up in a fairly short period of time (months or a few years), the quantity of oil available is likely to drop precipitously. If sufficient oil is to be available in the future, oil prices will need to be high enough to cover the true cost of production. Thus, current low prices are at most a temporary benefit–something like the eye of a hurricane.
Since the impact of low prices is only temporary, businesses will want to adopt only changes that can take place quickly and can be easily reversed. A restaurant or bar might add more waiters and waitresses. A car sales business might add a few more salesmen because car sales might be better. A factory making cars might schedule more shifts of workers, so as to keep the number of cars produced very high. Airlines might add more flights, if they can do so without purchasing additional planes.
Because of these issues, the jobs that are added to the economy are likely to be mostly in the service sector. The shift toward outsourcing to lower-cost countries and automation can be expected to continue. Citizens will get some benefit from the lower oil prices, but not as much as if governments and businesses weren’t first in line to get their share of the savings. The benefit to citizens will be much less than if all of the people who were laid off in the last recession got their jobs back.
5. The sharp drop in oil prices in the last 18 months has little to do with the cost of production.
Instead, recent oil prices represent an attempt by the market to find a balance between supply and demand. Since supply doesn’t come down quickly in response to lower prices, and demand doesn’t rise quickly in response to lower prices, prices can drop very low–far below the cost of production.
As noted in Section 4, high oil prices tend to be recessionary. The primary way of offsetting recessionary forces is by directly or indirectly adding debt at low interest rates. With this increased debt, more homes and factories can be built, and more cars can be purchased. The economy can be forced to act in a more “normal” manner because the low interest rates and the additional debt in some sense counteract the adverse impact of high oil prices.
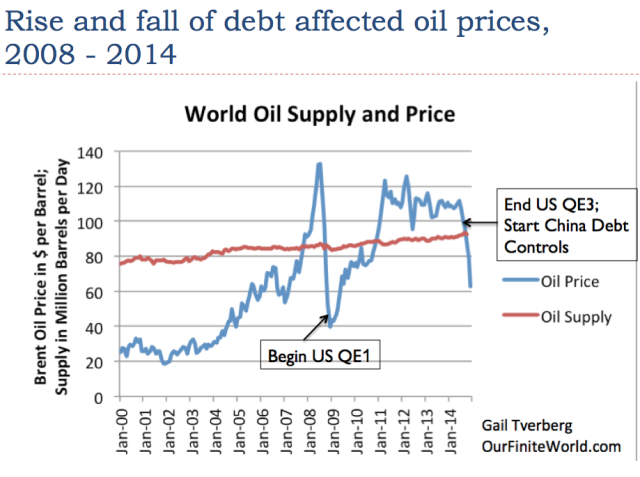
Figure 2. World oil supply and prices based on EIA data.
Oil prices dropped very low in 2008, as a result of the recessionary influences that take place when oil prices are high. It was only with the benefit of considerable debt-based stimulation that oil prices were gradually pumped back up to the $100+ per barrel level. This stimulation included US deficit spending, Quantitative Easing (QE) starting in December 2008, and a considerable increase in debt by the Chinese.
Commodity prices tend to be very volatile because we use such large quantities of them and because storage is quite limited. Supply and demand have to balance almost exactly, or prices spike higher or lower. We are now back to an “out of balance” situation, similar to where we were in late 2008. Our options for fixing the situation are more limited this time. Interest rates are already very low, and governments generally feel that they have as much debt as they can safely handle.
6. One contributing factor to today’s low oil prices is a drop-off in the stimulus efforts of 2008.
As noted in Section 4, high oil prices tend to be recessionary. As noted in Section 5, this recessionary impact can, at least to some extent, be offset by stimulus in the form of increased debt and lower interest rates. Unfortunately, this stimulus has tended to have adverse consequences. It encouraged overbuilding of both homes and factories in China. It encouraged a speculative rise in asset prices. It encouraged investments in enterprises of questionable profitability, including many investments in oil from US shale formations.
In response to these problems, the amount of stimulus is being reduced. The US discontinued its QE program and cut back its deficit spending. It even began raising interest rates in December 2015. China is also cutting back on the quantity of new debt it is adding.
Unfortunately, without the high level of past stimulus, it is difficult for the world economy to grow rapidly enough to keep the prices of all commodities, including oil, high. This is a major contributing factor to current low prices.
7. The danger with very low oil prices is that we will lose the energy products upon which our economy depends.
There are a number of different ways that oil production can be lost if low oil prices continue for an extended period.
In oil exporting countries, there can be revolutions and political unrest leading to a loss of oil production.
In almost any country, there can be a sharp reduction in production because oil companies cannot obtain debt financing to pay for more services. In some cases, companies may go bankrupt, and the new owners may choose not to extract oil at low prices.
There can also be systemwide financial problems that indirectly lead to much lower oil production. For example, if banks cannot be depended upon for payroll services, or to guarantee payment for international shipments, such problems would affect all oil companies, not just ones in financial difficulty.
Oil is not unique in its problems. Coal and natural gas are also experiencing low prices. They could experience disruptions indirectly because of continued low prices.
8. The economy cannot get along without an adequate supply of oil and other fossil fuel products.
We often read articles in the press that seem to suggest that the economy could get along without fossil fuels. For example, the impression is given that renewables are “just around the corner,” and their existence will eliminate the need for fossil fuels. Unfortunately, at this point in time, we are nowhere being able to get along without fossil fuels.
Food is grown and transported using oil products. Roads are made and maintained using oil and other energy products. Oil is our single largest energy product.
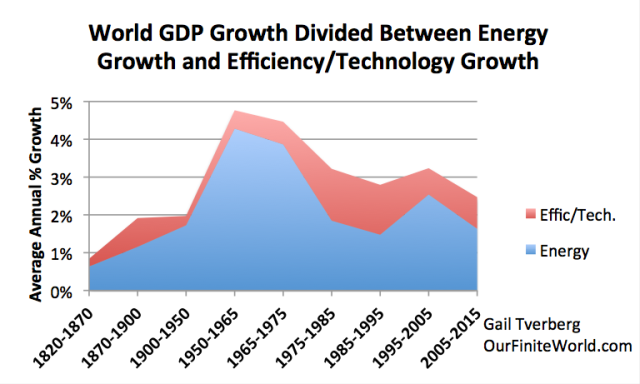
Experience over a very long period shows a close tie between energy use and GDP growth (Figure 3). Nearly all technology is made using fossil fuel products, so even energy growth ascribed to technology improvements could be considered to be available to a significant extent because of fossil fuels.
Figure 3. World GDP growth compared to world energy consumption growth for selected time periods since 1820. World real GDP trends from 1975 to present are based on USDA real GDP data in 2010$ for 1975 and subsequent. (Estimated by the author for 2015.) GDP estimates for prior to 1975 are based on Maddison project updates as of 2013. Growth in the use of energy products is based on a combination of data from Appendix A data from Vaclav Smil’s Energy Transitions: History, Requirements and Prospects together with BP Statistical Review of World Energy 2015 for 1965 and subsequent.
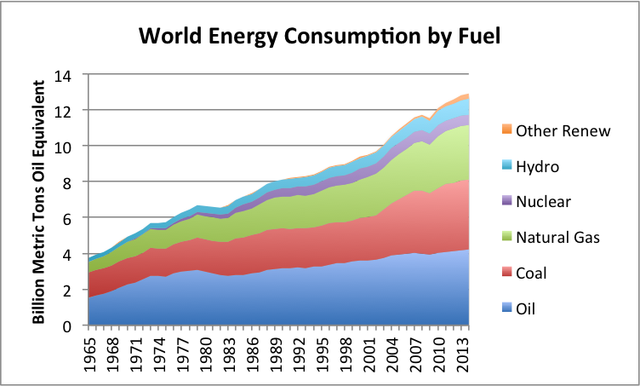
While renewables are being added, they still represent only a tiny share of the world’s energy consumption.
Figure 4. World energy consumption by part of the world, based on BP Statistical Review of World Energy 2015.
Thus, we are nowhere near a point where the world economy could continue to function without an adequate supply of oil, coal and natural gas.
9. Many people believe that oil prices will bounce back up again, and everything will be fine. This seems unlikely.
The growing cost of oil extraction that we have been encountering in the last 15 years represents one form of diminishing returns. Once the cost of making energy products becomes high, an economy is permanently handicapped. Prices higher than those maintained in the 2011-2014 period are really needed if extraction is to continue and grow. Unfortunately, such high prices tend to be recessionary. As a result, high prices tend to push demand down. When demand falls too low, prices tend to fall very low.
There are several ways to improve demand for commodities, and thus raise prices again. These include (a) increasing wages of non-elite workers (b) increasing the proportion of the population with jobs, and (c) increasing the amount of debt. None of these are moving in the “right” direction.
Joseph Tainter in The Collapse of Complex Societies points out that once diminishing returns set in, the response is more “complexity” to solve these problems. Government programs become more important, and taxes are often higher. Education of elite workers becomes more important. Businesses become larger. This increased complexity leads to more of the output of the economy being funneled to sectors of the economy other than the wages of non-elite workers. Because there are so many of these non-elite workers, their lack of buying power adversely affects demand for goods that use commodities, such as homes, cars, and motorcycles.1
Another force tending to hold down demand is a smaller proportion of the population in the labor force. There are many factors contributing to this: Young people are in school longer. The bulge of workers born after World War II is now reaching retirement age. Lagging wages make it increasingly difficult for young parents to afford childcare so that both can work.
As noted in Section 5, debt growth is no longer rising as rapidly as in the past. In fact, we are seeing the beginning of interest rate increases.
When we add to these problems the slowdown in growth in the Chinese economy and the new oil that Iran will be adding to the world oil supply, it is hard to see how the oil imbalance will be fixed in any reasonable time period. Instead, the imbalance seems likely to remain at a high level, or even get worse. With limited storage available, prices will tend to continue to fall.
10. The rapid run up in US oil production after 2008 has been a significant contributor to the mismatch between oil supply and demand that has taken place since mid-2014.
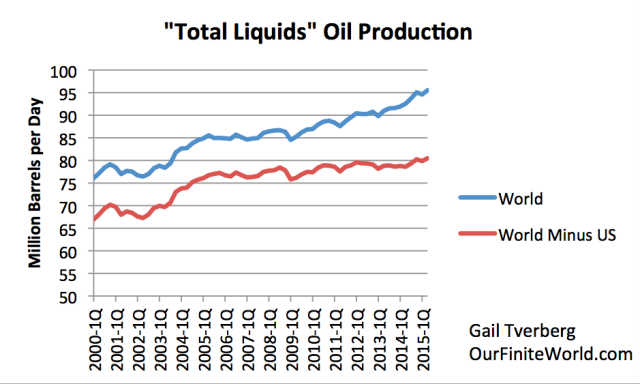
Without US production, world oil production (broadly defined, including biofuels and natural gas liquids) is close to flat.
Figure 5. Total liquids oil production for the world as a whole and for the world excluding the US, based on EIA International Petroleum Monthly data.
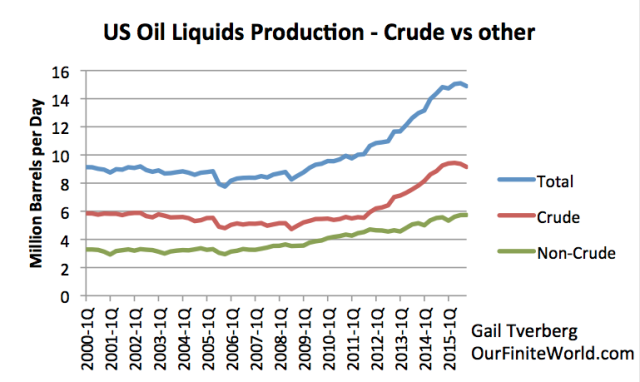
Viewed separately, US oil production has risen very rapidly. Total production rose by about six million barrels per day between 2008 and 2015.
Figure 6. US Liquids production, based on EIA data (International Petroleum Monthly, through June 2015; supplemented by December Monthly Energy Review for most recent data).
US oil supply was able to rise very rapidly partly because QE led to the availability of debt at very low interest rates. In addition, investors found yields on debt so low that they purchased almost any equity investment that appeared to have a chance of long-term value. The combination of these factors, plus the belief that oil prices would always increase because extraction costs tend to rise over time, funneled large amounts of investment funds into the liquid fuels sector.
As a result, US oil production (broadly defined), increased rapidly, increasing nearly 1.0 million barrels per day in 2012, 1.2 million barrels per day in 2013, 1.7 million barrels per day in 2014. The final numbers are not in, but it looks like US oil production will still increase by another 700,000 barrels a day in 2015. The 700,000 extra barrels of oil added by the US in 2015 is likely greater than the amount added by either Saudi Arabia or Iraq.
World oil consumption does not increase rapidly when oil prices are high. World oil consumption increased by 871,000 barrels a day in 2012, 1,397,000 barrels a day in 2013, and 843,000 barrels a day in 2014, according to BP. Thus, in 2014, the US by itself added approximately twice as much oil production as the increase in world oil demand. This mismatch likely contributed to collapsing oil prices in 2014.
Given the apparent role of the US in creating the mismatch between oil supply and demand, it shouldn’t be too surprising that Saudi Arabia is unwilling to try to fix the problem.
Conclusion
Things aren’t working out the way we had hoped. We can’t seem to get oil supply and demand in balance. If prices are high, oil companies can extract a lot of oil, but consumers can’t afford the products that use it, such as homes and cars; if oil prices are low, oil companies try to continue to extract oil, but soon develop financial problems.
Complicating the problem is the economy’s continued need for stimulus in order to keep the prices of oil and other commodities high enough to encourage production. Stimulus seems to takes the form of ever-rising debt at ever-lower interest rates. Such a program isn’t sustainable, partly because it leads to mal-investment and partly because it leads to a debt bubble that is subject to collapse.
Stimulus seems to be needed because of today’s high extraction cost for oil. If the cost of extraction were still very low, this stimulus wouldn’t be needed because products made using oil would be more affordable.
Decision makers thought that peak oil could be fixed simply by producing more oil and more oil substitutes. It is becoming increasingly clear that the problem is more complicated than this. We need to find a way to make the whole system operate correctly. We need to produce exactly the correct amount of oil that buyers can afford. Prices need to be high enough for oil producers, but not too high for purchasers of goods using oil. The amount of debt should not spiral out of control. There doesn’t seem to be a way to produce the desired outcome, now that oil extraction costs are high.
Rigidities built into the oil price-supply system (as described in Sections 3 and 4) tend to hide problems, letting them grow bigger and bigger. This is why we could suddenly find ourselves with a major financial problem that few have anticipated.
Unfortunately, what we are facing now is a predicament, rather than a problem. There is quite likely no good solution. This is a worry.
|


